
This tutorial will show how to create a Power BI progress tracker for sales and order data. You’ll learn how to solve a scenario where you have more than one date in your Fact table.
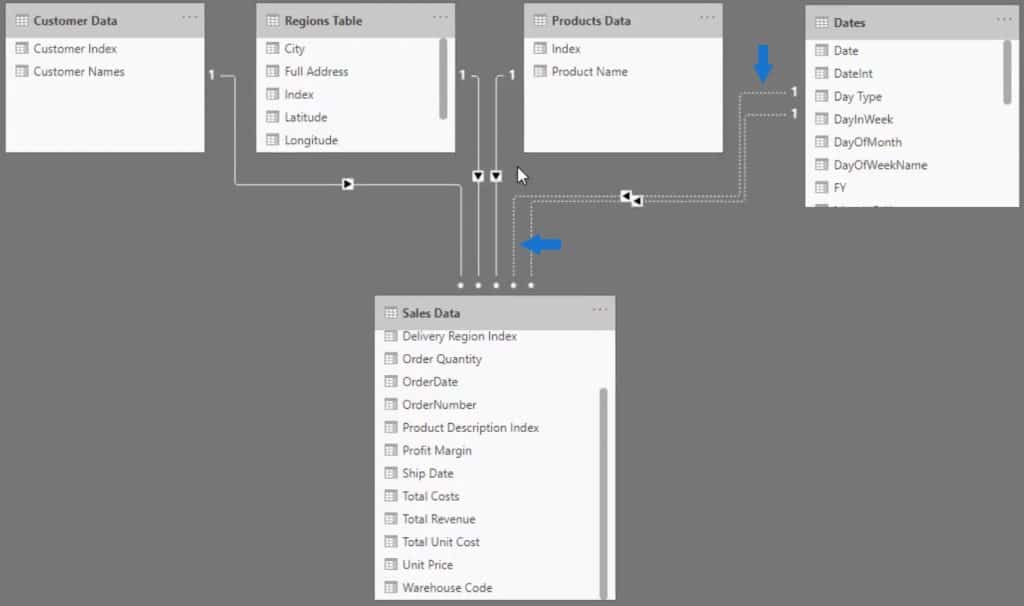
This is the Sales table that will be used in this tutorial.
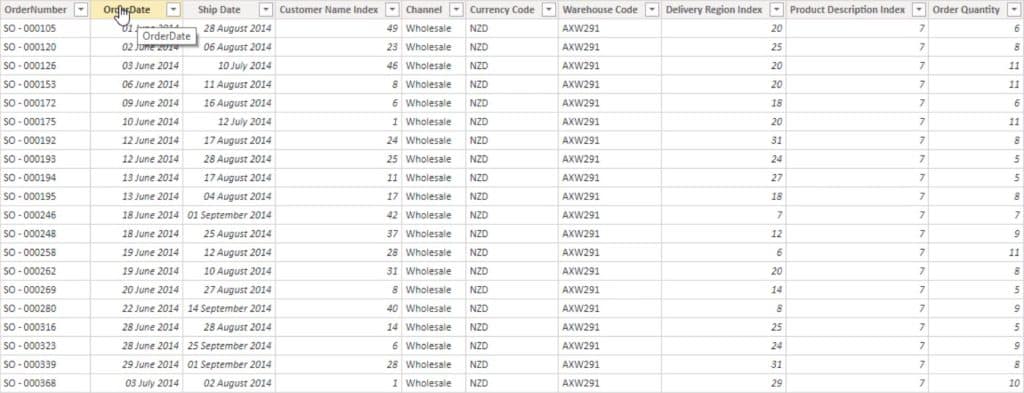
You can see that it has two date columns, Order Date and Ship Date. From there, you need to know how many orders are currently in progress between the order and ship dates. That can then be relayed into multiple scenarios with the same DAX formula pattern.

Data Model For The Power BI Progress Tracker
There are a couple of things that you need to take note. The events in progress mean that you have to create more than one relationship between the Dates table and Sales Data table in the data model.
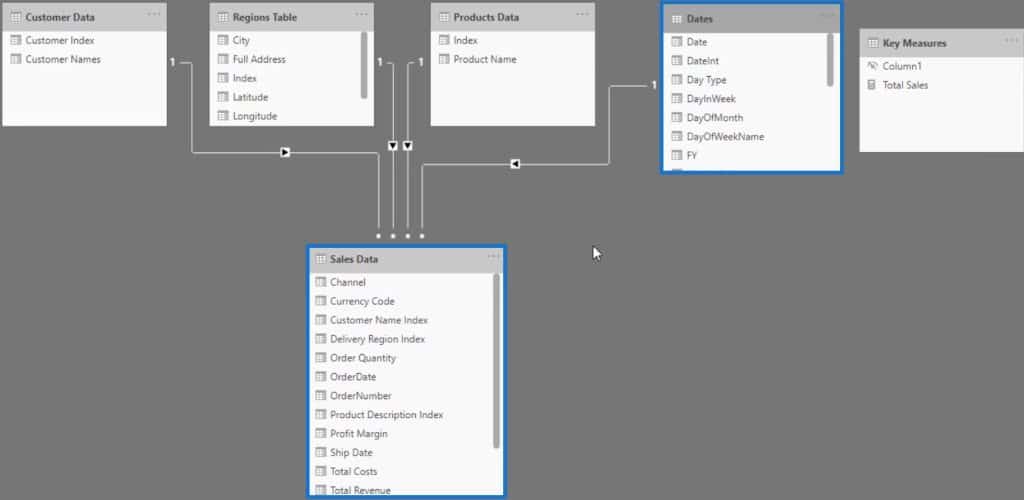
Then, you need to make those relationships inactive to avoid overriding another relationship. In the data model, you can see that the Dates table is linked to the Sales Data table.
So if you create a relationship between the Dates table’s Date column and Sales Data table’s Ship Date columns, you’ll see that only one relationship is active.
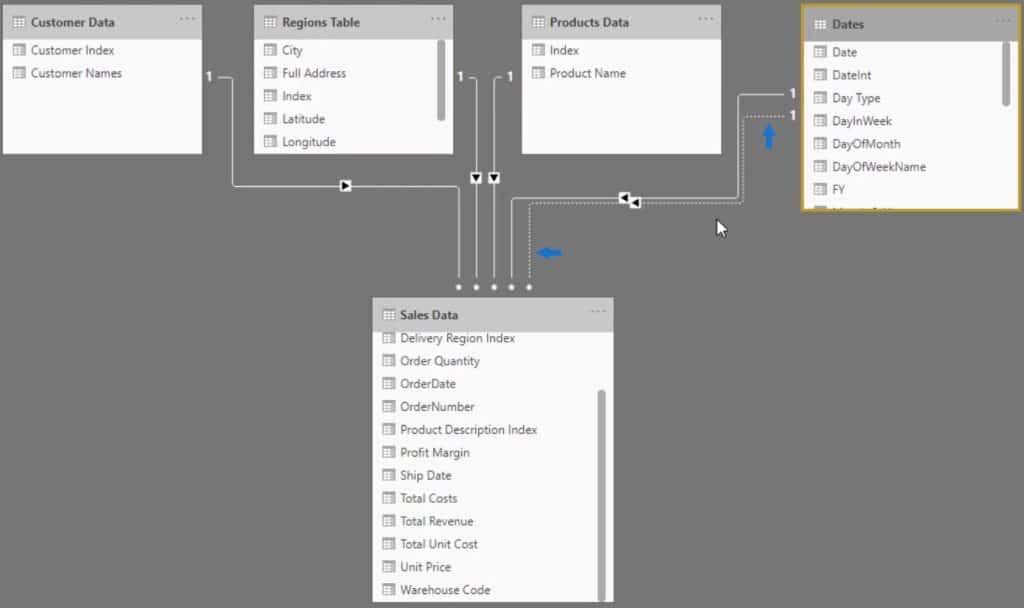
To make both relationships inactive, click the active relationship and uncheck the box that makes it active.
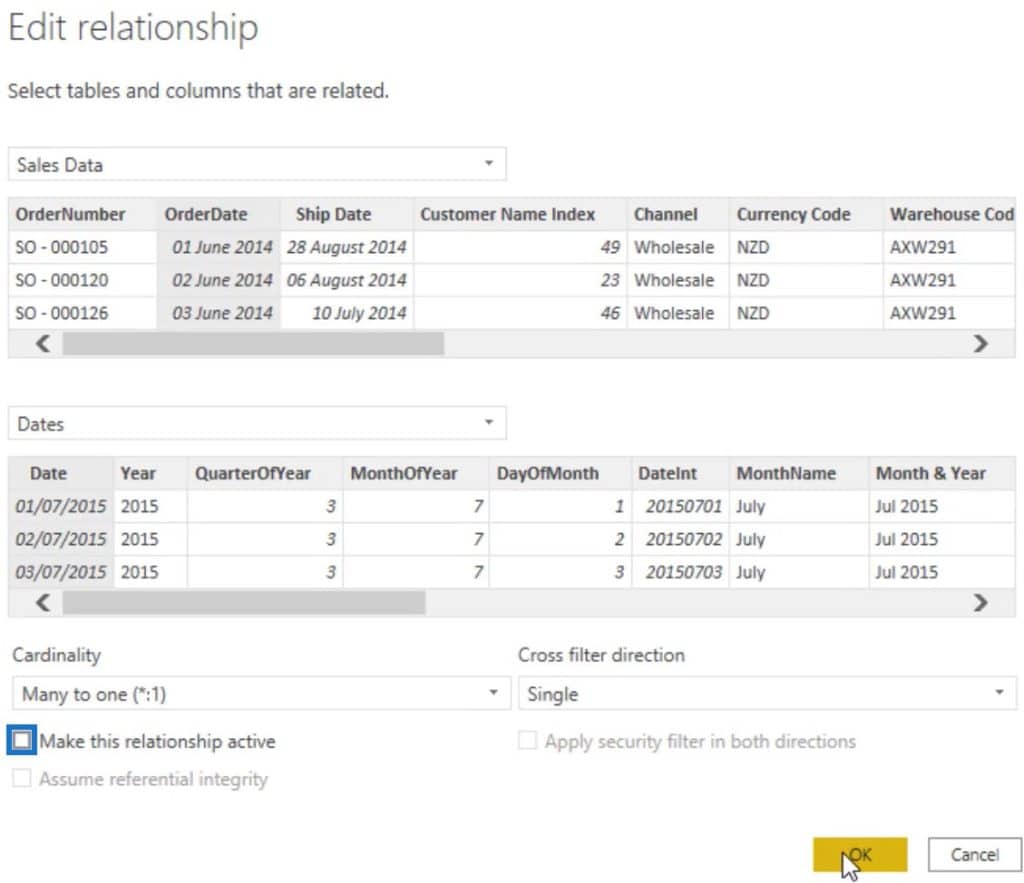
Once done, both relationships will be inactive and you can then use them in your DAX formula.
Measures Used In The Power BI Progress Tracker
The data model creates some issues that you have to deal with in your report. For instance, if you drag the Total Sales measure in the report, you’ll get the Total Sales of the entire Sales table.

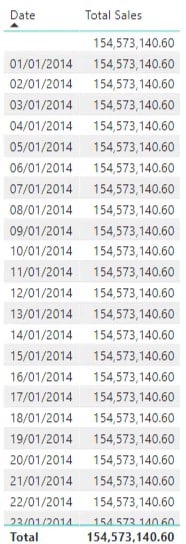
The reason for the issue is that the measure doesn’t know what to filter because there are no active relationships with the Dates table and Sales Data table. So if you drag the Dates table’s Date column into the report, it won’t filter anything down in the Sales Data table.
If you want to run events in progress, you have to make a decision. You can either create a different table that can run a very specific calculation or use a CALCULATE statement and USERELATIONSHIP function to calculate your core measures.
If you choose to use the latter, the Total Sales column in the report will give the correct values.
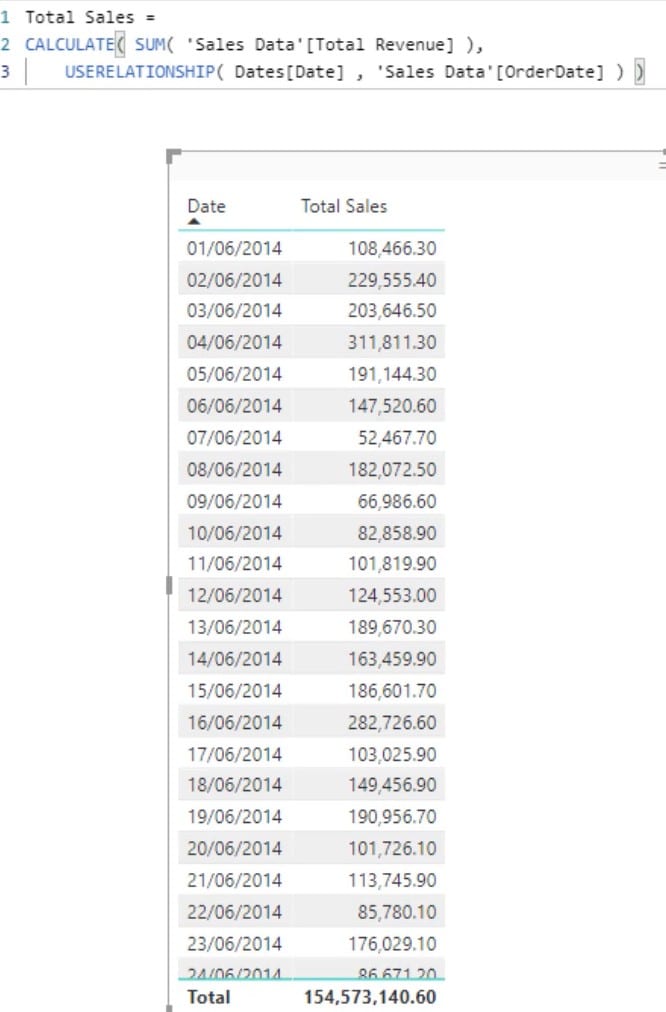
By doing this, you won’t need to create another Date table. You can then run the calculation and the events in progress calculation.
The Sales In Progress Measure
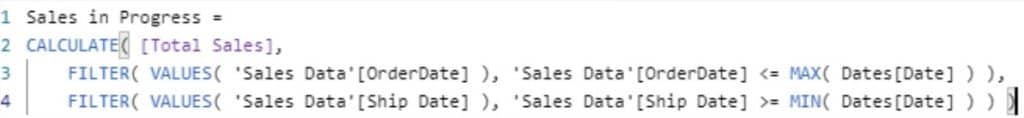
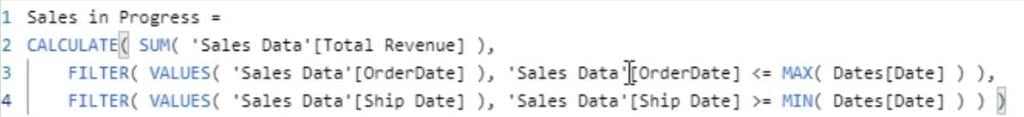
There is a formula pattern that you can use to know how many transactions or the Sales between the Order date and the Ship date. Using the Sales data, name the measure Sales in Progress. Then calculate the Total Sales within a different context using the CALCULATE function.
Next, use the FILTER function to create filters to work on the analysis. For the first filter, filter VALUES with the Sales Data’s OrderDate. Then, input a filter expression. In this case, the Sales Data’s Order Date should be less than or equal to the MAX Date of the Dates table.
For the second filter, copy the previous filter and change OrderDate to ShipDate and the expression to greater than or equal to the MIN Date of the Dates table. Once done, press Enter to load the measure.
Now, if you drag the Sales In Progress measure into the report, you’ll see that it’s not returning the correct results. It’s because the Total Sales in the CALCULATE function is not the SUM of the Total Revenue.
Changing that parameter will then show the correct results.
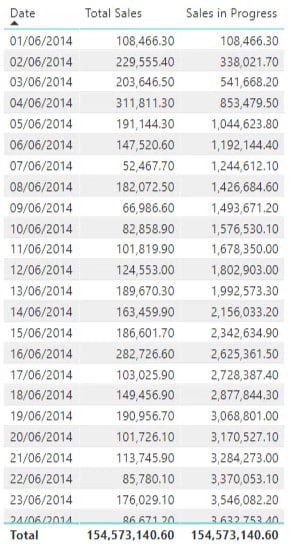
If you remove the Total Sales from the report and turn it into a chart, the data will start to make sense.
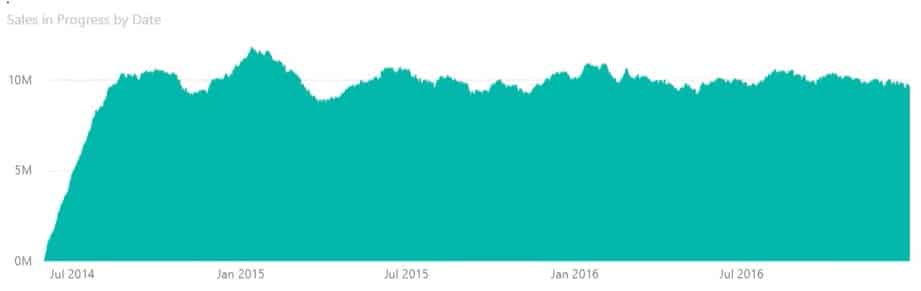
The result is working through the complex data by evaluating every row in the Sales table and making sure that they follow the filter expressions.
The trick lies in the data model with two inactive relationships. Those relationships are then used and called in a measure using the CALCULATE statement.
The Orders In Progress Measure
Learning and reusing the formula pattern multiple times is recommended. Reuse this pattern using Orders. Create a new measure and name it Orders In Progress. Copy the formula pattern of the Sales In Progress measure and paste it in the new measure.
Next, change the parameters inside the CALCULATE statement from SUM of the Total Revenue to COUNTROWS of the Sales Data table. Then, copy the Sales In Progress chart and change the Values field from Sales In Progress to Orders In Progress.
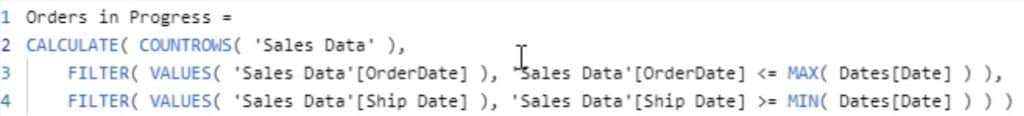
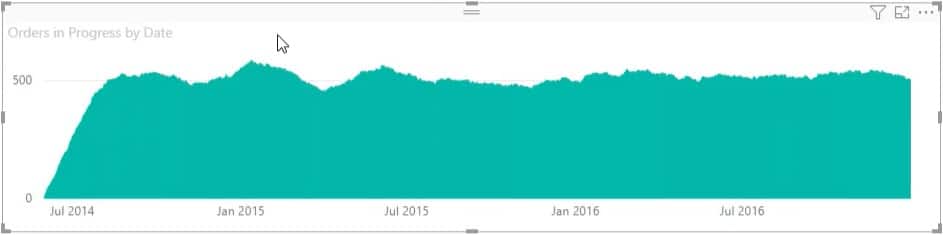
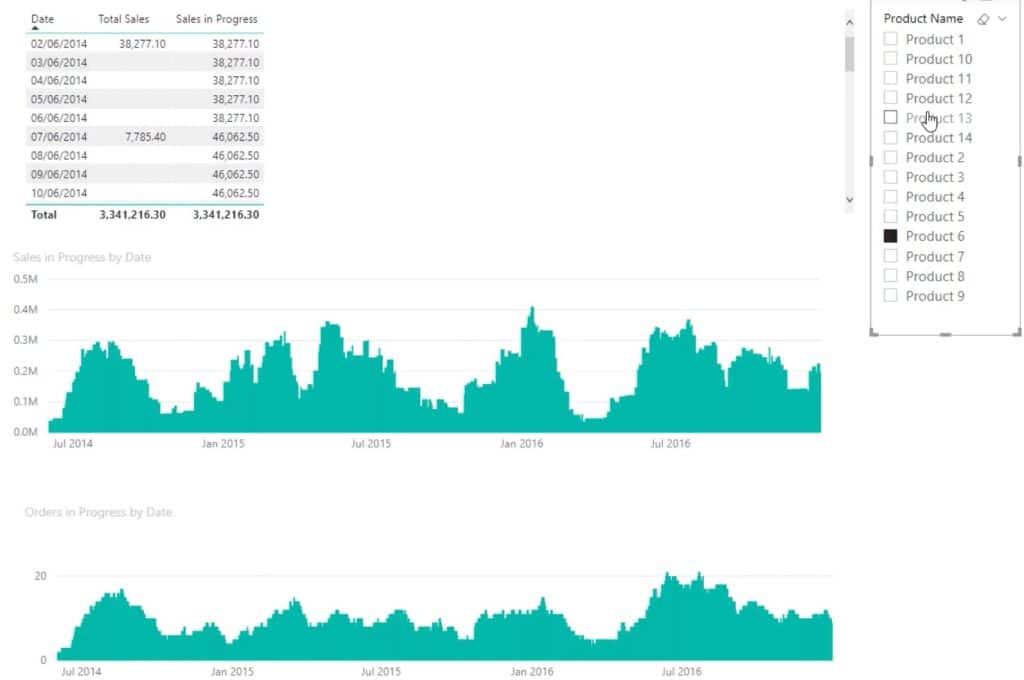
Once done, you can then see the number of actual orders in progress which indicates how many products have been ordered but not shipped on a particular date.

You can also create additional filters. If you want to see the trend of a product in terms of the orders, you can add a selection slicer to filter data and show you information based on the selection. In this example, sales and orders for Product 6 are provided.
***** Related Links *****
Logistics Insights For Power BI – DAX And Data Modeling Overview
Time-Related Insights From Your Supply Chain Metric
New Showcases For Valuable Delivery Application and HR Interview Insights
Conclusion
Inventory control and progress tracking are important business metrics. It’s best to create a data tracking report to monitor sales and orders in progress using visualizations and slicers in Power BI. With the right dataset and DAX functions, a great report can be made.
Sam


