Dynamic ranking in Power BI can be tricky if you don’t fully understand how it works. You might think that you got the formula right, but then you’d be surprised why you’re not getting the correct results.
The key is to really understand the context that you’re working on and simplify your formulas.
Knowing your DAX functions is sometimes not enough. You must learn the technique in combining the correct DAX functions and working out the correct formula.
Dynamic Ranking By Group Using RANKX
A common scenario around dynamic ranking is creating dynamic tables for customer groups, such as top 5 or top 10 etc. While you know that RANKX is the appropriate DAX function to use, how to implement it correctly is another thing. Here’s an example of this scenario.
This scenario is from the Enterprise DNA Forum, where a member was trying to get his top 10 customers, ranking them based on quarterly sales. When he tried to place his ranked customers in a matrix table, some of the customers are showing duplicates.
In his table, he has two groups identified: Top 10 and All Others. However, with his formula, some customer names are showing up as his top 10, but no Total Sales results, and at the same time, they’re on the “All Others” table, where they should be.

Here’s the formula he made:

The solution was simple: understand the context.
In this case, we have the quarterly context. This means that we’re now working out the top 10 customers in each quarter, not the top 10 customers from the beginning of time. To make this work, we need to break down the formula.
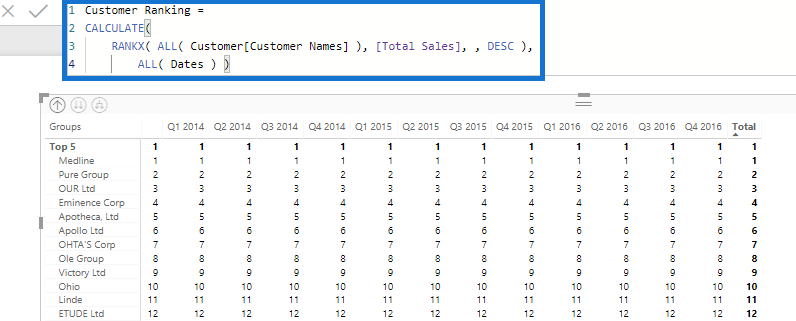
First, we remove filters from the Date table, so we won’t get a wide spread of ranking for our customers.

Here’s an efficient formula to get the top 10 customers, no matter what the date context is.

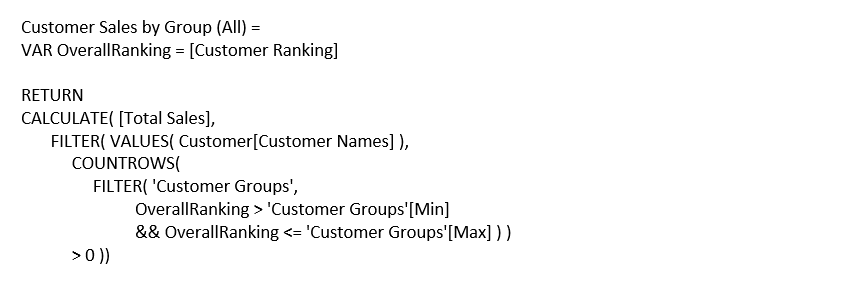
Then, we incorporate this formula into the grouping calculation as a variable (VAR).

This is how you use the RANKX function effectively, giving you the correct results that you’re looking for. If you have more questions about dynamic ranking by groups, I highly recommend that you check out the related links below.
Dynamic Ranking Using SWITCH TRUE
Another example scenario discussed in an Enterprise DNA Forum post about dynamic ranking implemented the SWITCH TRUE logic.
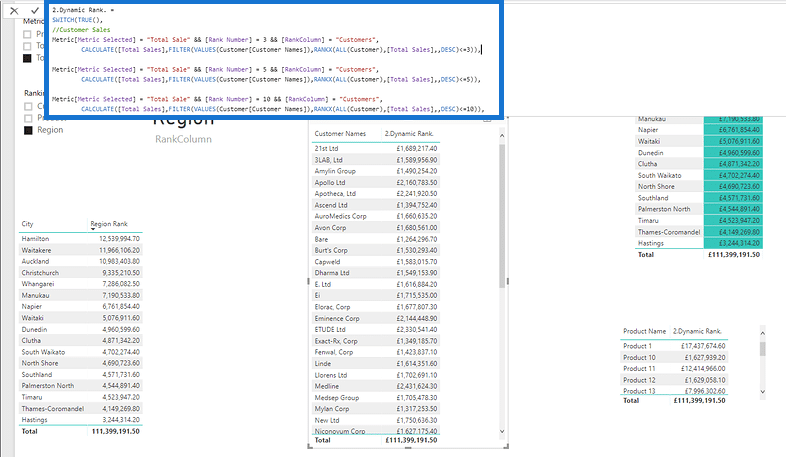
Initially, the member just shared his great experience with Power BI ranking using SWITCH. But then he was slightly confused with the formula structure he’s been trying to create. The member specifically wanted to do some ranking on Sales LQ, so he went on to create a measure for Sales LQ and use SWITCH and RANKX.
The issue was in 2.Dynamic Rank, which is the last section of //Region Ranking Sale. It doesn’t look right because the city table shows >3 results, which should only be the first 3.


The solution I gave him was to simplify the formula. This is quite common among Power BI users. You could get overwhelmed by DAX functions. In this case, the formula that this member created was too complicated (far more than it needs to be).
SWITCH TRUE is an amazing function logic in Power BI, but you must learn when and how to use it and integrate it seamlessly into your calculations. I recommended him the following tutorials that showcase the techniques in dynamic ranking.
Group Customers Dynamically By Their Ranking w/RANKX In Power BI
Using Dynamic Visuals On Ranking Based Parameters In Power BI
In this case, the ranking may work in other aspects of the formula, but it’s not entirely the correct technique. That is why there’s a slight issue in the Region Ranking Sale results.
This is a good example on why DAX formulas don’t work exactly the way you wanted it. There’s no point in providing a solution to this concern to change only one part of the calculation, as the entire formula itself is way too complicated. Simplify your formulas by implementing the correct technique.
Conclusion
Dynamic ranking in Power can bring you great insights from your analysis. However, if you don’t fully understand how it works, you’ll get lost in the middle of your calculations.
Two things that you need to understand in this tutorial are understanding the context you’re working on and creating the correct formulas. When you know the context, you’ll know what DAX functions to combine and how to do it. The key is to simplify your calculations.
All the best!
Sam
***** Learning Power BI? *****
FREE COURSE – Ultimate Beginners Guide To Power BI
FREE COURSE – Ultimate Beginners Guide To DAX
FREE – 60 Page DAX Reference Guide Download
FREE – Power BI Resources
Enterprise DNA Membership
Enterprise DNA Online
Enterprise DNA Events

***** Related Links*****
Creating Dynamic Ranking Tables Using RANKX In Power BI
Group Customers Dynamically By Their Ranking w/RANKX In Power BI
RANKX Considerations – Power BI And DAX Formula Concepts
***** Related Course Modules *****
DAX Formula Deep Dives
Advanced DAX Combinations
Mastering DAX Calculations
***** Related Support Forum Posts *****
Row Level Security and RANKX
Power BI DAX Dynamic Ranking
Need Help With Complex Ranking/Cumulative Scenario
For more ranking in Power BI queries to review see here…..


