In this tutorial, I’m going to cover the best time intelligence function, the Power BI DATEADD. It’s one of the time intelligence functions that you should introduce yourself to as soon as possible when learning Power BI. You may watch the full video of this tutorial at the bottom of this blog.
The Power BI DATEADD DAX function is known for its versatility and ability to analyze and compare different timeframes so easily. Once you understand how to use it, you’ll see how valuable this function is.
Time intelligence is a subset of functions within the DAX formula language that you can utilize to run time-specific analyses. And I’m going to show you how you can do a lot of those analyses with just this one function.
Using Power BI DATEADD To Analyze Data From The Previous Year
I have here a really simple calculation of my Total Sales to begin with, but you can use any core measure here.

It’s important to create your core measures at the beginning of your model development. Core measures include sales, quantity, costs, transactions, and so on. And then from there, you can do all this fancy analysis from those core measures.
From here, I want to analyze my sales the previous year, and I have my Sales LY formula for that. This makes it easy for us to compare one period versus another.
In the table, you can see that the previous year’s sales started only on the first of the sixth in 2014. And so this is the very first number or the amount that is coming through in the sales last year.

Let’s look at the formula.
I’m using the CALCULATE function for this calculation. With any time intelligence, you should really have a solid understanding of how this function works.
Remember that CALCULATE changes the context of the calculation. And so in this formula, I’ve embedded the Total Sales measure inside CALCULATE. It’s running Total Sales, but I’m changing the context of the calculation.
Then I change the period with the DATEADD function and within DATEADD, I place the Date column.

And then, I do minus one (1) YEAR. I can actually change this into minus two or minus three, etc. And I can also change the timeframe. Instead of YEAR, I can choose DAY, QUARTER, or MONTH. This is where versatility comes in. but in this case, I choose YEAR.

Power BI DATEADD vs SAMEPERIODLASTYEAR
Now, how about SAMEPERIODLASTYEAR? What’s the difference between the Power BI DATEADD and the SAMEPERIODLASTYEAR function?
The thing about DATEADD is that you can go day, month, quarter, and year. You have all of this versatility. That’s why I believe that DATEADD is just a better way to do it. It’s just super easy to make a time-related analysis with this function.
The SAMEPERIODLASTYEAR function does only one calculation, while DATEADD can do a number of calculations over any number of timeframes.
To demonstrate that, I have here a calculation for sales last quarter (Sales LQ). If you look at the formula, it’s basically the same. All I’ve done is changed the timeframe from year to quarter, and then I’ve got sales last quarter.

And so, we can compare quarter on quarter numbers based on the DATEADD function.
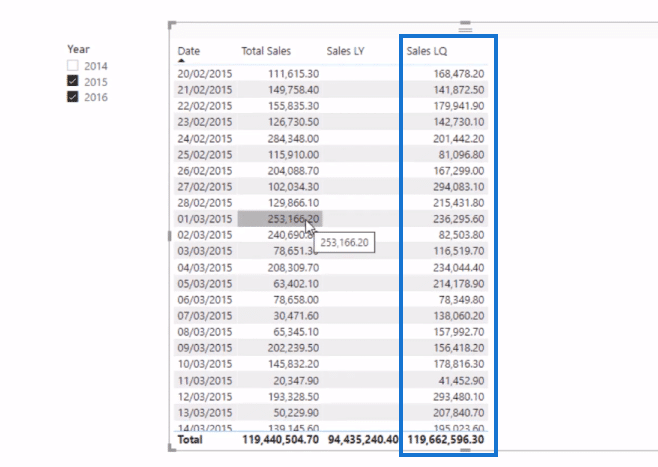
I also have two quarters ago. I just changed the number to -2.

The formula pattern is the same. I just changed the parameters. The same goes to my last three quarters calculation.

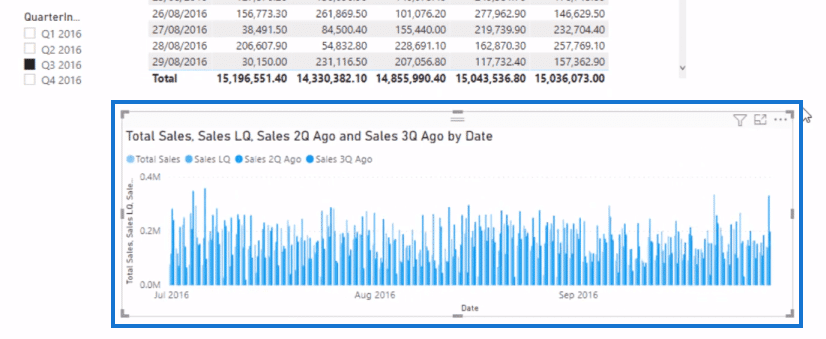
Then, you can easily create another visualization out of those measures. Below is an example of how you can do your visualizations. This chart is quite busy though, but you can always take out some information here to make it more meaningful.
Measure Branching With DATEADD Measures
Another great thing about DATEADD is that it’s a great way to build calculations and enables you to branch out into other calculations. My difference in sales (Diff in Sales) calculation is a good example of measuring branching. I was able to create this formula because I have the Sales LQ.

I simply started with my core measures, and then branched out to this measure. I drag the measure into the table, and now we can see the difference in sales.
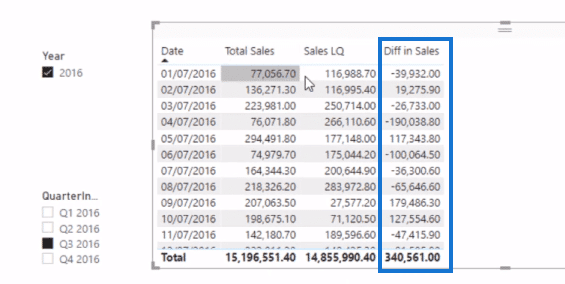
I can also create another visualization with my Diff in Sales measure for a more informative report. I can also select on the slicer the quarter that I want to see and analyze.

Using The Analyst Hub To Format Measures
Now I’m going to show you how you can create a better formula setup within the Enterprise DNA Analyst Hub.
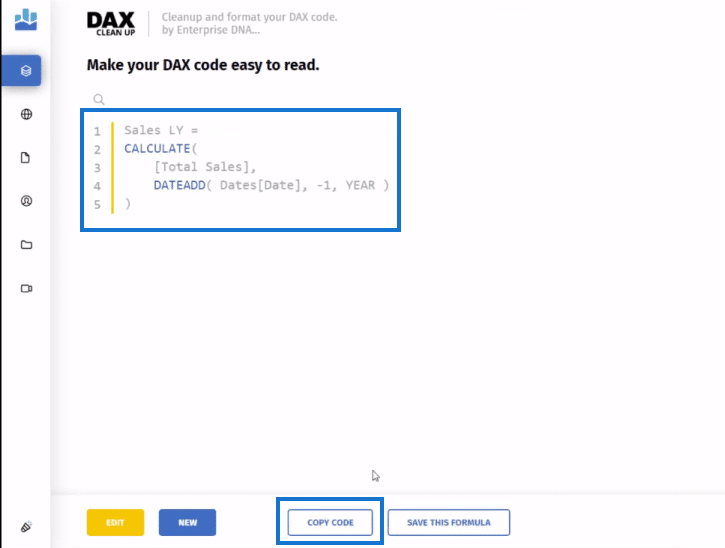
Let’s take the formula, Sales LY as an example. I just copy and paste it into the DAX Clean Up inside the Analyst Hub.
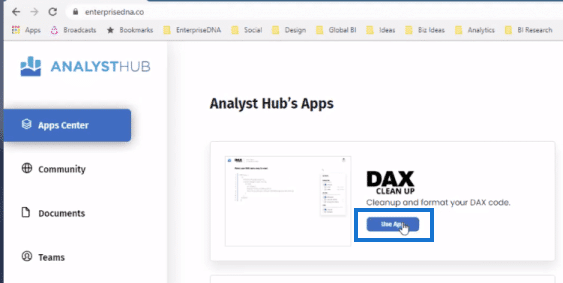
Here I can format it well so it’s easy to read and understand. Then, I copy the formatted formula by clicking on Copy Code down below.
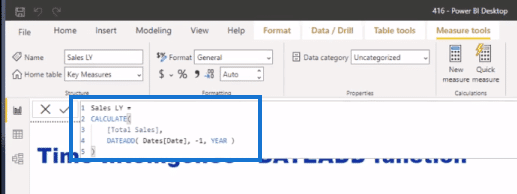
I’ll paste it back into my model, and now you see that I have nice formatting.
And then, I’m going to go back to the Analyst Hub and save this formula. I’ll call this DATEADD Last Year, and type in the description. I’ll click on the share to community button so it will be available to all Analyst Hub users.

With this formula saved in the documents, I can now reference it.
For example, I want to create a new measure for my sales two years ago, I can just quickly copy the formula that I saved in the Analyst Hub, and paste it in here. All I need to do is change the name of the formula (Sales 2yrs Ago) and the parameters (-2). And that is the huge benefit of using the Analyst Hub.

***** Related Links *****
The DATEADD Function: The Best And Most Versatile Time Intelligence Function in Power BI
Power BI Time Functions: DATEADD And More
Common Time Intelligence Patterns Used In Power BI
Conclusion
I hope you can see how important the Power BI DATEADD function is for your time-related analyses. It’s the easiest to use time intelligence function. With its versatility, you can create a range of measures and generate meaningful insights.
I recommend that you explore more on this function and implement it in your own work environment.
All the best,
Sam


