
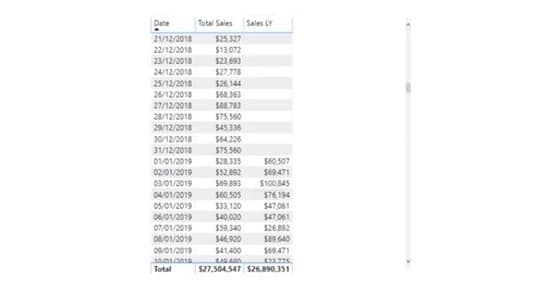
In this article, I am going to talk about time intelligence functions in Power BI. We have already touched on a previous example with the fields Date, Total Sales, and Sales Last Year. As you can see, there is no data in Sales LY prior to 2019.
In the DAX Formulas Reference Guide, you can see nearly every DAX function. In the guide, there is an entire section dedicated to time intelligence functions. You may watch the full video of this tutorial at the bottom of this blog.
You will use some of these quite a lot while other function you may rarely or never use.

A lot of these functions actually calculate the same thing, only at different granularities. For example, in the functions DATESMTD, DATESQTD, and DATESYTD, they use months, quarters, and years respectively to calculate the same thing over different timeframes.

With this in mind, there are not that many functions to work with since most of them work in a similar way.
Power BI Time Functions: DATEADD With CALCULATE
To continue, let us go over a few other functions which I think would be easy for you to understand.
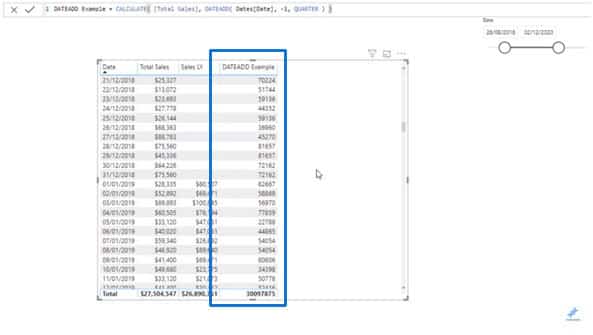
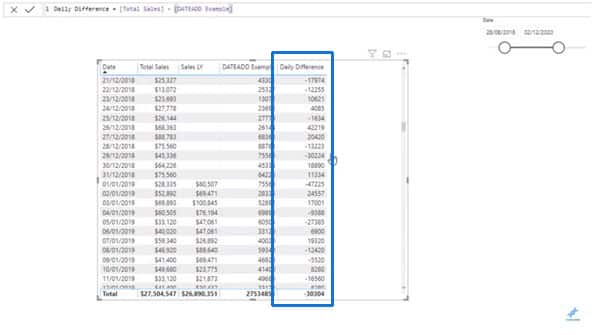
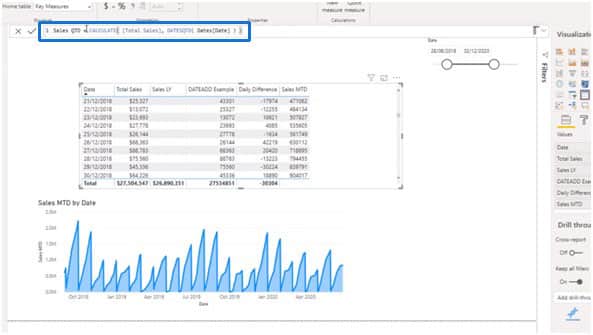
I am going to show you a function called DATEADD which is actually my favorite time comparison function.
Basically, DATEADD allows you to jump between any number of timeframes when used inside the CALCULATE function.
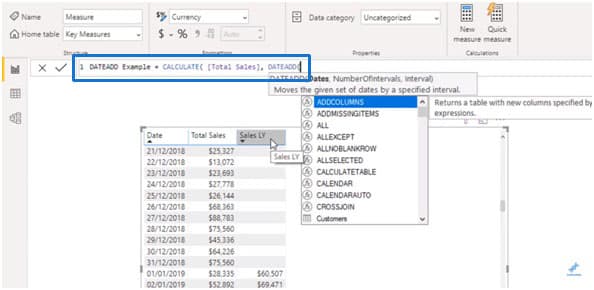
There was a function that we used called SAMEPERIODLASTYEAR which only allows you to jump one year. With DATEADD, you can input a range of different intervals.

In our Date column, I could input -1 as our number of intervals and select either DAY, MONTH, QUARTER, or YEAR as our interval.
By selecting YEAR as the interval, I could actually get the same results as our Sales LY column.
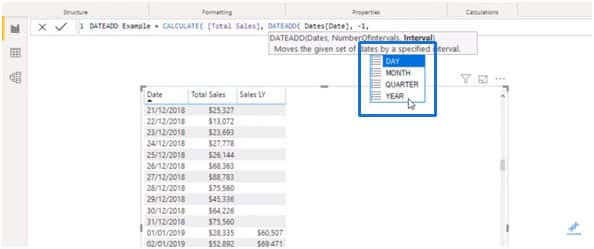
The reason I like the DATEADD function is because of its versatility. I can just select QUARTER instead of YEAR, and simply drag in the new measure to look at my quarterly values.
I could also change the number of interval from -1 to -2 to jump back two quarters.
If I wanted to look at two days ago, I would simply change QUARTER to DAY. I could also make -2 positive if I would like to look at two days after.
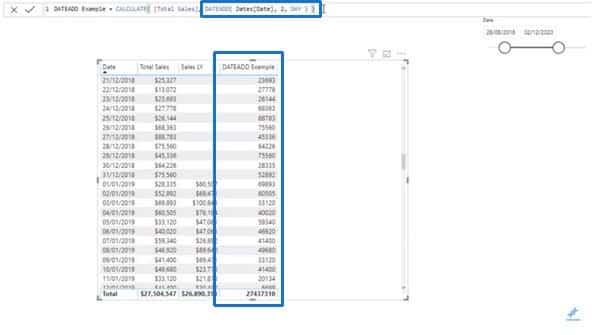
There is a lot of versatility with the DATEADD function and that is why I like it. I think you will like it too after spending time on it by using it as part of your other calculations or measures.
For instance, you want to work out the difference between today and yesterday. To get there, you could set the number of intervals of the DATEADD function to -1 and then create another measure to work out the difference.
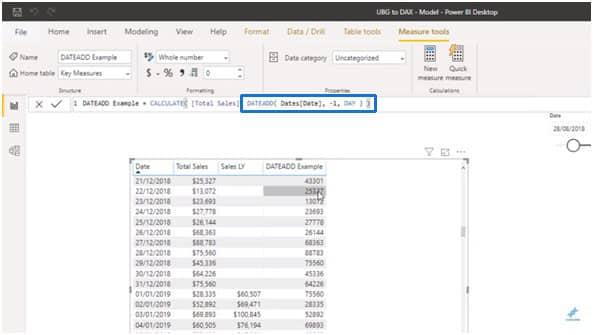
Finally, we could create a new measure called Daily Difference. All I’m going to do is to take the Total Sales column and subtract it from the DATEADD Example measure, which is our previous day.
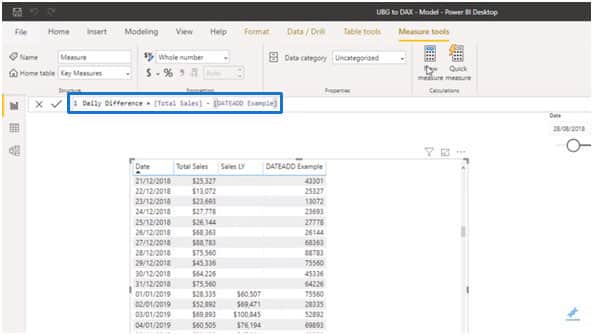
I could just drag in the new measure, and now we can see the difference.
This is how time intelligence functions can take you to many different directions depending on what you want to find.
So let us do a few more examples just to give you an idea on what is possible here.
Power BI Time Functions: DATESMTD and DATESQTD
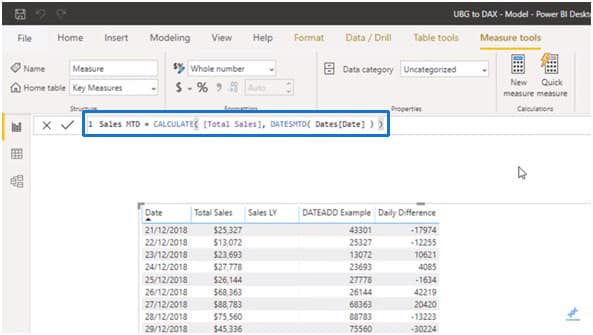
What if we wanted to calculate a month to date value? I am going to create a new measure called Sales MTD and put Total Sales inside CALCULATE.
There is another function set up specifically for this purpose. What is so great about time intelligence functions in Power BI is that there is a whole group of table functions set up specifically just for time-related insights. Without these, things would be more complicated.
I could use a function called DATESMTD which returns a set of dates in the month up to the current date. All I have to do in this function is to enter the Date column.
If I drag it in, I am now getting a cumulative monthly total.
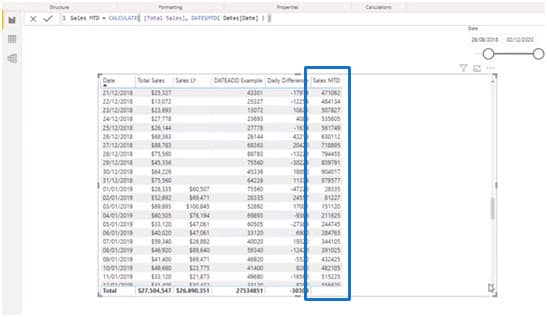
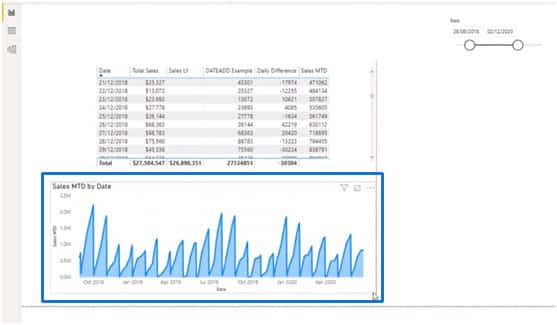
If I wanted to see things more clearly, I could copy and paste the whole table and remove the other measures so that Sales MTD would remain. I would then choose a graph under Visualizations.

So you see here that I am now getting a cumulative total of the month to date numbers shown in my visualization.
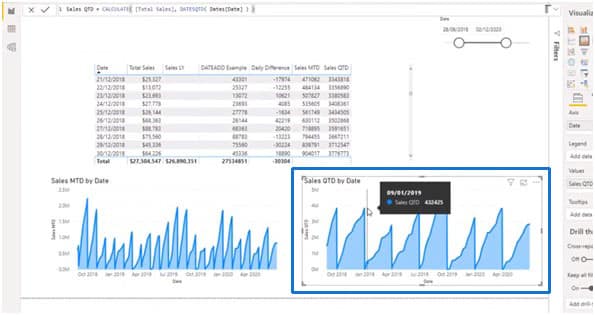
I could also create a new measure called Sales QTD which is exactly the same as Sales MTD, except now I am using the function DATESQTD.
It is exactly the same thing – I am just changing the function that I am using. This is where it comes down to having a good understanding of what you want to see.
A lot of these functions have clear-cut purposes, making it easier to just input them into the correct environment or analysis.
Through visualizing Sales QTD, you will also see the cumulative total on a quarterly basis.
***** Related Links *****
Time Comparison For Non Standard Date Tables In Power BI
The DATEADD Function: The Best And Most Versatile Time Intelligence Function in Power BI
Common Time Intelligence Patterns Used In Power BI
Conclusion
This is just an introduction on time intelligence functions in Power BI and how you use them. I really want you to explore more on how they operate in your own models.
For example, you can go one step further and find the percentage difference between yesterday and today.
These are some of the things that you can branch out to when you utilize time intelligence functions effectively.
All the best,
Sam


