
For today’s tutorial, I will discuss one of my favorite techniques around Power BI custom icons, which uses custom icons in a dynamic way in Power BI visuals. This tutorial is inspired by an entry over at the Enterprise DNA forum, wherein one of our members is having trouble adding custom icons to his card visuals. I will show how you can resolve this problem efficiently. You can watch the full video of this tutorial at the bottom of this blog.
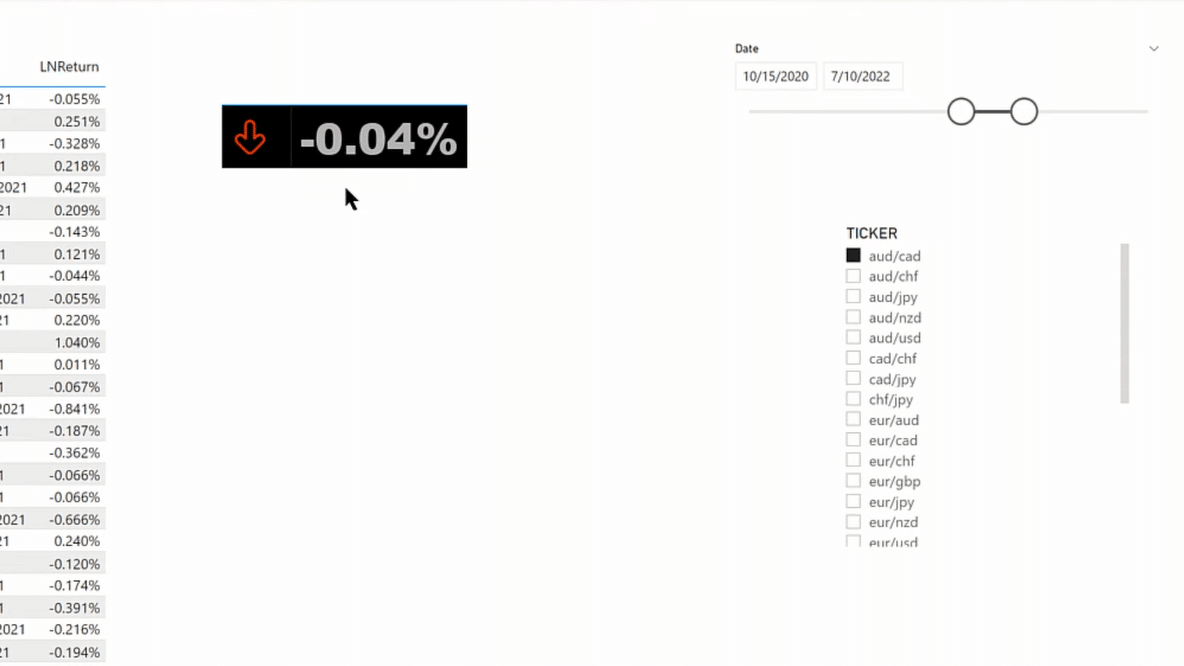
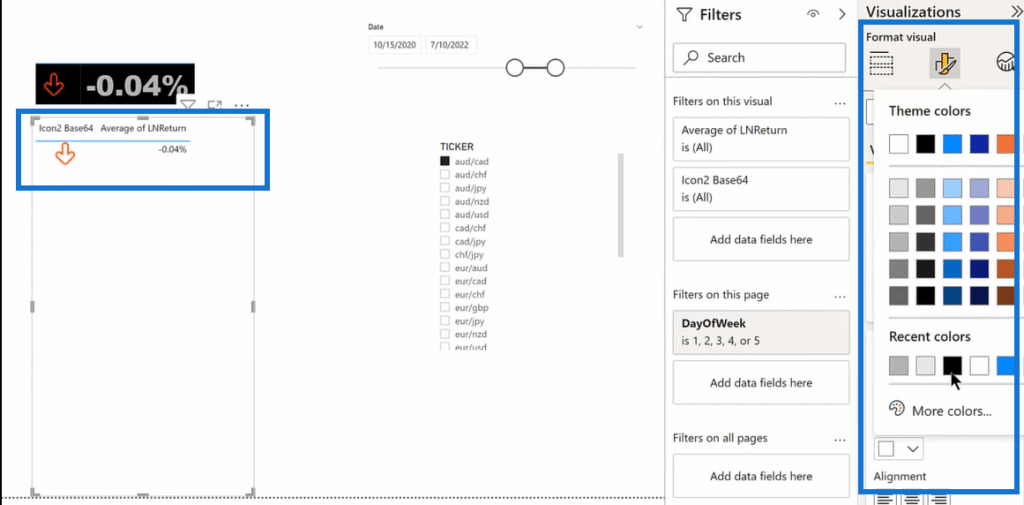
This is the outcome that the member wanted, which is a simple card visual with text – an up arrow if the value of the measure is positive and a red down arrow if the value is negative. If we click here to a different part of the ticker, you’ll see that it dynamically changes to a green up arrow when it’s positive and then a red down arrow when it’s negative.

Dynamic Power BI Custom Icons In Your Reports
One way to incorporate this is by using Base64 conversion. Base64 takes binary files and converts them into ASCII text. There’s no direct way to incorporate binary image files into a Power BI report. So, you have to go through this encoding through Base64 in order to do that.
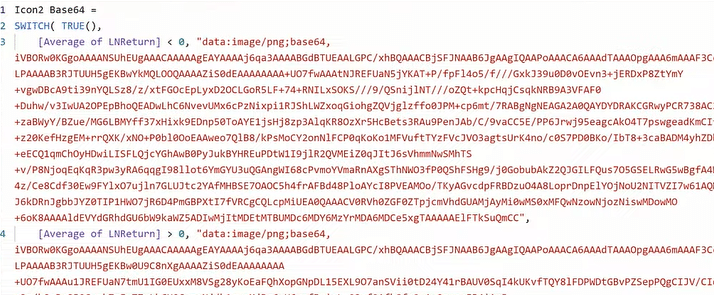
I’ll show you the general structure that I use for this, which is just a basic SWITCH TRUE construct. In this case, the measure that we’re looking at is this Average of LNReturn (log normal returns). If it’s less than zero, it gets a certain value. If it’s greater than zero, it gets a different value. And then, for the sake of simplicity, I’ve said if it’s neither of those, (as in this case) if it’s equal to zero, it just gets left blank.

And the chances of this averaging to exactly zero are very small. But, you could put a third value in here, which is just maybe a horizontal arrow that shows no change, or you could use blank. I’ve just done this to simplify the measure for illustrative purposes.
Now, let’s take a look first at custom icons. The custom icons that I use are from a site called Flaticon. I have no affiliation with Flaticon. I just happen to think it’s a really good site. It lets you organize the icons in a really nice way. It allows you to edit them as well. I use these a lot in my Power BI reports.
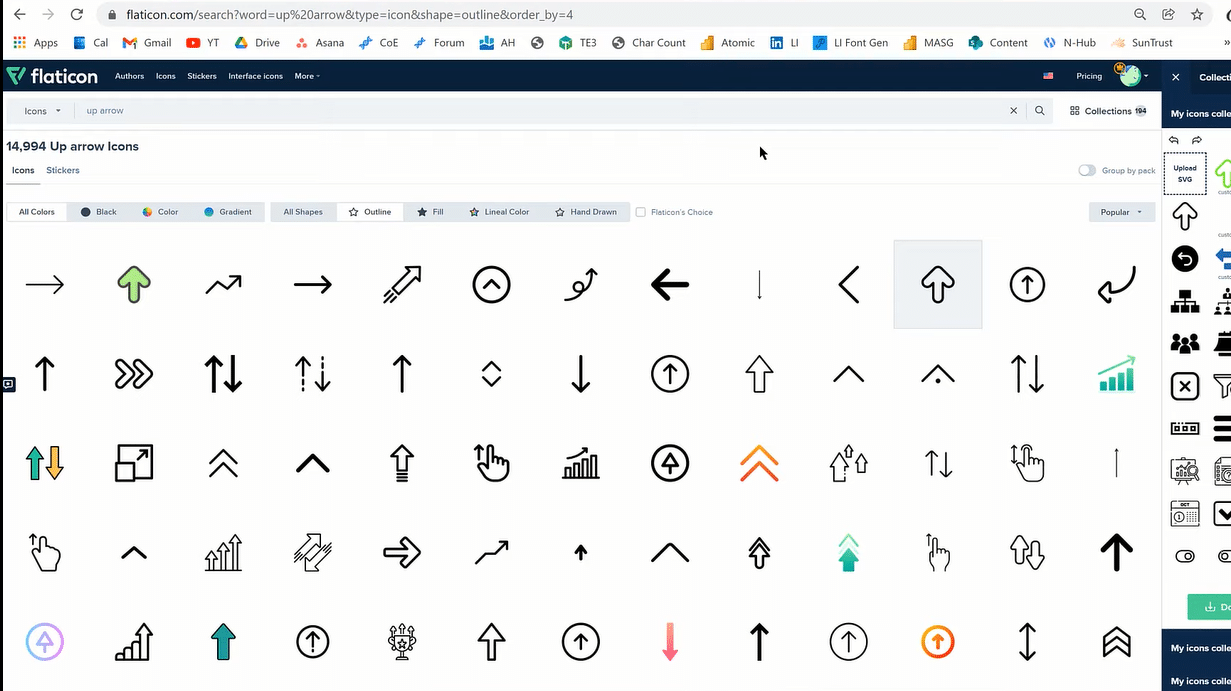
What I did was just found an icon here that I thought would work well with the member’s requirement. And then, I just went through the Flaticon editor and created a green version for up and a red version for down.
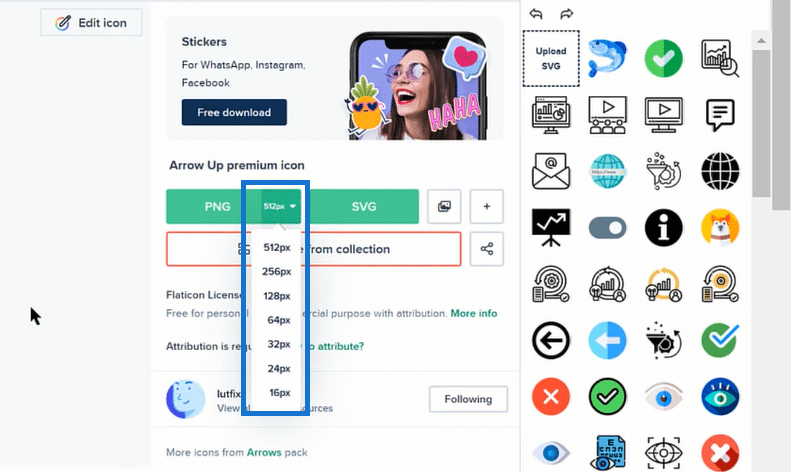
And then, I downloaded a smaller version of the red and green arrows, which is 32px because the 512px is going to generate a very large Base64 version.
Next, we want to convert those into Base64. There are a whole bunch of Base 64 converters, but one that I really like is this Base64 image.de. It has a nice drag and drop interface, and it has image optimization capabilities. And if you enable this, it’ll reduce the size of your resulting file without any noticeable impact on the look of the visual. If we’re working with more complex images, that optimization will really help reduce the size.

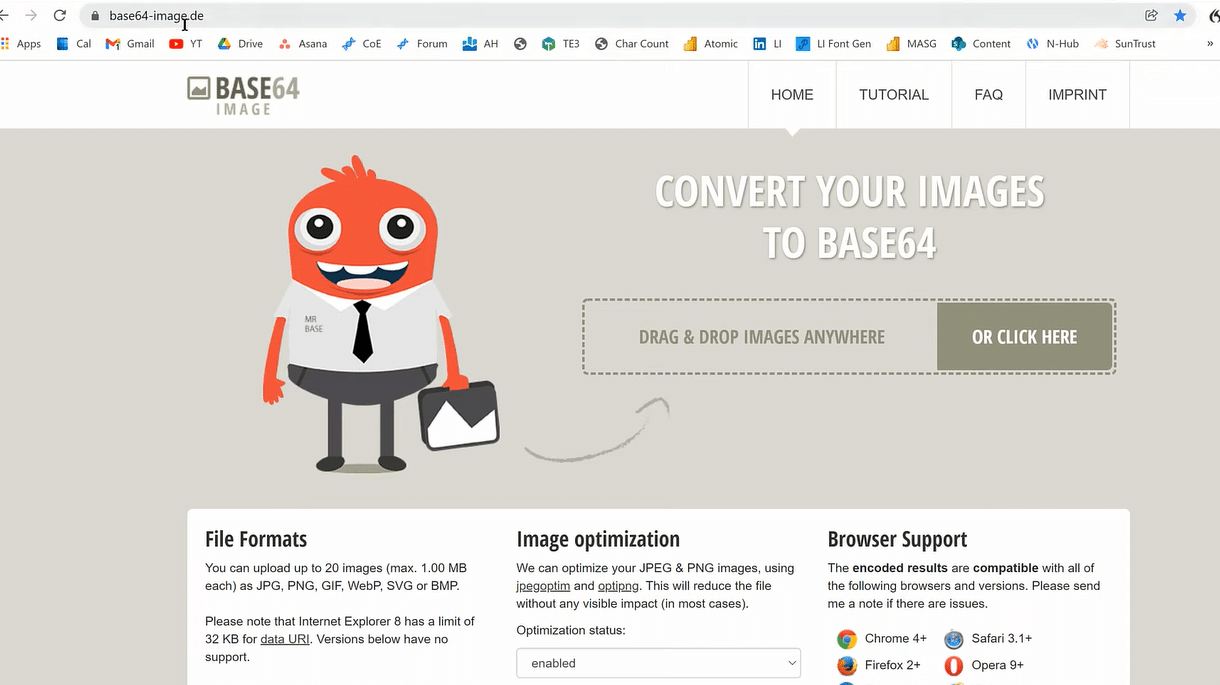
We can then simply drag and drop the files here, which as you can see convert quite quickly.
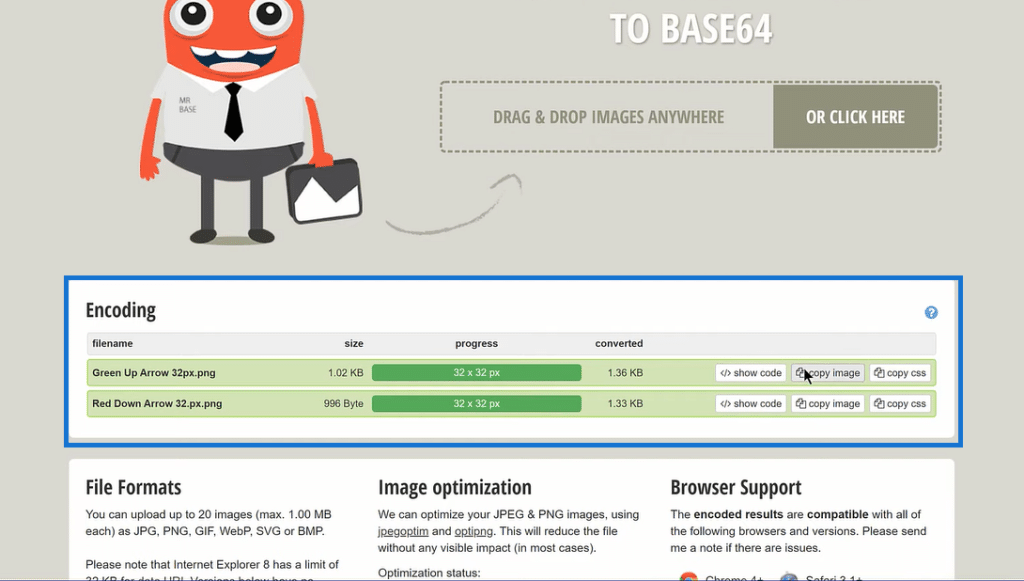
Then, we just copy the image for each one and paste it into the measure inside the quotes. And you can see, even for that small 32-pixel icon, this is a pretty hefty amount of text.
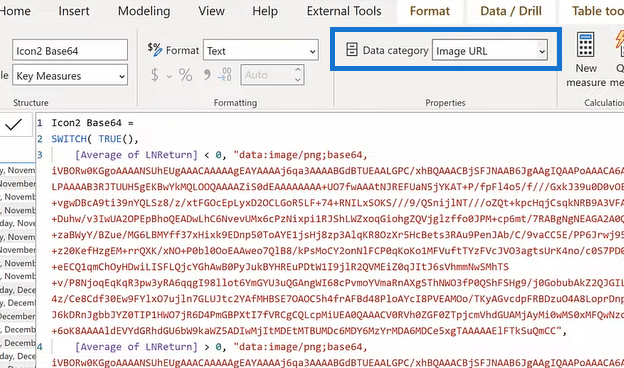
Next, let’s create a new measure where we can copy that in. I’ll call this measure, Icon2 Base64. After that, we need to change the Data Category to Image URL. Now, we’re in good shape for creating the visual that we want
Card visuals do not handle images without the use of custom visuals for reading those images, but tables handle images quite well. And so, we’ll just first create a table visual, and we can format that table visual to look like a card visual.
We take our icon two Base64 files, and then our measure, the Average of the LNR. Next, we can just format these accordingly using the new format pane.
And that’s how you do it with Base64. The other possibility is using web-based images. The reason you might want to do this is if you’re using more complex images. There are some things you can do in terms of splitting the image into pieces and then resembling it in DAX. But the easier way to do it is just through web-based images.
Once you download the files (the green up arrow and the red down arrow), you can go to an image hosting site. The one that I use is called IMGBB. Again, I have no affiliation with this site; it’s just one that I happen to like that works well for me.
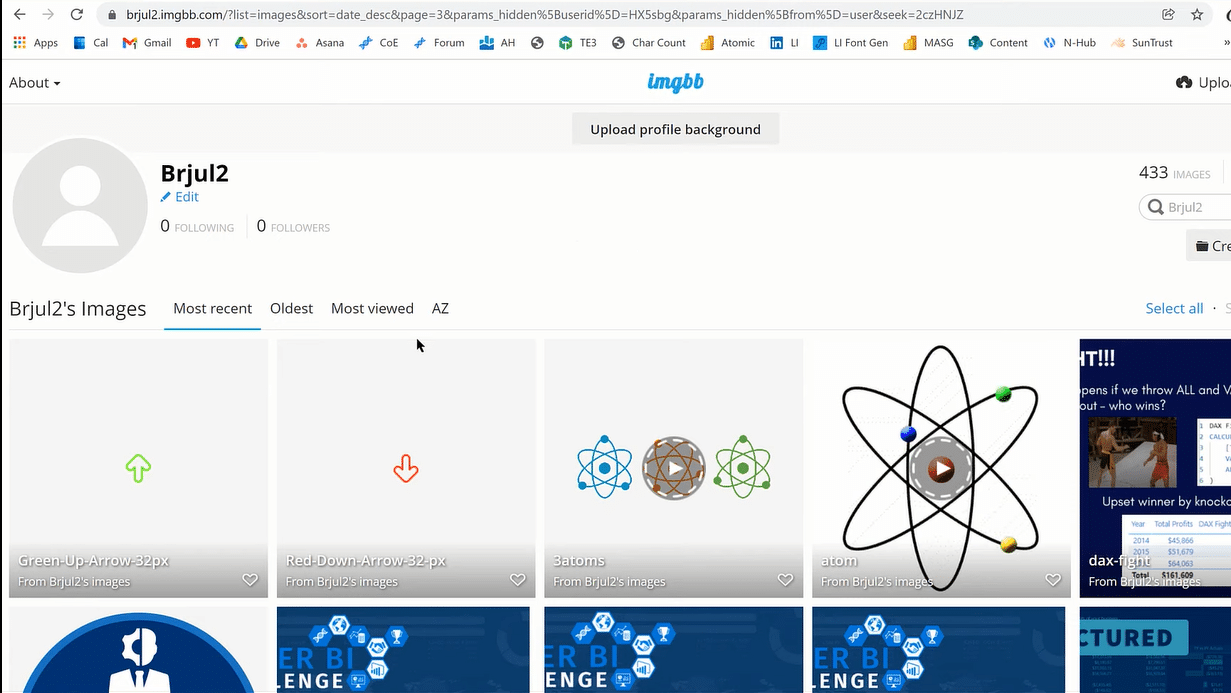
You just upload your images to this site, go to embed codes and make sure you’re looking at direct links.
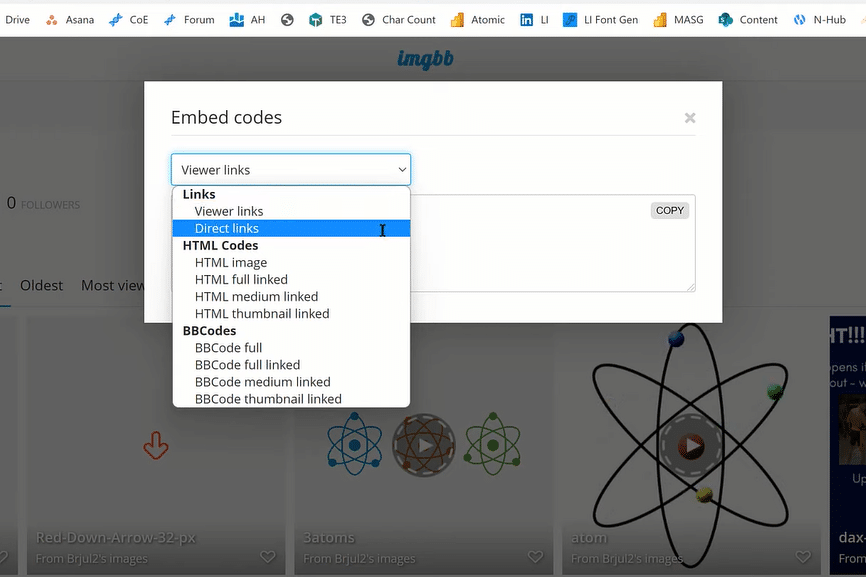
You can then copy those. Then, using the same basic structure that we did in the SWITCH TRUE statement, you can paste those into that basic structure. And that should give us exactly what we need from an image standpoint.

***** Related Links *****
How To Add Custom Power BI Icons Into Your Reports
Power BI Report Development: Creating Themes, Company Logos, Icons and Backgrounds
The Best Custom Visual You’ve Never Heard Of
Conclusion
So that’s the technique that I wanted to show you today. You can use that to create dynamic Power BI custom icons in a lot of different ways. Tables handle this well. You can do this through matrixes as well, and then there are some custom visual tools that will view these just in isolation within a frame.
There’s a lot of flexibility in this technique and I hope that you found that helpful. You can watch the full video tutorial below for more details.
Cheers!
Brian


