
Time is of the essence in the world of data analysis, and without a proper understanding of when or how events occur, it can be difficult to make informed decisions. That’s where the Power BI Calendar Table comes in — a powerful tool for organizing and analyzing time-based data!
To create a Power BI calendar table, determine the time period, create a table with appropriate columns, populate it with the dates, and add any additional columns. You can use a Power BI calendar table for date range filtering, date calculations, and holiday analysis. It’s a valuable tool for organizing and analyzing time-related data.
In this article, we’ll explore the various methods for creating a calendar table in Power BI, including using DAX functions or Power Query. We’ll also look at the best practices for formatting and organizing your calendar table.

Let’s start by defining a calendar table.
What is a Calendar Table in Power BI?
In Power BI, a calendar table is a specialized table that contains information about dates, such as year, month, day, and week, along with other relevant attributes like fiscal periods, holidays, and working days.
The purpose of a calendar table is to provide a framework for analyzing and visualizing data that is time-sensitive, such as sales, revenue, or customer behavior.
The calendar table is usually created as a calculated table in Power BI, using the DAX function CALENDAR or CALENDARAUTO. This function generates a table with a contiguous series of dates between a start and end date, based on the data available in the data source.
The resulting table can be customized further to include additional date columns or change the date range.
In the next section, we’ll look at the steps for creating calendar tables in Power BI.

How Do I Create a Calendar Table in Power BI?
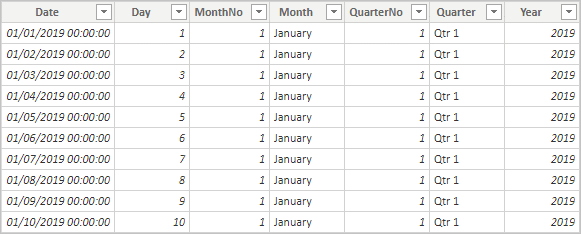
If you’re working with Power BI, you know how important a calendar table is for good BI reporting. A calendar table includes one day row by row, with needed columns like year, quarter, month, month name, day of the week, day, etc.
In this section, we’ll cover two ways to create a calendar table in Power BI: using Power Query and using DAX.
1. Using Power Query
Power Query is a data transformation tool that allows you to import, transform, and clean data before it is loaded into Power BI. To create a calendar table using Power Query:
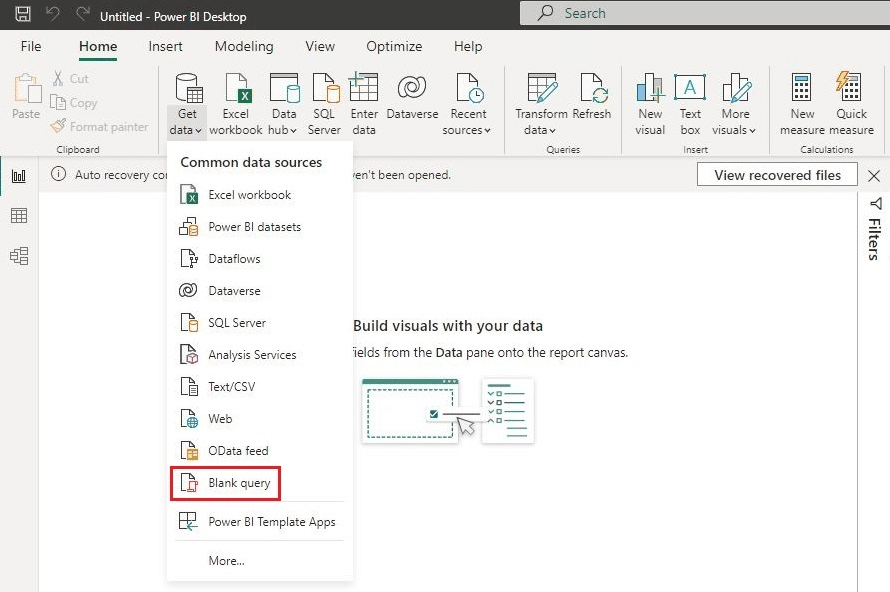
1. Click on the “Get Data” button on the Home tab of the ribbon.
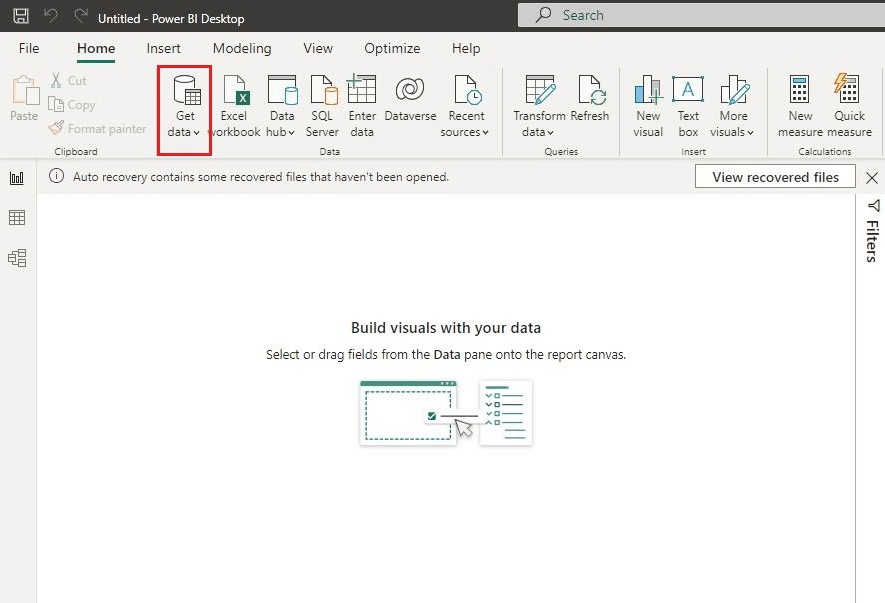
2. Select “Blank Query” from the dropdown menu.
3. In the “Query Editor” window, select “View” from the top menu, and then click on “Advanced Editor”.
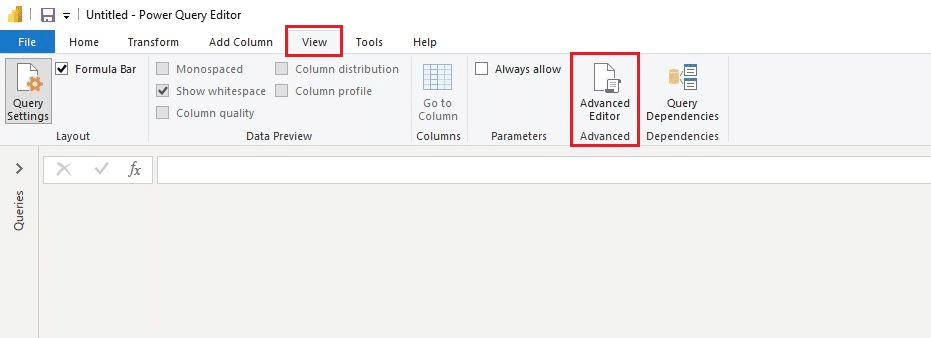
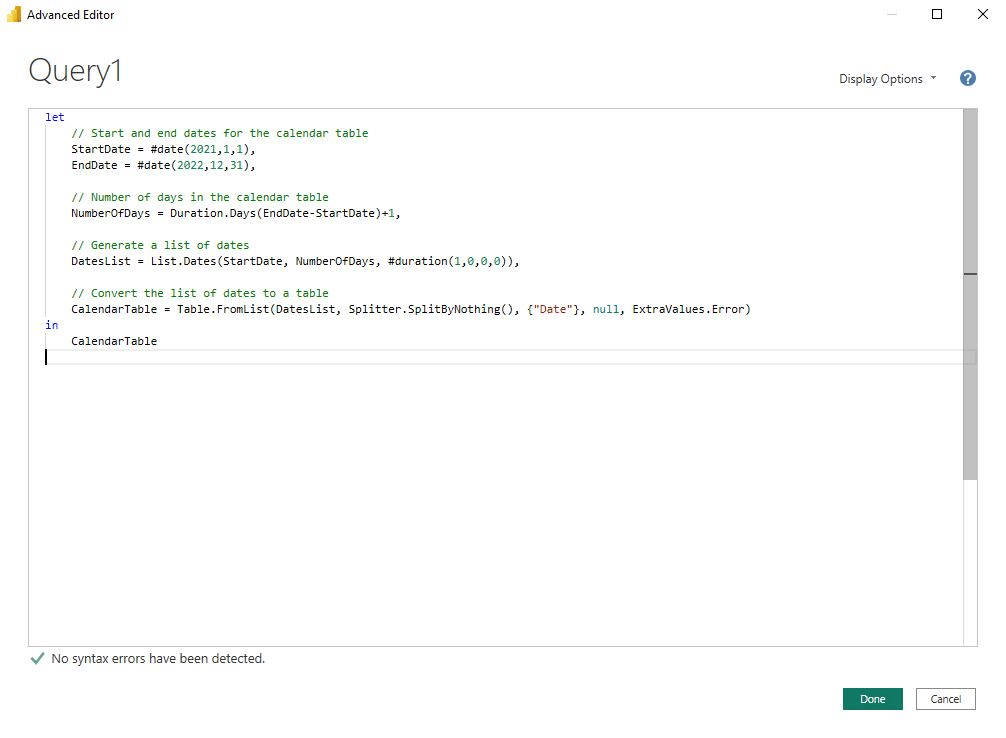
4. In the “Advanced Editor” window, paste the following code. Choose the start date and end date for your calendar table.
let
// Start and end dates for the calendar table
StartDate = #date(2021,1,1),
EndDate = #date(2022,12,31),
// Number of days in the calendar table
NumberOfDays = Duration.Days(EndDate-StartDate)+1,
// Generate a list of dates
DatesList = List.Dates(StartDate, NumberOfDays, #duration(1,0,0,0)),
// Convert the list of dates to a table
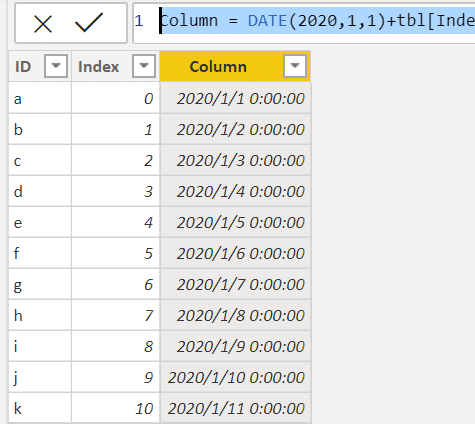
CalendarTable = Table.FromList(DatesList, Splitter.SplitByNothing(), {"Date"}, null, ExtraValues.Error)
in
CalendarTable
5. Click on “Done” to close the “Advanced Editor” window.
6. Rename the query to “Calendar”.
7. Click on “Close & Apply” to save and apply the changes.
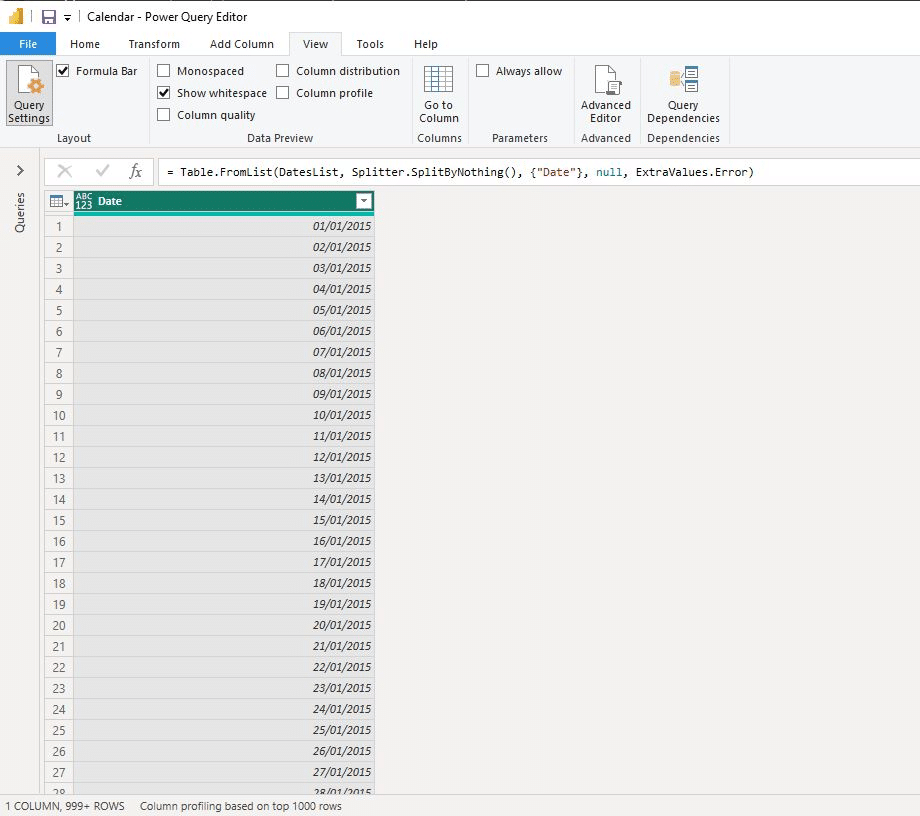
The calendar table will now be available in the “Fields” pane and can be used in your Power BI report.
Let’s now look at the powerful Data Analysis Expressions (DAX) language and how it can create a calendar table in Power BI.
2. Using DAX
DAX is a formula language used in Power BI to do data analysis expressions and create custom calculations or aggregations. To create a calendar table using DAX:
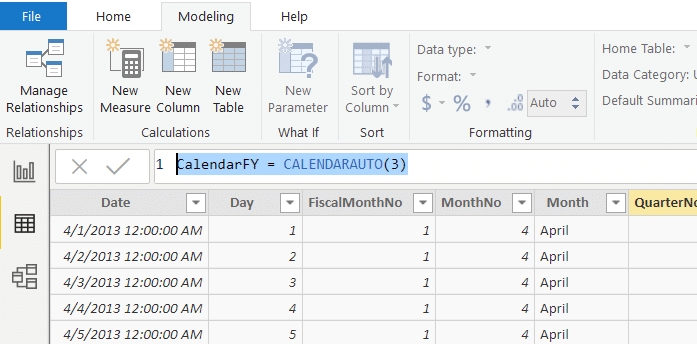
1. Open a new Power BI Desktop file and go to the “Modeling” tab.
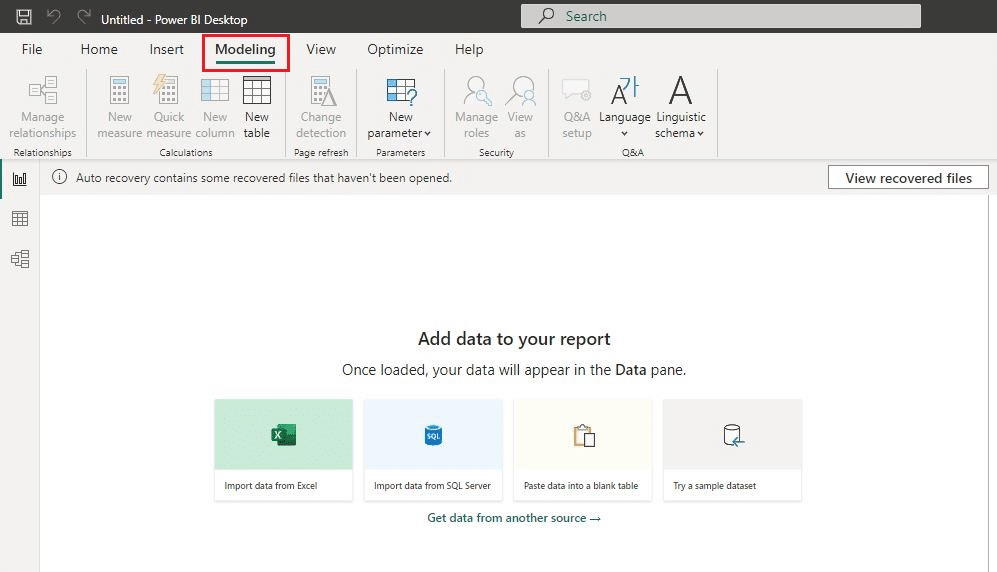
2. Click on “New Table”

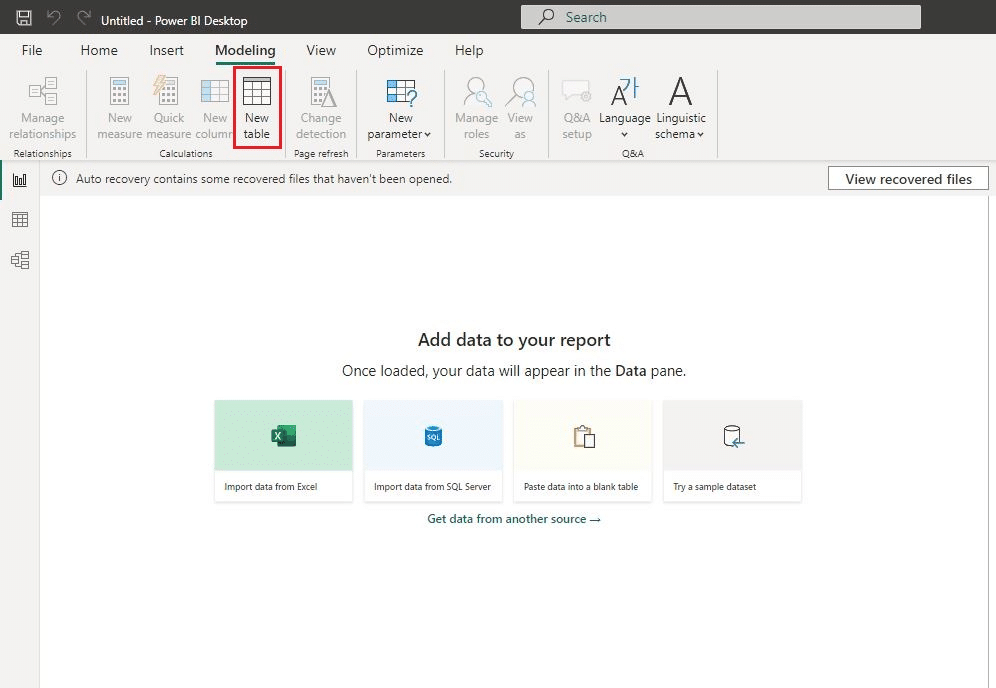
3. Enter the following DAX formula:
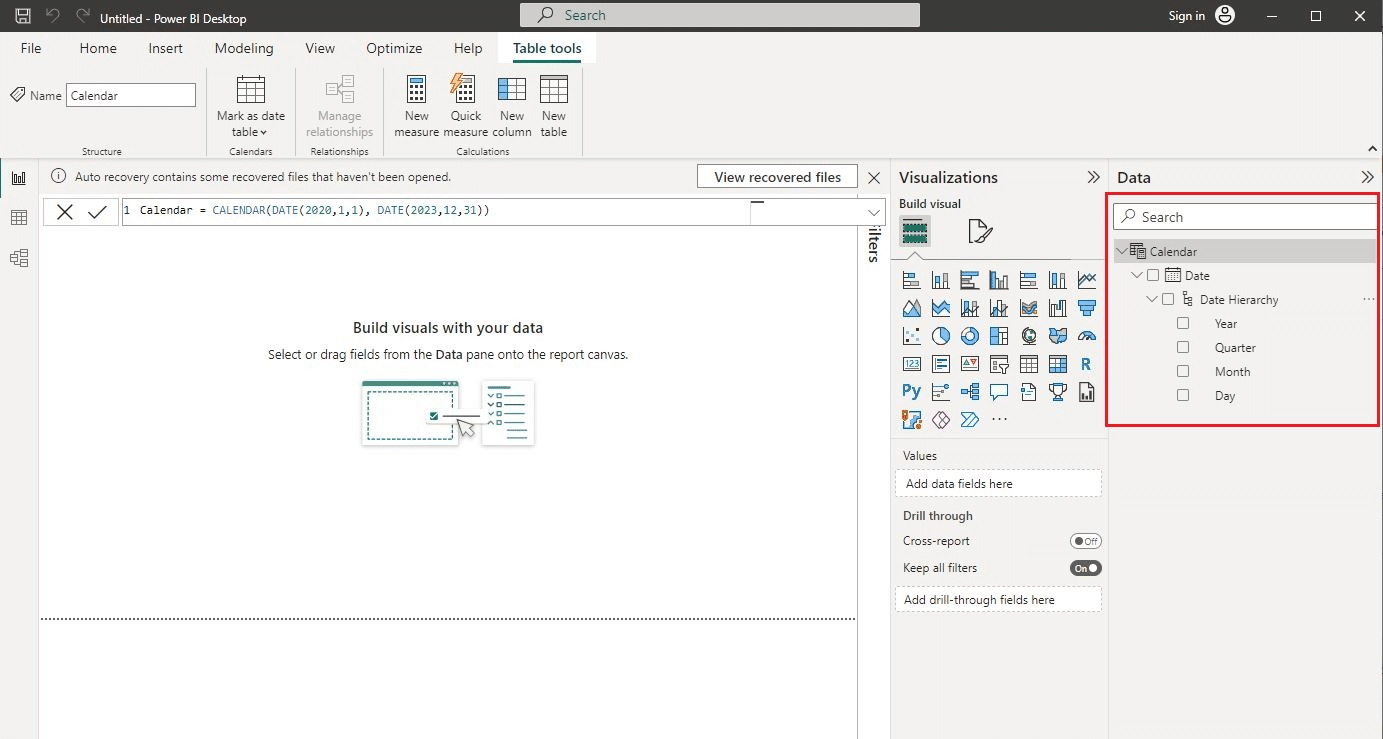
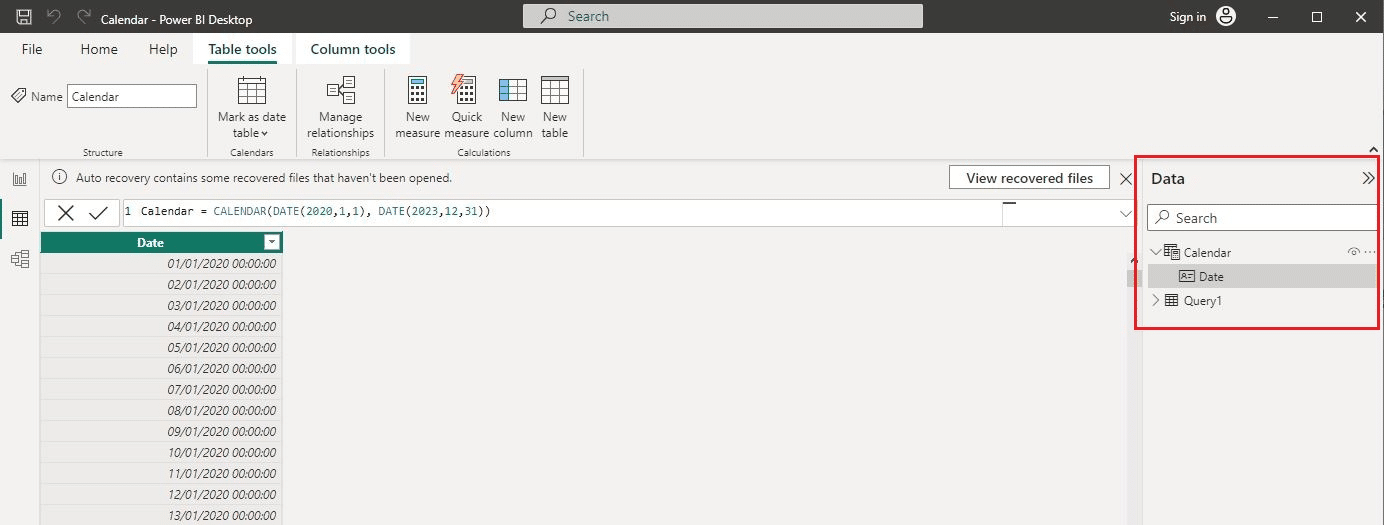
Calendar = CALENDAR(DATE(2020,1,1), DATE(2023,12,31))4. Click “Enter” to create the table.
5. Expand the “Calendar” table to add columns for year, quarter, month, month name, day of the week, day, etc., as needed.
Whether you use Power Query or DAX to create new columns in your calendar table, make sure that the date column contains unique values. This will ensure that your date table works properly with time intelligence functions in Power BI.
For more detailed guidance on how to create the ultimate date table in Power BI, watch this YouTube video tutorial:
In the next article section, we’ll explore the numerous benefits of using a calendar table.
What are the Benefits of Using Power BI Calendar Table?
If you are working with Power BI, you may have heard about the importance of using a calendar table in your data model. It can help you achieve your goals, manage your time better, and improve your quality of life.
1. Time Intelligence
One of the primary benefits of using a calendar table is the ability to perform time intelligence calculations in DAX.
Time intelligence functions enable you to compare data across different time periods, such as month-to-date, the earliest date, year-to-date, and quarter-to-date. These functions require a separate calendar table to work correctly.
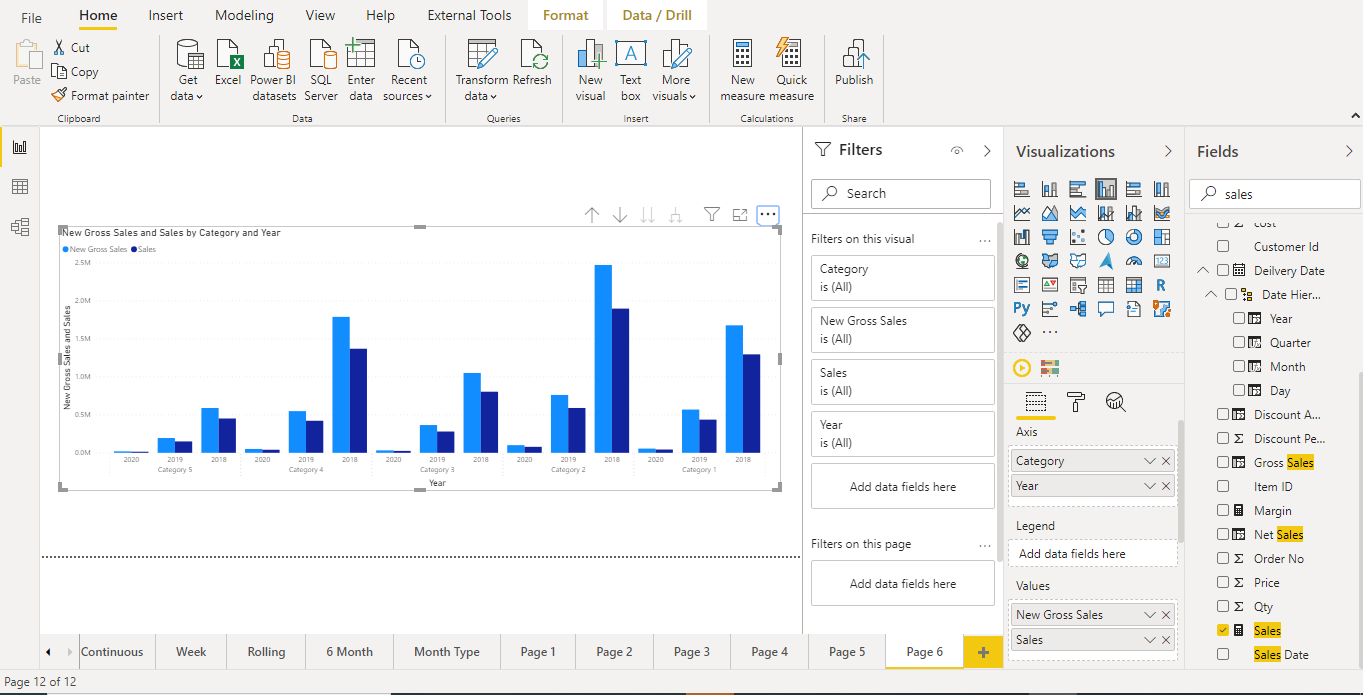
By using a calendar table, you can group various date tables at the year, quarter, or month level, making it easier to browse your data.
You can also create your own date hierarchy to work with, which saves space and eliminates the need to drill down to month from year every time you use the Date Hierarchy in the visual.
2. Date Interval Filtering
Another benefit of using a calendar table is the ability to filter data by date intervals. You can create calculated columns in your calendar table that allows you to filter data by week, month, quarter, or year.
This makes it easier to compare data across different time periods and identify trends and patterns. For example, you can create a calculated column that returns the week number of a date.
You can then use this column to filter data by week, allowing you to compare sales data for different weeks of the year.
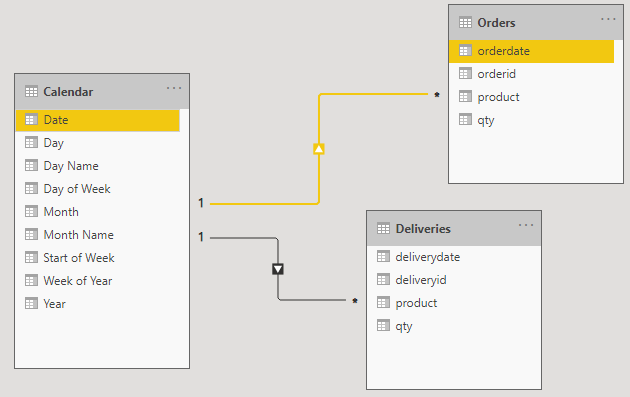
3. Relationships
Finally, using a calendar table enables you to create relationships between data tables in Power BI. This allows you to create summary reports and dashboards from multiple data sources and compare numbers between those data sources.
For example, you can create a relationship between your sales table and your calendar table, allowing you to compare sales data by month, quarter, or year. This makes it easier to identify trends and patterns in your data and make informed business decisions.
Overall, using a calendar table in Power BI can improve your data analysis process and enable you to perform time intelligence calculations, filter data by date intervals, and create relationships between data tables.
By taking advantage of these benefits, you can gain valuable insights into your data and make informed business decisions.
3 Advanced Techniques for Calendar Tables
If you want to take your calendar table to the next level, there are several advanced techniques that you can use in Power BI. In this section, we will cover three of the most useful ones: Auto Date/Time, Calendar Function, and Custom Date Table.
1. Auto Date/Time
The Auto Date/Time feature in Power BI is a quick and easy way to create a basic calendar table. When enabled, Power BI automatically creates a calendar table for each Date or DateTime column in the model. This is a great option if you need to create a calendar table without spending too much time on it.

However, there are some drawbacks to using the Auto Date/Time feature. For one, Power BI generates one table per date column, which may cause inefficient data models.
Additionally, the tables are hidden and with no modification capabilities. If you need more control over your calendar table, you might consider one of the other techniques.
2. Calendar Function
The Calendar function is a DAX function that allows you to create a custom calendar table. With this function, you can specify the start and end dates of your calendar, as well as the intervals (e.g. days, weeks, months) and the columns you want to include in your table.
One advantage of using the Calendar function is that it allows you to create a non-standard calendar. For example, you could create a fiscal year calendar that starts in July instead of January.
Additionally, you can customize the columns in your table to include additional information such as holidays or special events.
3. Custom Date Table
If you need even more control over your calendar table, you can create a custom date table using Power Query or DAX.
With Power Query, you can connect to a date dimension table or generate a date table from scratch.
With DAX, you can use the CALENDAR or CALENDARAUTO function to create a custom date table.
Creating a custom date table allows you to include additional columns that may apply to your analysis. For example, you could include a column for the number of business days between two dates, or a column for the week number of the year.
Overall, there are several advanced techniques that you can use to create a powerful and flexible calendar table in Power BI.
Whether you choose to use the Auto Date/Time feature, the Calendar function, or a custom date table, make sure to choose the option that best fits your needs and provides the most value to your analysis.
Best Practices for Working with Calendar Tables
If you want to make the most out of your Power BI calendar table, there are a few best practices that you should follow.
These practices will help ensure that your calendar table is properly formatted and optimized for your needs.
1. Mark as Date Table
One of the first things you should do when creating a calendar table in Power BI is to mark it as a date table. This will allow you to take advantage of the built-in time intelligence features in Power BI, such as the ability to create time-based calculations and comparisons.
To mark a table as a date table:
1. Open your Power BI Desktop report and go to the Fields pane on the right-hand side of the screen.
2. Find the table that you want to mark as a Date Table and click on it to select it.
3. Right-click on the table and select “Mark as Date Table” from the context menu.
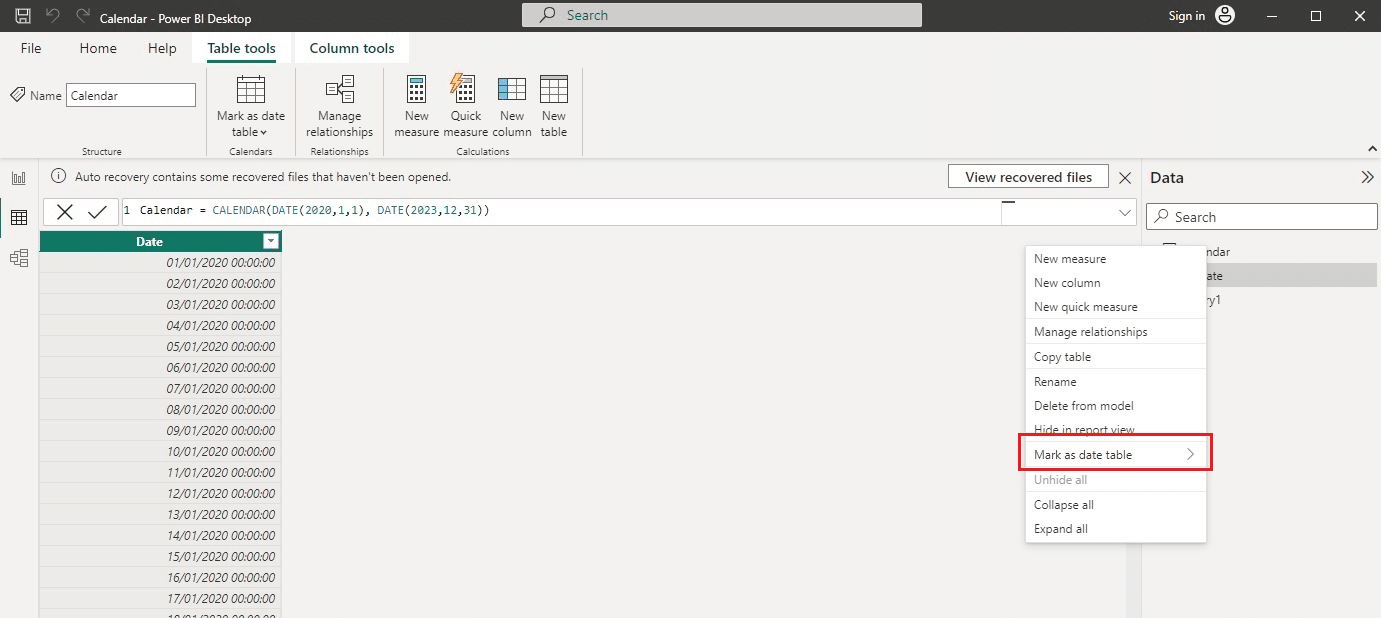
4. In the “Mark as Date Table” dialog box, select the column that contains the dates you want to use as a basis for time intelligence calculations. This column should contain only dates or date/time values.
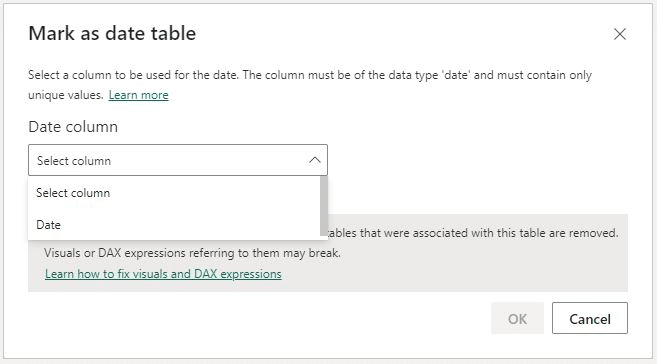
5. If the table already contains relationships with other tables that use dates, you can choose to propagate the date table to those tables by checking the “Propagate to related tables” checkbox.
6. Click “OK” to confirm the changes and mark the table as a Date Table
Once you have marked a table as a Date Table, you can use the time intelligence functions and visualizations available in Power BI, such as the date slicer and the various time-based calculations in DAX.
2. Grouping Requirements
When creating your calendar table, consider your grouping requirements. For example, group your dates by year, quarter, month, or week. To do this, you can create calculated columns in your calendar table that group your dates according to your needs.
It’s also important to consider your financial year when creating your calendar table. Depending on your organization, your financial year may not align with the calendar year. In this case, you’ll need to create a custom column in your calendar table that reflects your financial year.
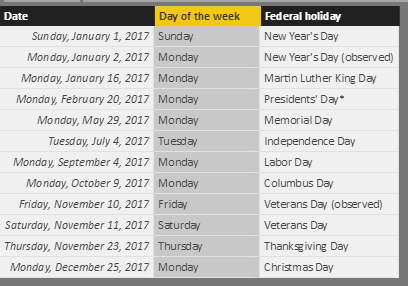
3. Public Holidays
If you need to take public holidays into account in your reporting, include them in your calendar table. You can create a separate table that lists all the public holidays for your region and then join this table to your calendar table using a relationship.
Alternatively, you can create a calculated column in your calendar table that flags dates that are public holidays. This can be useful if you need to filter or group your data based on public holidays.
By following these best practices, you can create a calendar table in Power BI that is optimized for your needs and provides valuable insights into your data.
Final Thoughts
Creating a calendar table is an essential part of data modeling in Power BI. It helps in better data analysis and visualization. With the help of various time intelligence functions and DAX expressions, you can create a custom calendar table that meets your needs.
If you are new to Power BI, we recommend starting with a simple calendar table. Power BI generates a default date table, which you can use for most of your data analysis needs. However, if you need a custom calendar table, you can create one using DAX functions.
Remember, a calendar table is a crucial component of data models in Power BI that enables better data analysis and visualization, and with the help of various time intelligence functions and DAX expressions, you can create a custom calendar table that meets your needs. Happy analyzing!


