Now we are going to dive into the CALCULATE function in Power BI.
We have already used the function many times but this is where I want to discuss it in detail.
Getting The Sales Last Year With CALCULATE
The CALCULATE function allows you to change the context of a calculation within a measure wherein the context is coming from the environment where your calculation is being done. You may watch the full video of this tutorial at the bottom of this blog.
The ability to change the context within a measure is very important in DAX.
We will start with an example by creating a measure called Sales LY which uses the CALCULATE function to compare the sales on the current date to the sales on the same date last year.
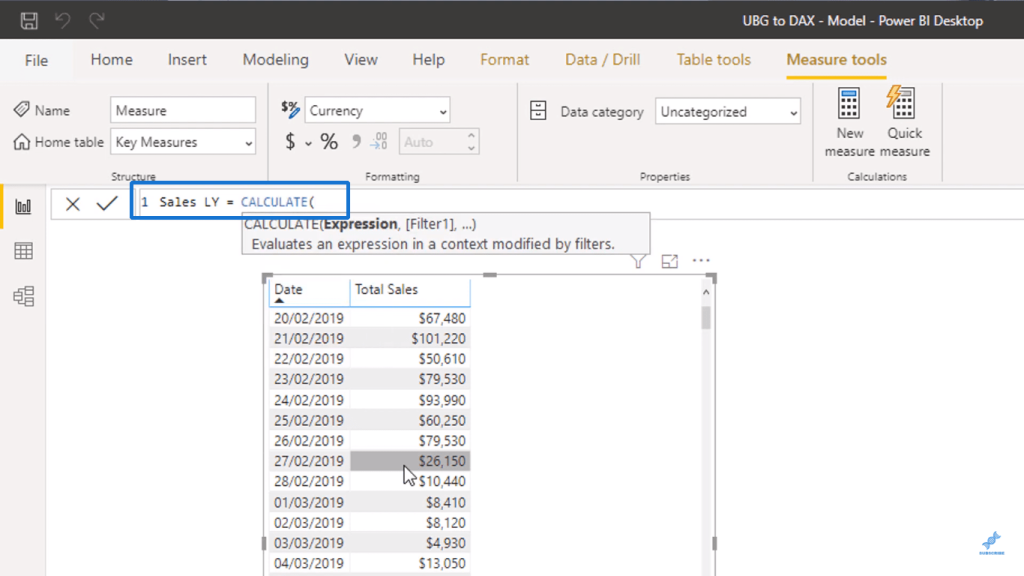
Within the CALCULATE function, we will put in our Total Sales since the first parameter of CALCULATE can take any kind of expression.
Then, I will use a time intelligence function called SAMEPERIODLASTYEAR. Time intelligence functions are functions used for time-related calculations.
Since we are putting SAMEPERIODLASTYEAR inside CALCULATE, we will be adjusting our current context by one year through our Date column.
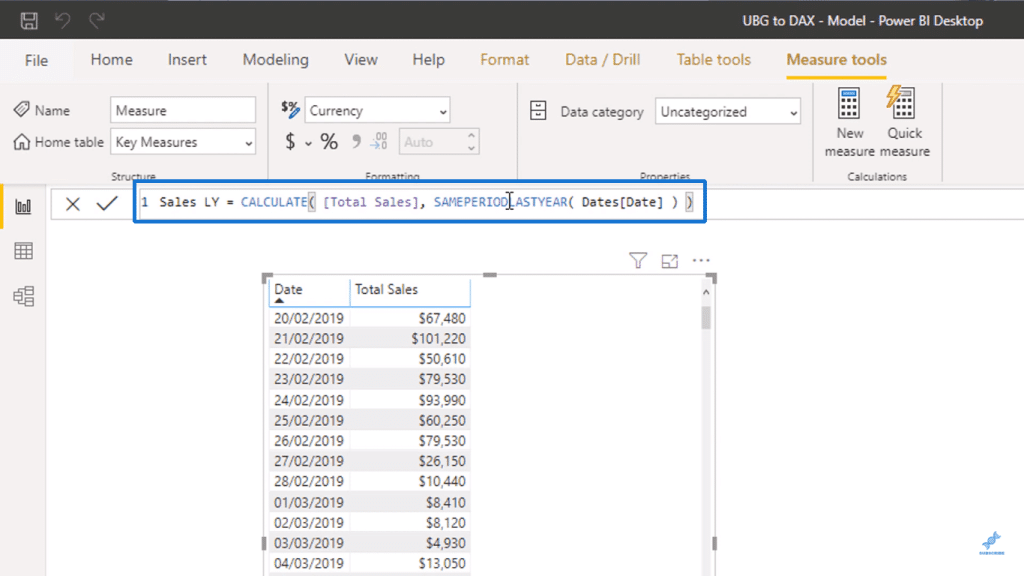
Upon dragging in the new measure, you will see that the Total Sales and Sales LY columns have different results.
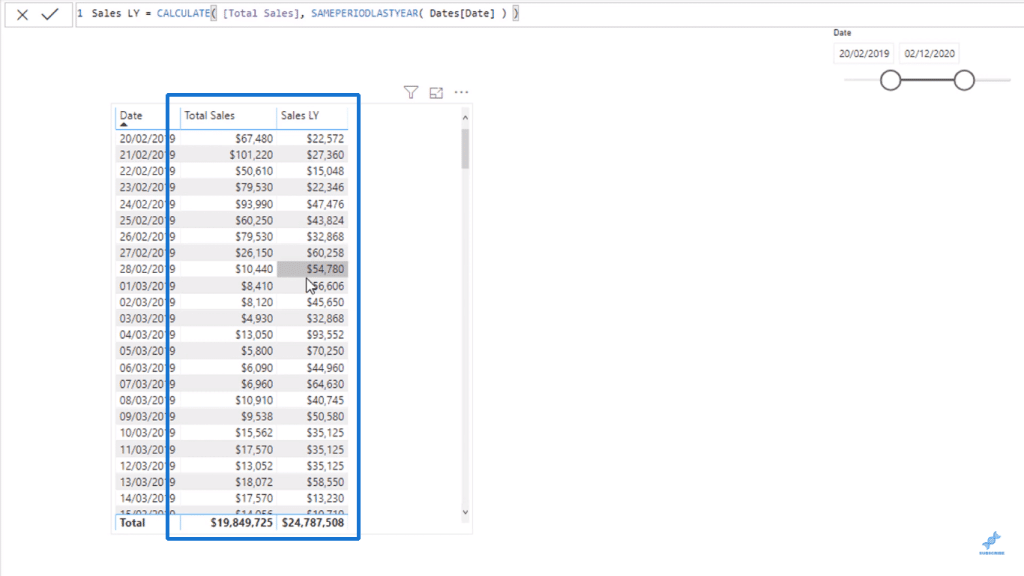
The reason behind this is that the values inside Sales LY are taken from the Total Sales exactly one year before.
To show an example, let us have a look at the Sales LY value of the date 28/02/2020.
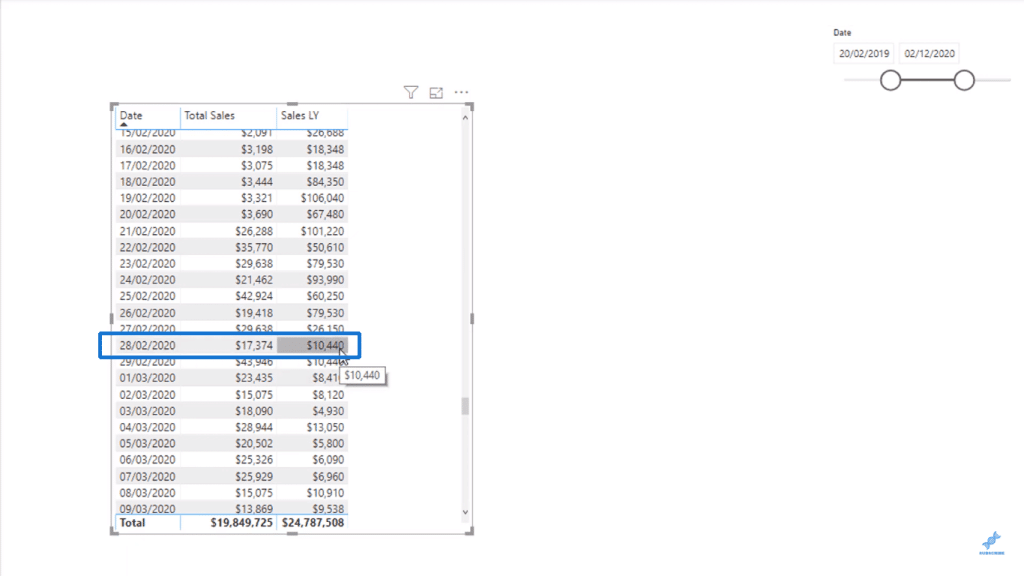
Since it has a value of $10,440, looking back at the Total Sales of the date 28/02/2019 should yield the exact same result.
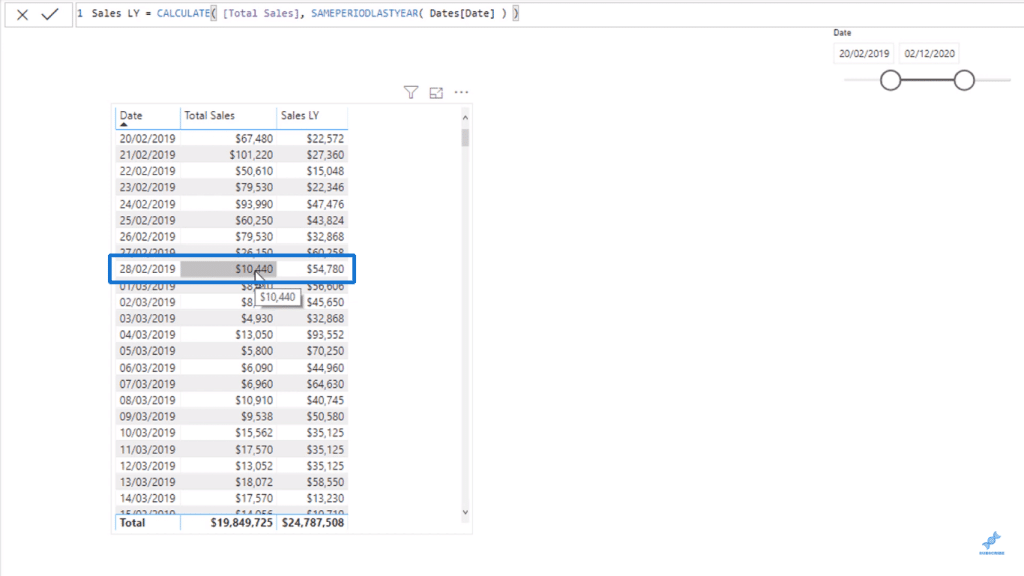
It is recognizing 28/02/2020 as the present date, but it changes the context to the same date in 2019 through the Sales LY column.
This is why CALCULATE is such an important function in Power BI. It allows you to perform calculations in many different ways, like when you need to find the difference between the Total Sales and Sales LY.
Changing The Context By Quarter
I can also change the context of the Date column so that I could look at quarterly values instead of daily values.
I will first drag in the QuarterInCalendar column which can be found inside the Dates table.
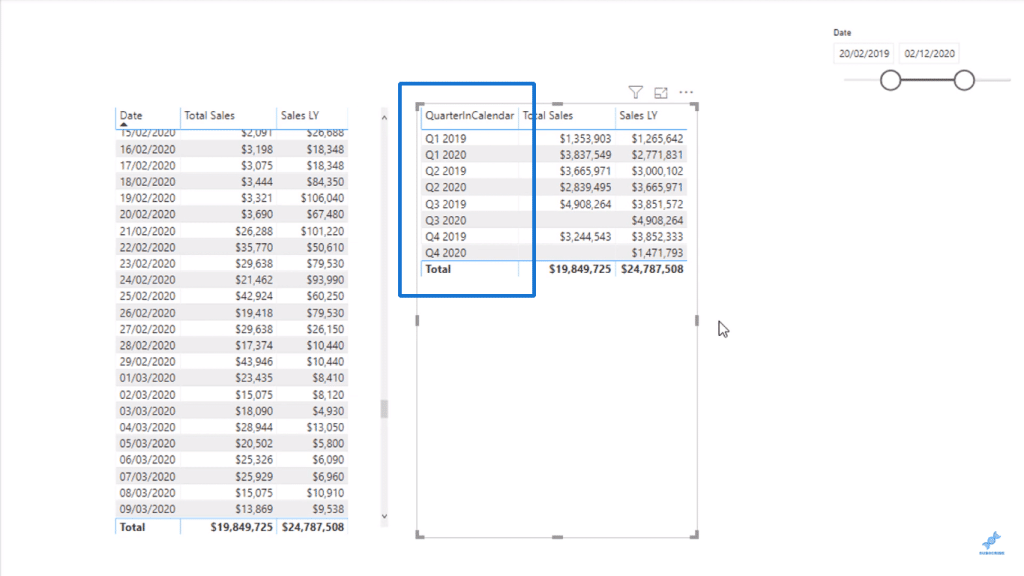
The first thing that you will notice here is that the dates are not sorted correctly. To fix this, I will sort the column called QuarterInYear.
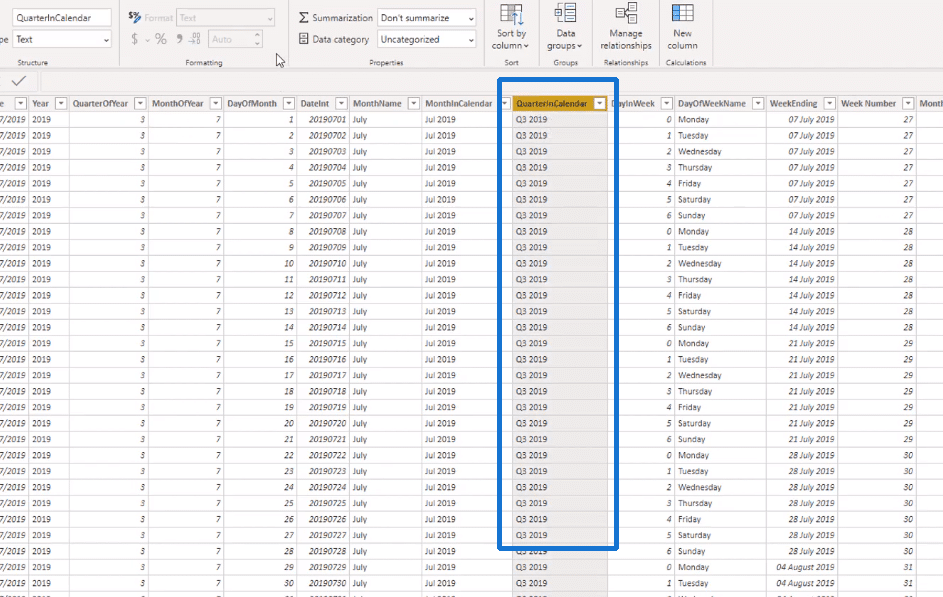
I will go to the Data area and highlight the QuarterInCalendar column.
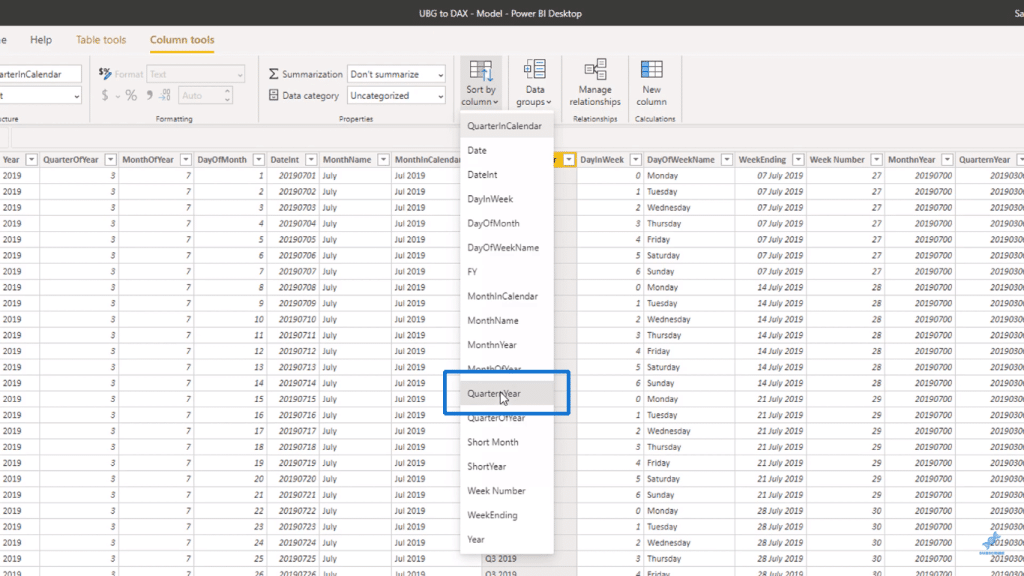
Then, I can select the QuarterInYear option under Sort by column.
Once we go back to the previous screen, you can now see that we already have the quarters in the right order.
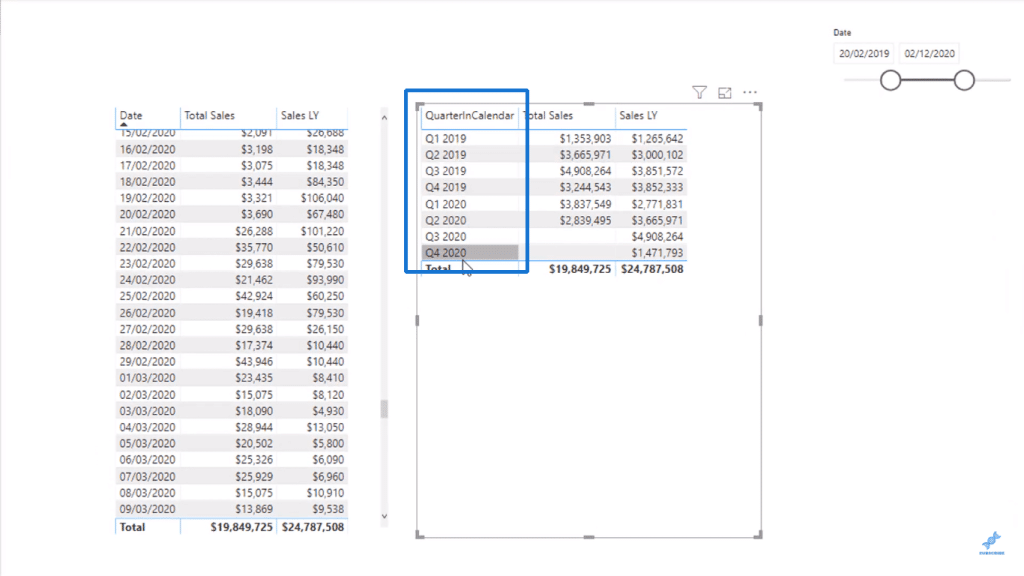
We are doing the exact same thing earlier, but the values are accumulated in a different granularity since we are looking at quarters instead of days.
For instance with Q2 2020, we have a Total Sales value of $2,839,495. But when we look at the Sales LY value, the CALCULATE function changes the context back one year, which has the Q2 2019 Total Sales value of $3,665,971.
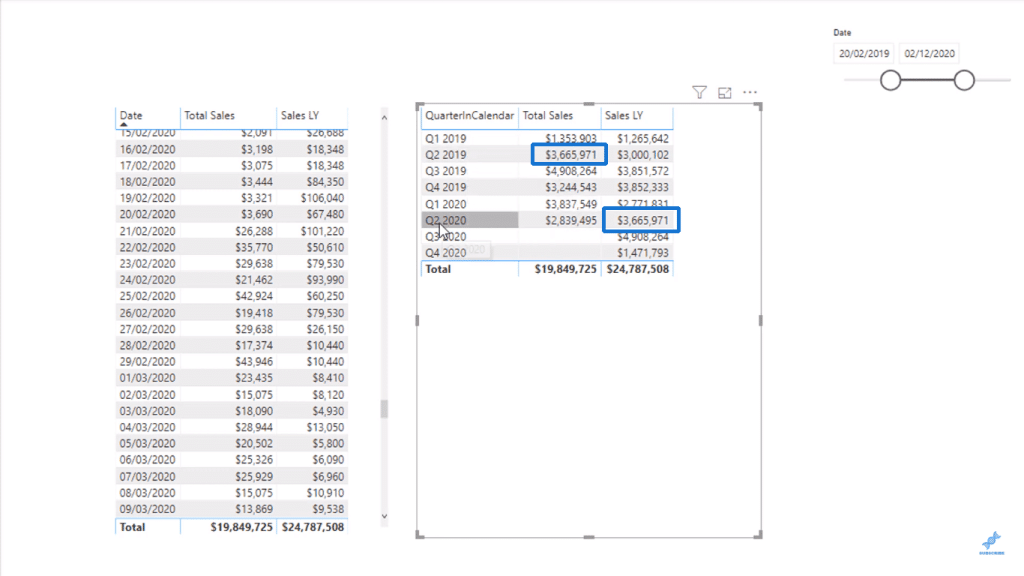
The CALCULATE function enables you to work in different ways using a similar insight without having to rewrite formulas or calculations.
Total Sales Of Certain Location Using CALCULATE
I also want to show you another way how you can adjust the context inside CALCULATE.
We previously changed the contexts of the calculations completely, but now I want to show you an example where we would instead filter the context slightly.
What if I wanted to calculate all of my sales in a certain location, specifically North Carolina?
To do this, I can create a new measure called Sales in NC, use CALCULATE with Total Sales as the expression, and then use the State Code in the Locations table as the filter and set it equal to “NC”.
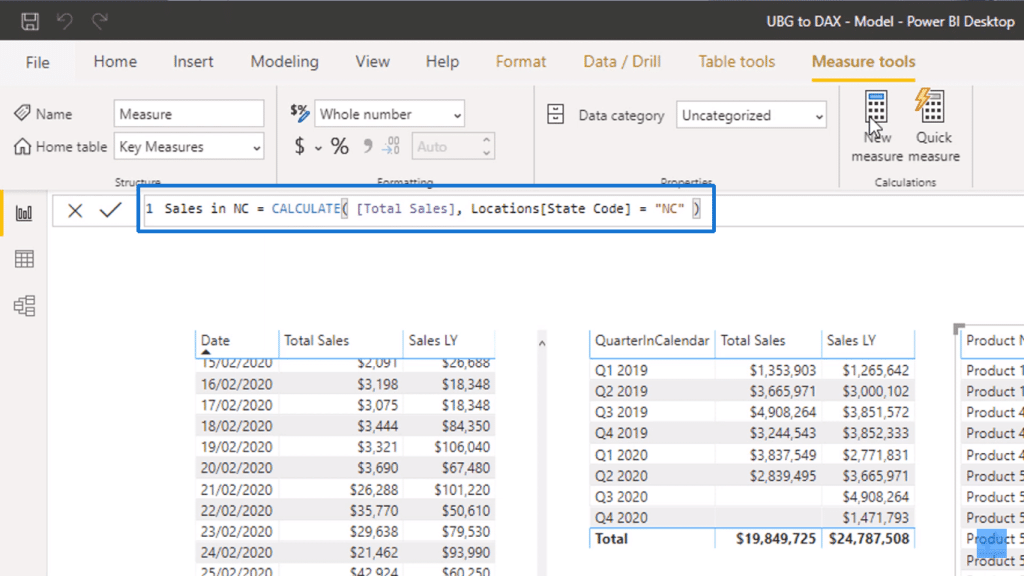
Once we drag in our new measure, we can see a breakdown of the Total Sales in just a particular region based on the context of Product Name.
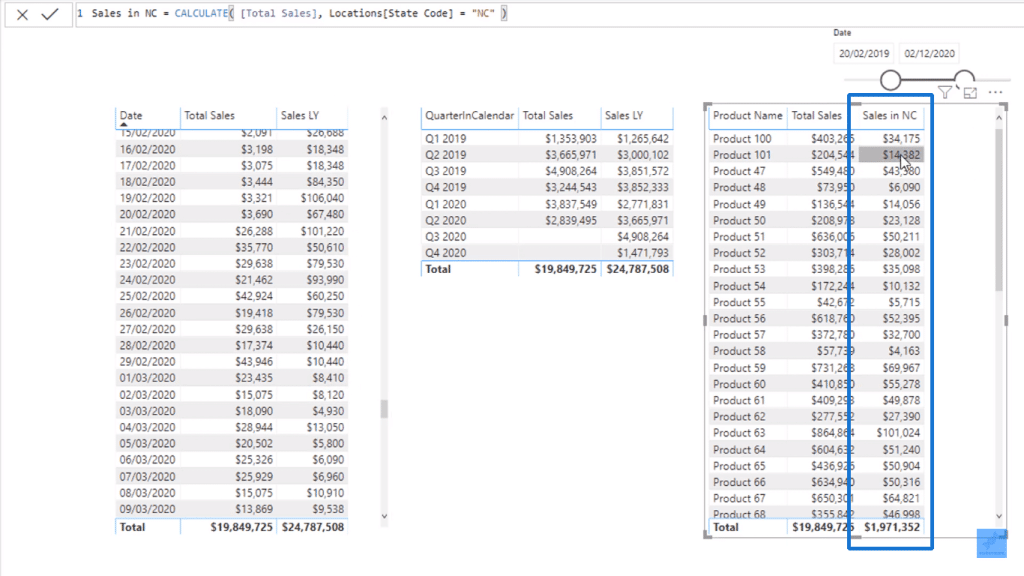
Compared to Sales LY where the context was changed completely, the context in Sales in NC was simply adjusted.
This is why CALCULATE will become your most used function since there are many ways that you can adjust the context.
If you look at any of the advanced content from Enterprise DNA, you will see that CALCULATE is used in almost everything since formulas can be written very efficiently using it.
You might have already seen very long formulas written in Microsoft Excel which span two to three lines. In Power BI, you can have a whole range of different calculations by simply adjusting the context.
To show another example, I can drag in the Sales in NC measure along with the QuarterInCalendar measure.
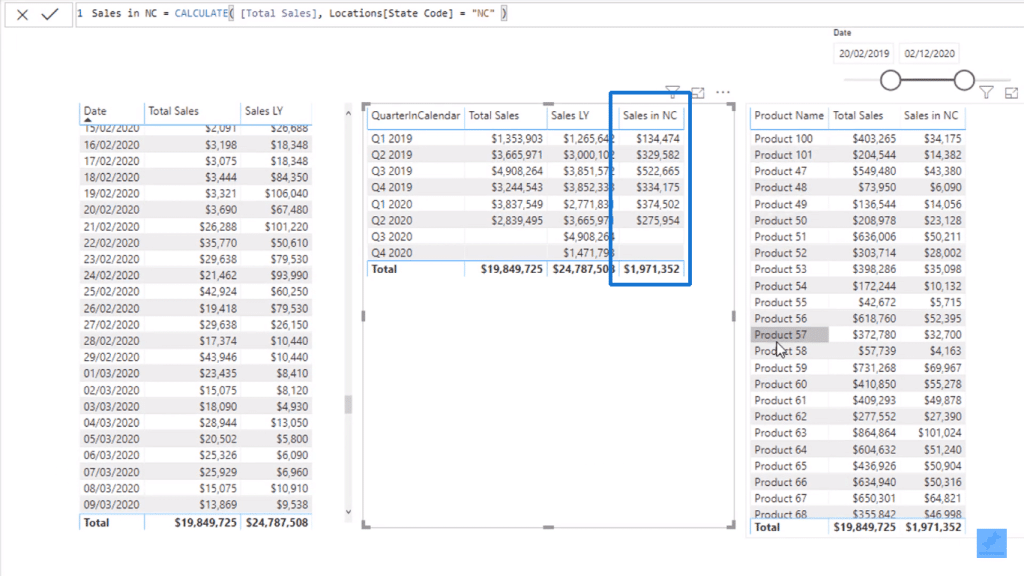
I did not have to make changes in the formula, but I added to the context compared to our previous example where we adjusted it.
Since we already have our quarterly sales, adding in Sales in NC gave us quarterly sales particular to North Carolina.
There is that slight difference compared to completely changing the context like in Sales LY where we used a time intelligence function to manipulate the date.
The Sales in NC measure is just a filter on location which is not related to the initial context of QuarterInCalendar which is date.
***** Related Links *****
Calculating Dynamic Percentage Of Total Change Using Power BI Time Intelligence
Calculating A Cumulative Run Rate Using DAX In Power BI
How To Calculate Difference In Days Between Purchases Using DAX In Power BI
Conclusion
That was just an introduction to the CALCULATE function in Power BI on how you could use it to change, adjust, or add to the context of your calculations.
I want you to think about how you can apply this on something that you are working on. If you can utilize this function, you can quickly do formula combinations and techniques to calculate more things.
All the best,
Sam
[youtube https://www.youtube.com/watch?v=q8VF2CeMZ5o&w=784&h=441]


