
Got a ton of data and not sure how to make sense of it all? Ever wondered how to streamline your data processing pipeline, like the pros do? Then step right in, because you’re in the right place! We’re about to dive head-first into the powerful world of Pandas GroupBy, one of Python’s killer features for data analysis.
Groupby() is a function in the Pandas library that splits data into groups based on some criteria. It involves some combination of splitting the object, applying a function, and combining the results. This can be used to group large amounts of data and compute operations on these groups. To use it, you call the groupby() function on your DataFrame, passing in the column names you want to group by.

In this article, we’ll have a detailed discussion on what the pandas groupby operation is and how you can use it in your projects. There will be examples to help you better understand the applications of the groupby() function.

Let’s dive in!
Understanding the Basics of Pandas Groupby
Before we get our hands dirty with writing code, let’s quickly review the basics of the Pandas library and the groupby() function.

Pandas is a popular Python library that provides data manipulation and analysis tools. One of its core features is the groupby method, which allows you to perform efficient grouping and aggregation operations on data stored in a DataFrame object.
A DataFrame is a two-dimensional labeled data structure with columns of potentially different types, popularly used in data manipulation tasks.
The groupby operation involves the “split-apply-combine” approach, which consists of three steps:
- Split: Data is divided into groups based on specified criteria.
- Apply: A function is applied to each group independently.
- Combine: The results from the applied function are combined into a new DataFrame.
What is the Syntax of Pandas Groupby?
The syntax for the groupby() method is as follows:

dataframe.groupby(by, axis=0, level=None, as_index=True, sort=True, group_keys=True, observed=False)In the Pandas groupby() function, by can be a mapping, function, label, or list of labels to determine how the data is grouped.
- axis determines if we group by index (0) or columns (1).
- level is used when dealing with MultiIndex DataFrames, to specify which level(s) we want to group by.
- The as_index parameter, when set to True (default), will use the group labels as index of the resulting DataFrame, otherwise it will include them as columns.
- sort controls whether the group keys should be sorted to produce a lexicographically sorted result.
- group_keys, when set to True, it will add group keys to index to identify pieces.
- The observed parameter, when set to True, will only use observed combinations as group keys when dealing with categorical types.
How to Use the Pandas groupby()
To use the groupby method, simply call it on a DataFrame and pass the column (or columns) you wish to group by.

In the section above, we discussed the three steps to group data. Let’s implement these three steps with the help of an example!
Step 1: Splitting the Dataset
Consider the following Python code where we create a DataFrame with some observed values:
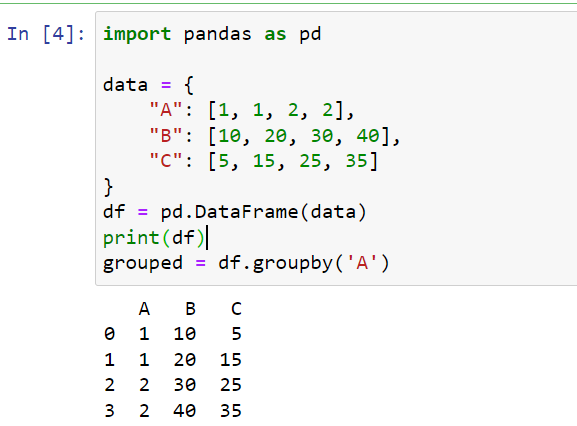
import pandas as pd

# Sample DataFrame
data = {"A": [1, 1, 2, 2], "B": [10, 20, 30, 40], "C": [5, 15, 25, 35]}
df = pd.DataFrame(data)

# Group DataFrame by column 'A'
grouped = df.groupby('A')
This code creates a pandas DataFrame using a dictionary, where keys “A”, “B”, and “C” are column names and the corresponding lists are the column data.
The groupby(‘A’) function then groups the DataFrame objects by column ‘A’.
This results in two groups: one for rows where ‘A’ is 1 and another where ‘A’ is 2.
Step 2: Applying a Function
After grouping the data, you can apply aggregation functions such as sum, mean, min, max, or count to obtain summarized results.
Let’s apply a sum function to our grouped data:
# Calculate the sum of each group
grouped_sum = grouped.sum()
The aggregated output will be:
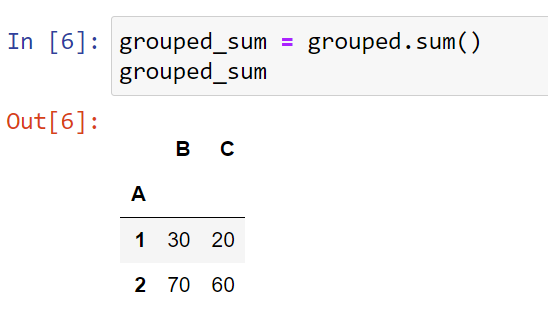
It’s important to note that groupby object preserves the order of rows within each group.
You can also group by multiple columns by passing a list of column names to the groupby function.
The following example demonstrates this use case:
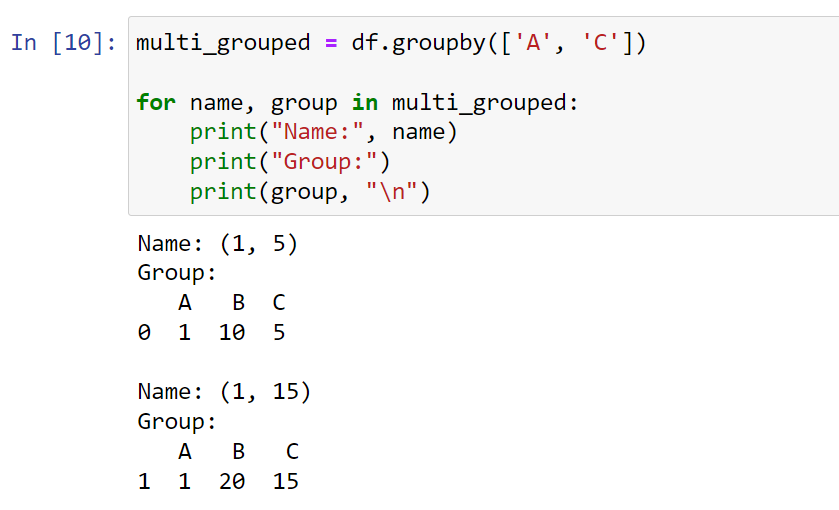
# Group DataFrame by columns 'A' and 'C'
multi_grouped = df.groupby(['A', 'C'])

for name, group in multi_grouped:
    print("Name:", name)
    print("Group:")
    print(group, "\n")
We group the data by 2 columns and then use a for loop to display the results.
Step 3: Combine the Results
After applying a function to your groups, pandas will automatically combine the results into a new DataFrame or Series. The structure of this resulting data depends on the function you’ve applied and the structure of your original data.

Here’s an example using your previous code:
# Group and apply sum function
grouped = df.groupby(['A', 'C']).sum()

print(grouped)
In the case of our example, we use the sum() function, which returns a new DataFrame with the same column names as our original DataFrame and the sum of each group as the row values.
Every single aggregated value created by the groupby method is now a single row in the resulting DataFrame. This single row is a summary of that group, such as the sum, mean, or count of the values in the group.
Aggregate Functions in Groupby
We’ll discuss several aggregation operations available in Pandas groupby, which help summarize and analyze data more meaningfully.
DataFrame.groupby.agg() allows us to apply one or multiple aggregation functions to the grouped data.
A few methods include mean, count, max, min, sum, and median.
The following is a brief overview of these functions:
- mean: Computes the arithmetic mean of a specified column.
- count: Returns the count of non-null values in each group key.
- max: Finds the maximum value of a column within each group.
- min: Determines the minimum value of a column within each group.
- sum: Calculates the sum of the values in the selected column for each group.
- median: Gets the median value of a specified column.
These functions can be used individually or in combination with each other.
How to Filter and Sort with Groupby
One of the main advantages of groupby() is its ability to filter and sort data within groups. This is useful when working with large datasets, as using these operations can make your analysis more efficient.
One common way to sort and filter data within groups is by using sort_values() and groupby() functions in combination.
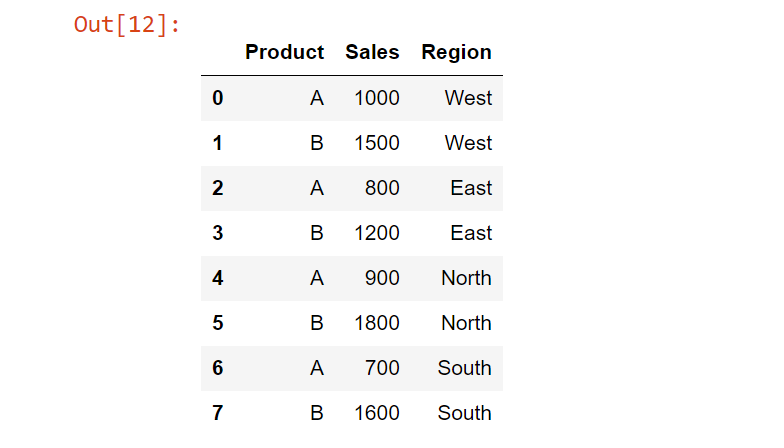
Let’s say we have a DataFrame df representing sales data, where ‘Product’ represents different product names, ‘Sales’ represents the sales volume, and ‘Region’ represents different regions:
import pandas as pd

data = {
    "Product": ['A', 'B', 'A', 'B', 'A', 'B', 'A', 'B'], # string
    "Sales": [1000, 1500, 800, 1200, 900, 1800, 700, 1600], #dtype int64
    "Region": ['West', 'West', 'East', 'East', 'North', 'North', 'South', 'South'] #string
}
df = pd.DataFrame(data)
The data looks like the following:
If you want to see the highest sales in each region, you could sort by ‘Sales’ and then group by ‘Region’ as the object’s index.
Here’s how you can achieve this:
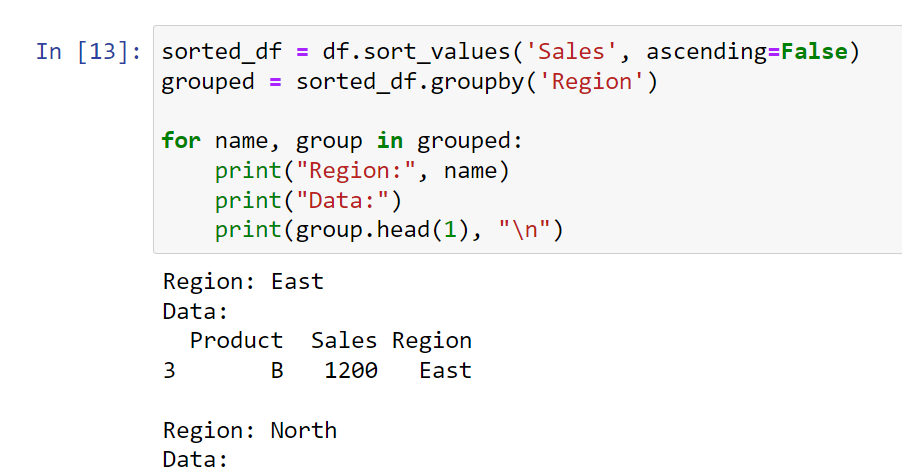
sorted_df = df.sort_values('Sales', ascending=False)
grouped = sorted_df.groupby('Region')

for name, group in grouped:
    print("Region:", name)
    print("Data:")
    print(group.head(1), "\n")
In this case, we first sort the DataFrame by ‘Sales’ in descending order, and then we group by ‘Region’. For each group, we print out the row with the highest sales (the first row of each group, because we sorted the DataFrame before grouping).
For filtering, you can use the filter() function with groupby(). For example, if you want to only keep groups with total sales over 2500, you could do:
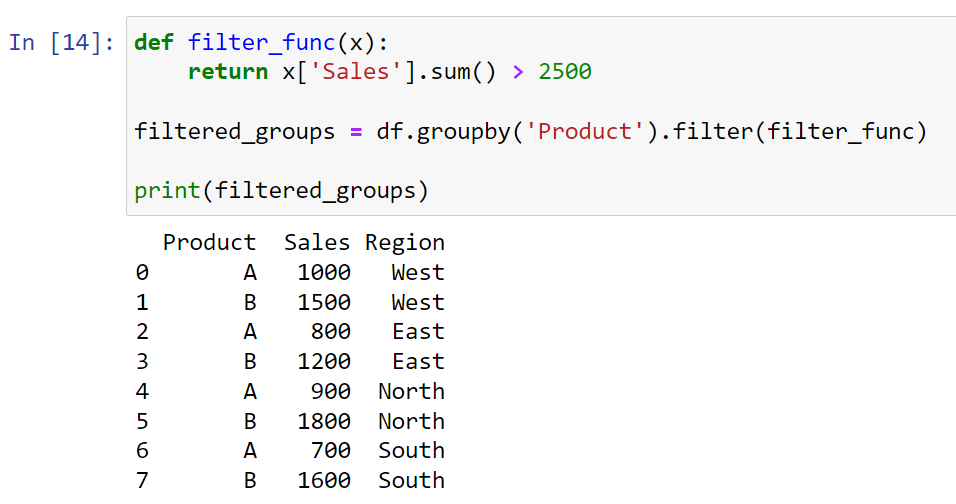
def filter_func(x):
    return x['Sales'].sum() > 2500

filtered_groups = df.groupby('Product').filter(filter_func)

print(filtered_groups)
In this example, filter_func is a function that takes a DataFrame (the group) and returns a boolean value. The filter() function applies this function to each group, and only keeps the groups where the function returned True. So in this case, it will only keep the products where the total sales are over 2,500.
Learn more about analyzing and manipulating data in Python by watching the following video:
Final Thoughts
When you’re dealing with large datasets, grouping data based on certain criteria can provide invaluable insights. You’ll find yourself reaching for groupby() time and time again in your data analysis journey. This function simplifies data manipulation and enables more complex operations on specific data subsets.
Understanding and effectively using groupby() gives you the ability to discover patterns or trends that may otherwise remain hidden within your data. For example, you can easily calculate summary statistics for each group, filter data based on group characteristics, or even apply custom functions to your groups.

Frequently Asked Questions
In this section, you’ll find some frequently asked questions that you may have when working with Pandas groupby in Python.

How do I apply multiple aggregations in pandas groupby?
To apply multiple aggregation functions in pandas groupby, simply pass a dictionary containing the column name(s) and the desired aggregation function(s) in a list to the agg() method.
For example:
import pandas as pd

# sample DataFrame
data = {'A': [1, 1, 2, 2], 'B': [3, 4, 5, 6]}
df = pd.DataFrame(data)

# multiple aggregations using groupby
result = df.groupby('A').agg({'B': ['sum', 'mean']})
This will group df by column ‘A’ and calculate the sum and mean of column ‘B’ for each group.
What does groupby() do in pandas?
groupby() is a powerful function in pandas that splits a DataFrame into groups based on some criteria, applies a function to each group independently, and then combines the results into a new DataFrame or Series.
This split-apply-combine process helps in performing various data analysis tasks like aggregation, transformation, and filtering.
What is the difference between groupby and pivot in Python?
groupby and pivot are both used to reorganize data in pandas DataFrames, but they serve different purposes.
groupby is used to group data based on some criteria, apply a function (like aggregation) to each group, and then combine the results.
On the other hand, pivot is used to reshape data by creating a new, tabular structure from a DataFrame. It allows converting a long-form dataset to a wide-form one by creating a new DataFrame indexed by unique values from a given column and columns with values from another.
How can I group rows by column value in a pandas DataFrame?
To group rows by column value in a pandas DataFrame, use the groupby() function followed by the column name you want the data to be grouped by.
For example:
import pandas as pd

# sample DataFrame
data = {'A': [1, 1, 2, 2], 'B': [3, 4, 5, 6]}
df = pd.DataFrame(data)

# group rows by the 'A' column
grouped_df = df.groupby('A')
How do I use groupby with custom aggregation functions?
You can use a custom aggregation function in pandas groupby by passing the function to the agg() method:
import pandas as pd

# sample DataFrame
data = {'A': [1, 1, 2, 2], 'B': [3, 4, 5, 6]}
df = pd.DataFrame(data)

# custom aggregation function
def custom_agg(x):
    return x.sum() / x.count()

# using groupby with custom aggregation function
result = df.groupby('A').agg({'B': custom_agg})
This will calculate the custom aggregation for column ‘B’ based on the groups defined by column ‘A’.


