One of the main features of Python is its support for external libraries. This feature opens up numerous possibilities for working with data. NumPy is a Python library used for numerical computing and scientific applications. It comes loaded with a range of functions including the numpy.linspace() function.
The numpy.linspace() function creates an array by taking parameters such as start, stop, and num, where start is the starting value of the sequence, stop is the final value, and num is the number of samples to generate. It’s primarily used in data analysis and visualization to generate a sequence of numbers for constructing a range of values for analysis, plotting graphs, etc.

In this article, we’ll discuss the linspace() function in Python. We’ll start from the basics and move towards the more advanced use cases of linspace().

Let’s get into it!
Syntax of linspace()
The syntax for using numpy.linspace() function is as follows:
numpy.linspace(start, stop, num=50, endpoint=True, retstep=False, dtype=None, axis=0)A brief explanation of each parameter in the numpy.linspace() function is as follows:
- start (required): The starting point of the interval range. The sequence will begin at this value.
- stop (required): The endpoint of the interval range. Depending on the value of the endpoint parameter, this value may or may not be included in the generated sequence.
- num (optional): The number of samples to generate. The default value is 50, and it must be a non-negative integer.
- endpoint (optional): A boolean value. If it is set to True, the stop parameter will be included as the last sample in the sequence. If False, the sequence will not include the stop value. The default value is True.
- retstep (optional): A boolean value. If set to True, the function returns a tuple (samples, step) where step is the spacing between samples. The default is False, which means only the sequence will be returned.
- dtype (optional): Specifies the data type of the output array. If not provided, the function will infer the data type based on the input arguments.
- axis (optional): Specifies the axis along which the sequence should be filled in the output array. The default value is 0.
What is the Return of numpy.linspace() Function?
The numpy.linspace() function returns an ndarray, which is a one-dimensional NumPy array.
This array contains evenly spaced values over a specified range. The number of values in the array depends on the ‘num’ parameter you provide.
By default, ‘num’ is 50, meaning the function will generate 50 evenly spaced numbers between the ‘start’ and ‘stop’ values.

8 Examples of numpy.linspace()
In the above sections, we covered the basics of numpy.linespace function. Now we’ll put what we’ve learned to a test with the help of examples to help you solidify the use of numpy.linespace().

Example 1: Creating a Simple Array With numpy.linspace()
A basic use case of numpy.linspace() is creating arrays by specifying the start, stop, and num parameters.
The following is an example code for creating a simple array with np.linspace():
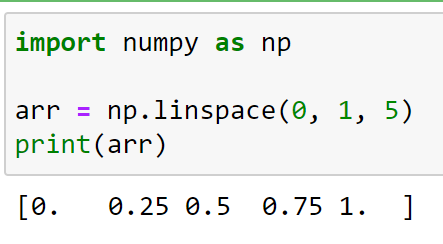
import numpy as np

arr = np.linspace(0, 1, 5)
print(arr)
We have created an array of evenly spaced 5 numbers ranging from 0 to 1. numpy.linspace(0, 1, 5) generates 5 evenly spaced points over the range from 0 to 1.
The difference between consecutive numbers (step size) is 0.25.
Example 2: Creating a Simple Array Without Endpoint
The ‘endpoint’ parameter in the numpy.linspace() function determines whether or not the stop value will be included in the generated sequence.
By default, endpoint=True, meaning the stop value is included. So if you run np.linspace(0, 10, 5), it generates a sequence of five numbers starting at 0 and ending at 10.
However, if you set the optional parameter endpoint=False, the stop value is excluded from the generated sequence.
The following is an example of creating an array without endpoint:
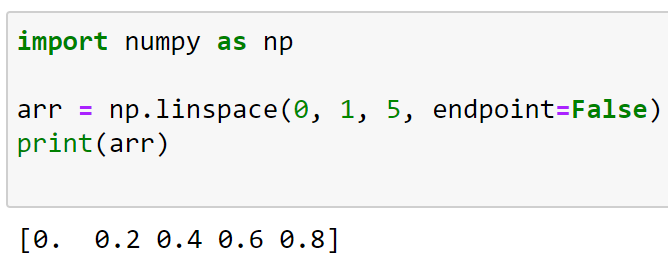
import numpy as np

arr = np.linspace(0, 1, 5, endpoint=False)
print(arr)
In this example, we have the same range and number of values as example 1, but the endpoint parameter is set to False, so the range ends just before the stop value.
Example 3: Using the rstep Parameter
The ‘retstep’ parameter in the numpy.linspace() function is an optional argument that, if set to True, will cause the function to return a tuple instead of just the array of evenly spaced values.
This tuple contains two elements:
- The first element is the NumPy array of evenly spaced values.
- The second element is a float that represents the difference (or step size) between each pair of consecutive values.
The following example demonstrates this use case:
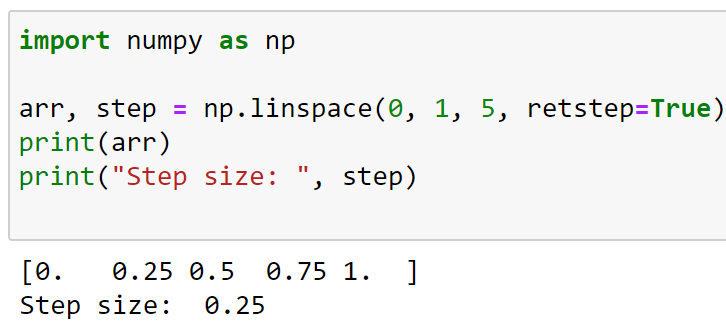
import numpy as np

arr, step = np.linspace(0, 1, 5, retstep=True)
print(arr)
print("Step size: ", step)
In this case, we’re using the ‘retstep’ parameter.
Setting retstep=True makes numpy.linspace() return a tuple, with the first element being the ndarray and the second element being the size of the step between each pair of consecutive values.

In the later part of this section, we’ll look at a few more examples of numpy.linspace().
Example 4: Generating Sequences for Plots
You can use the linspace function to create a set of evenly spaced values within a specified range, which is useful for creating x-values for plot functions in data visualization libraries like Matplotlib.
The following code demonstrates this use case:
import numpy as np
import matplotlib.pyplot as plt
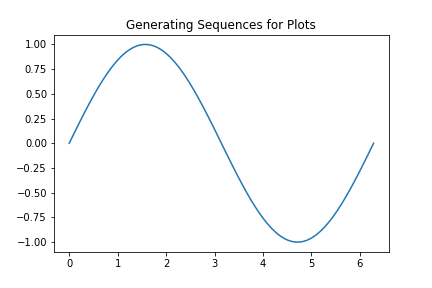
x = np.linspace(0, 2 * np.pi, 100)
y = np.sin(x)
plt.plot(x, y)
plt.show()In this example, linspace generates num equally spaced samples in the closed interval 0 and 2?, and these points are used as x-values to plot the sine function.
The plot is shown below:
Example 5: Evaluating Functions
You can also use the numpy.linspace() function to evaluate a function at a lot of points.
This is often used in combination with vectorized mathematical functions.
The following code demonstrates this method:
import numpy as np

x = np.linspace(-5, 5, 100)
y = x**2  # Evaluates x^2 for every value in x array

print(y)
In this Python script, the numpy.linspace() function is used to generate an array of 100 evenly spaced numbers between -5 and 5, which is assigned to x.
The expression x**2 then calculates the square of each number in the x array, exploiting NumPy’s vectorized operations.
This creates a new array y which contains the squares of all the values in x.
The output will be:
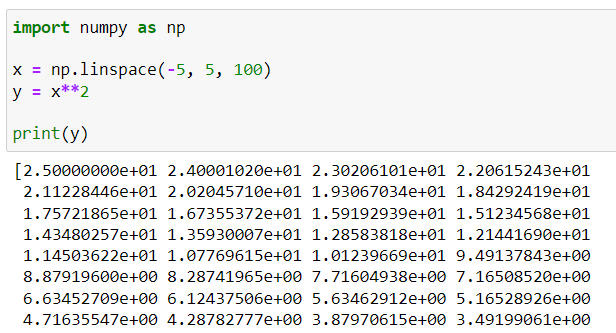
This code could be used, for example, to generate data for a plot of the function y = x² over the interval from -5 to 5.
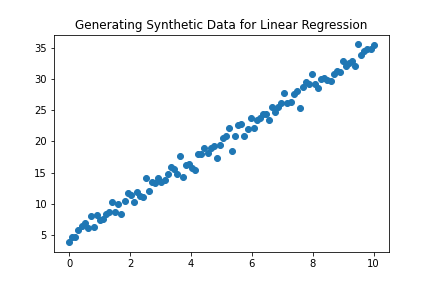
Example 6: Generating Synthetic Data for Linear Regression
The numpy.linspace() is commonly used for generating random data for testing different machine learning algorithms.
In this example, we’ll generate synthetic NumPy data type for linear regression:
import numpy as np
import matplotlib.pyplot as plt

X = np.linspace(0, 10, 100)  # generating 100 data points between 0 and 10
y = 3 * X + 5 + np.random.randn(100)  # creating a linear relationship, with some added noise

plt.scatter(X, y)
plt.show()
Here, linspace() is used to create x values for a synthetic dataset within the defined interval, which is then used along with a linear function to create y values.
This could represent a simple linear regression problem, where we try to predict y based on X.
The scatterplot produced by the code above is:
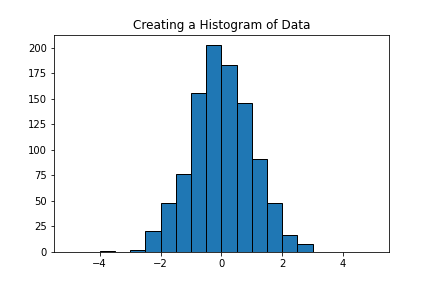
Example 7: Creating a Histogram of Data
The numpy.linspace() is also commonly used when dividing data into bins for creating histograms.
The following is an example of this method:

import numpy as np
import matplotlib.pyplot as plt

# Generate some normally distributed random data
data = np.random.randn(1000)

# Create bin edges for the histogram
bins = np.linspace(-5, 5, 21)

# Plot the histogram
plt.hist(data, bins=bins, edgecolor='black')
plt.show()
We first create some random data with np.random.randn(1000), which generates 1,000 points from a standard normal distribution.
Then we create an array of bin edges for a histogram with np.linspace(). The histogram is then plotted with plt.hist(), using the bin edges we created.
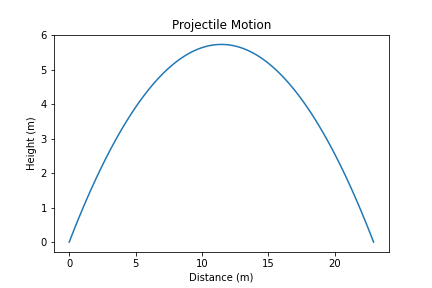
Example 8: Using numpy.linspace for Physics Simulations
NumPy’s linspace function is frequently used in physics simulations, especially when dealing with problems that involve continuous change over time or space.
By creating a range of evenly spaced values, we can simulate the continuous nature of physical quantities.
In the following code example, we’ll simulate the motion of a projectile in the absence of air resistance:
import numpy as np
import matplotlib.pyplot as plt

# Constants
g = 9.81  # gravity
v0 = 15  # initial velocity
theta = np.pi / 4  # launch angle in radians

# Time array
t = np.linspace(0, 2 * v0 * np.sin(theta) / g, 100)

# Equations of motion
x = v0 * np.cos(theta) * t  # x position as a function of time
y = v0 * np.sin(theta) * t - 0.5 * g * t**2  # y position as a function of time

plt.plot(x, y)
plt.title("Projectile Motion")
plt.xlabel("Distance (m)")
plt.ylabel("Height (m)")
plt.grid(True)
plt.show()
This script simulates the trajectory of a projectile launched at an angle of 45 degrees with an initial speed of 15 m/s.
The linspace function generates an array of 100 time values from 0 to the time of flight of the projectile (2 v0 np.sin(theta) / g).
This time array is then used to calculate the x (distance) and y (height) positions of the projectile at each point in time using the equations of motion.
Finally, it plots the trajectory of the projectile which is shown below:
Learn more about creating data science models by watching the following video:
Final Thoughts
When working with projects in data analysis, machine learning, or scientific computing domain, numpy.linspace() is a tool you’ll find invaluable.
This function allows you to generate sequences of evenly spaced values within a specified interval which a frequent requirement in these fields. It offers precision and control, from defining the range of your data to the number of data points you need.
Learning how to use numpy.linspace() adds a powerful tool to your data analysis toolbox. It allows you to understand your data better, create meaningful visualizations, and set the groundwork for your predictive models.
Frequently Asked Questions
In this section, you’ll find some frequently asked questions that you may have when working with numpy.linspace() in Python.

How to create an array with np.linspace?
To create an array using np.linspace, import the NumPy library, and call the linspace function with the desired start, stop, and num (number of samples) as parameters:
import numpy as np
array = np.linspace(start, stop, num)
For example, to create an array of 5 evenly spaced values between 1 and 2:
import numpy as np
array = np.linspace(1, 2, 5)
What are the differences between np.linspace and np.arange?
np.linspace and np.arange are both used to create NumPy arrays.
The main difference is that np.linspace uses the number of samples (num) while np.arange uses the step size for creating the arrays.
Additionally, np.linspace includes the endpoint by default, while np.arange does not.
How to generate a 2D array using numpy linspace?
To generate a 2D array using numpy.linspace, you can combine it with the numpy.meshgrid function.
Here’s an example:
import numpy as np
x = np.linspace(0, 1, 5)
y = np.linspace(2, 3, 5)
xx, yy = np.meshgrid(x, y)
How to achieve Python linspace without NumPy?
You can create an evenly spaced array without using NumPy by using Python’s built-in range function along with a list comprehension:
start = 1
stop = 5
num = 5
step = (stop - start) / (num - 1)
array_without_numpy = [start + i * step for i in range(num)]