
Outlier detection is an important task in the field of machine learning. It is used to identify unusual observations or data points that deviate from the general trend of the dataset. One effective algorithm for outlier detection is the Isolation Forest algorithm.
In today’s blog, we will cover the basics of the Isolation Forest algorithm and demonstrate how to use it to detect outliers in a dataset using Python. You can watch the full video of this tutorial at the bottom of this blog.

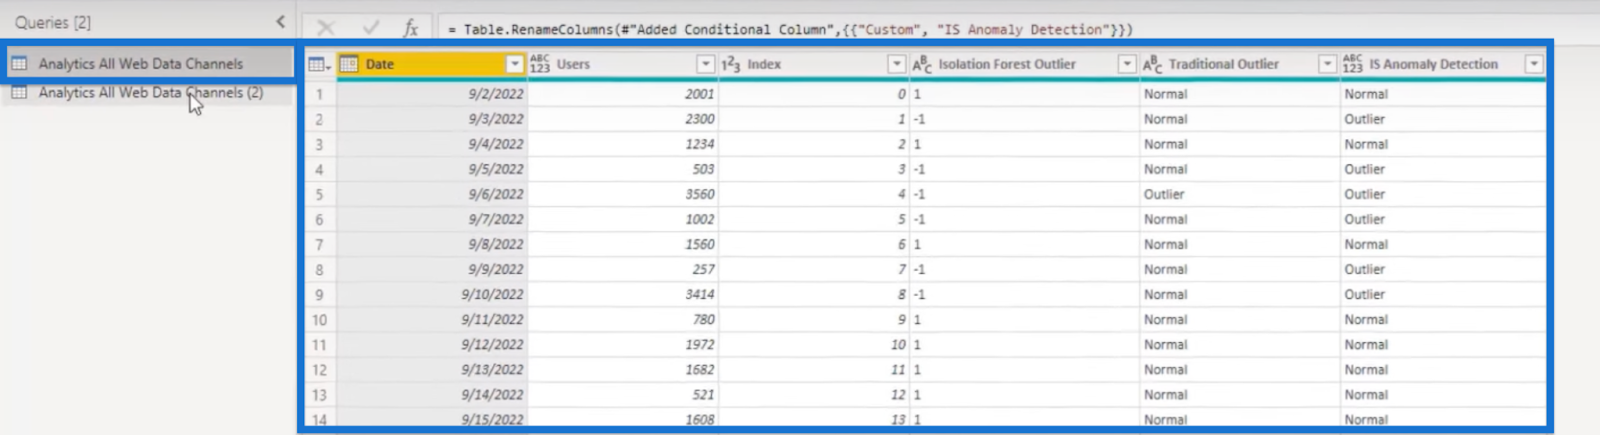
Isolation Forest Algorithm vs Box Plot Method
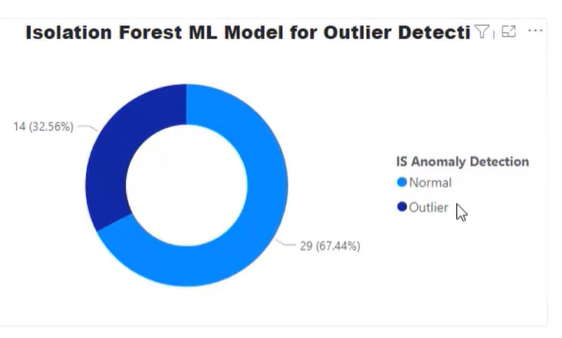
Shown below are two visuals for outlier detection. Notice the significant differences in the visual representation when using the Box Plot Method as compared to when the Isolation Forest ML Model for Outlier Detection is utilized.
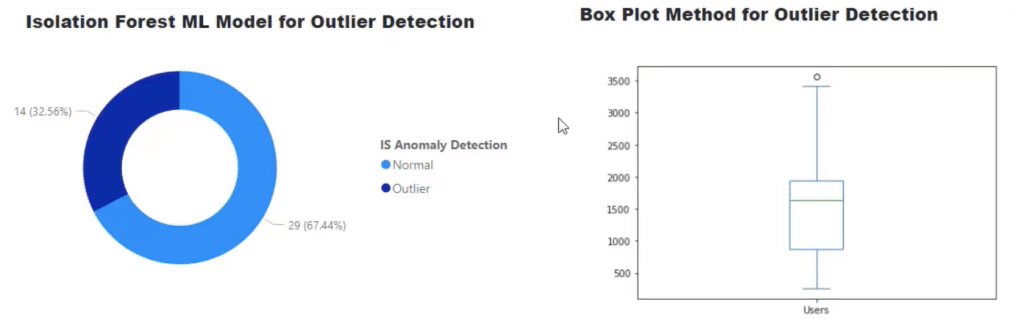
In the Isolation Forest ML Model, the percentage of outliers detected by the IS Anomaly Detection algorithm is 32.56%. Using the same algorithm, the remaining 67.44% of the data falls in the normal range, which is quite sensitive. Our goal is to fine-tune this sensitivity using Python.
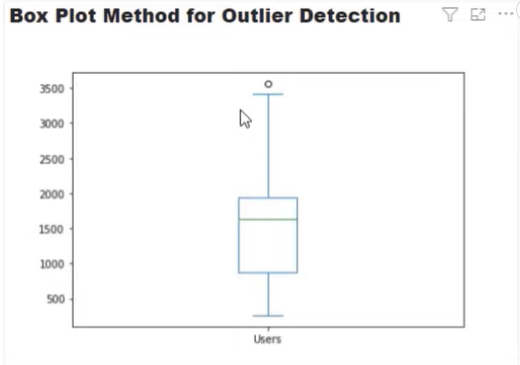
The Traditional Outlier Detection Method
The traditional way of finding an outlier is by using a box plot method. In this method, we use the IQR to find what falls outside the expected range of the data.
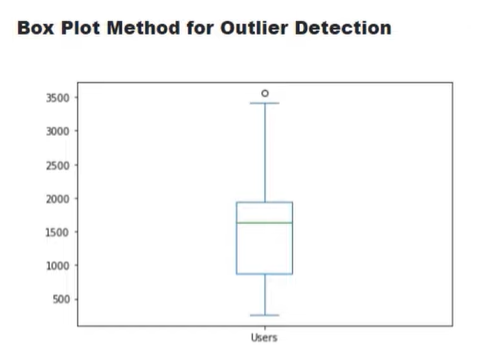
In this example, this single point above the whisker is our outlier.

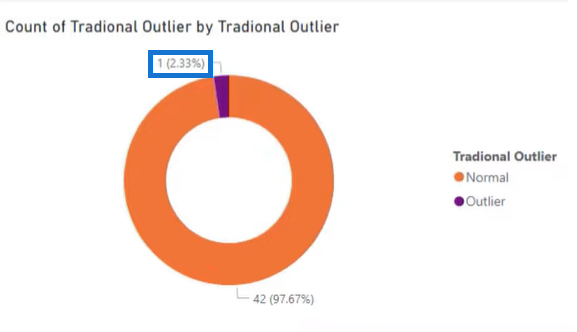
If we translate this visual graph into a pie chart, we’ll get this one particular outlier which is equivalent to 2.33% of the total data.
In this blog, we will learn how to use the Isolation Forest ML Method, fine-tune it to match the traditional method, and increase or decrease its sensitivity.
The Dataset For Isolation Forest Algorithm
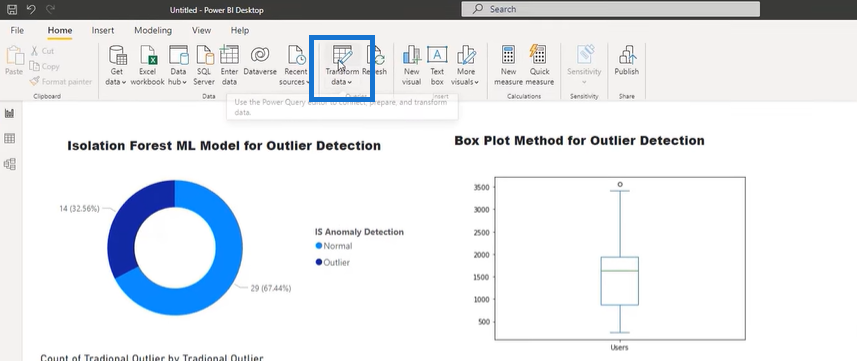
Open our dataset in Power BI. Then click Transform Data.

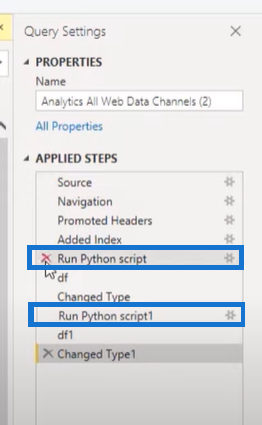
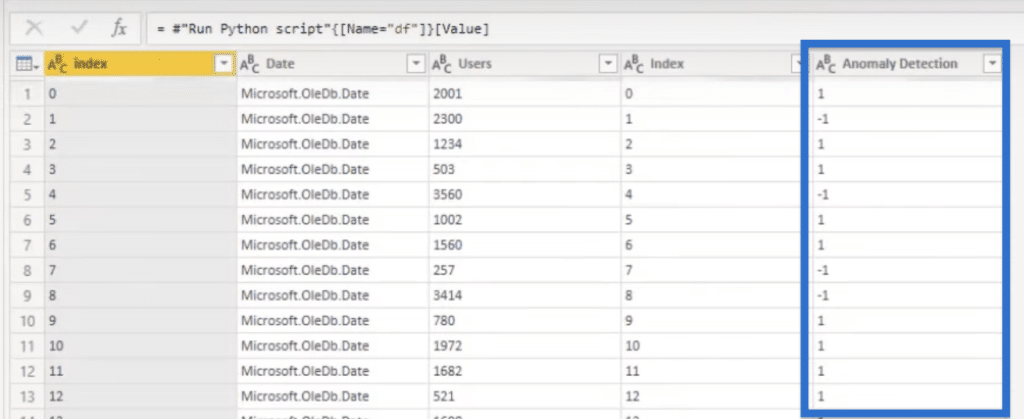
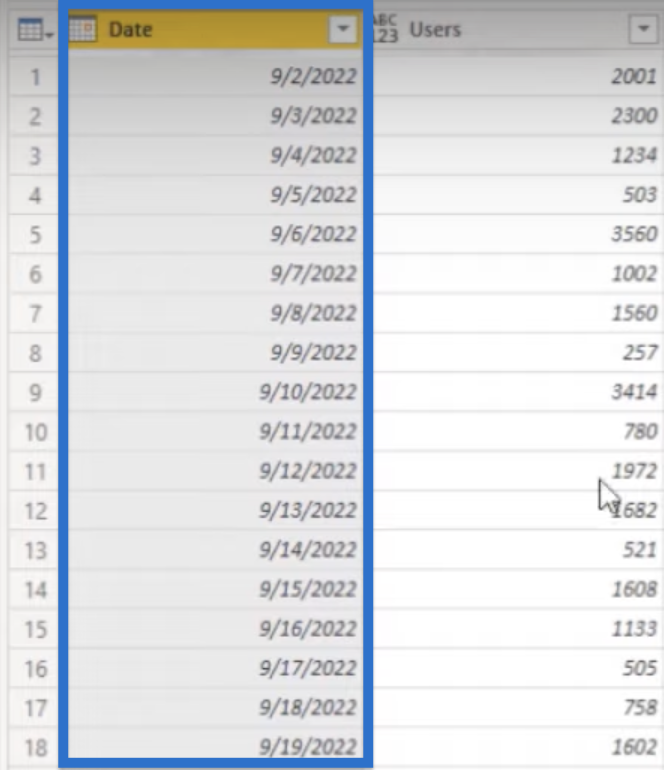
Our dataset for this tutorial will show up. It contains the Date, number of Users, Index, and Isolation Forest Outlier with output 1 for the normal range and -1 for outliers.
We also have a column for Traditional Outlier, and a conditional column titled IS Anomaly Detection reflecting the Isolation Forest Outlier.
Our second query shows our data frame which we’ll learn how to put everything together.

The Python Codes
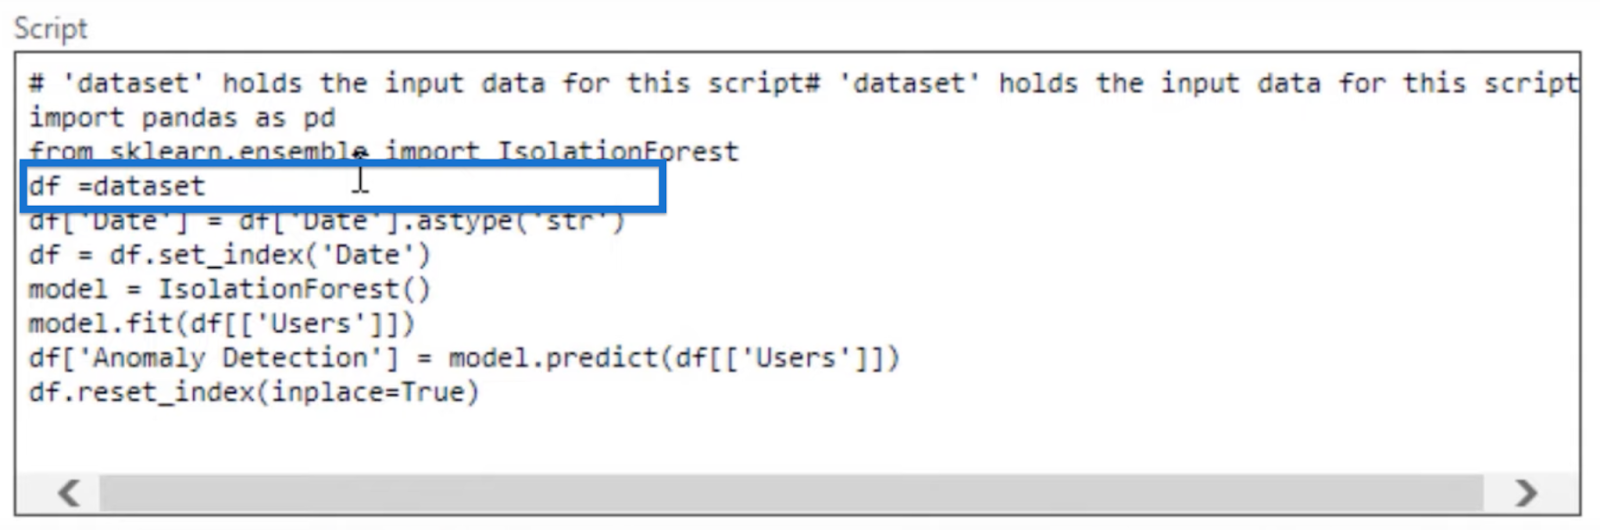
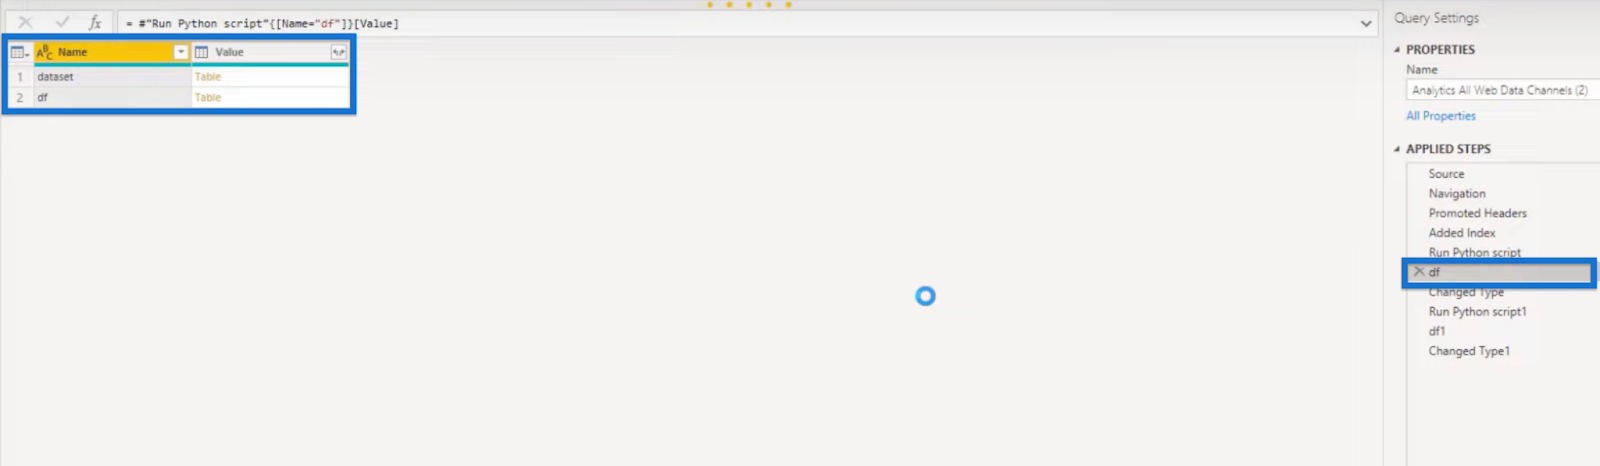
On the Properties pane, we can see our two running Python scripts. We create the Isolation Forest output with one of these Python scripts and generate the traditional outlier with the other.
Isolation Forest Algorithm Python Code
Click Run Python script to view the code.

In this Python code, we import pandas as pd and use something called Isolation Forest.

An Isolation Forest is a tree-based model which makes decisions based on a tree structure and then decides if it is an outlier or not. We call that an ensemble model because it uses two different methods of finding a particular outlier.
We also replace the dataset variable, which holds our dataset in default, as df.
Given our dataset, we won’t be needing the two lines of codes highlighted below so we can just delete those lines.

What we are doing is instantiating the model.
Save the model as IsolationForest and let the model learn the data with Users. Then, create a new column called Anomaly Detection which will go back over all the data it learns and predict which one should be an outlier or not.

For this function, the default for contamination is set at 0.5. Thus, it is super sensitive at the moment and will look for a lot of outliers. That is why in our pie chart earlier, we have a very high range of outliers at 32.56%.

To make it less sensitive, we can add contamination = .1 in the IsolationForest function.
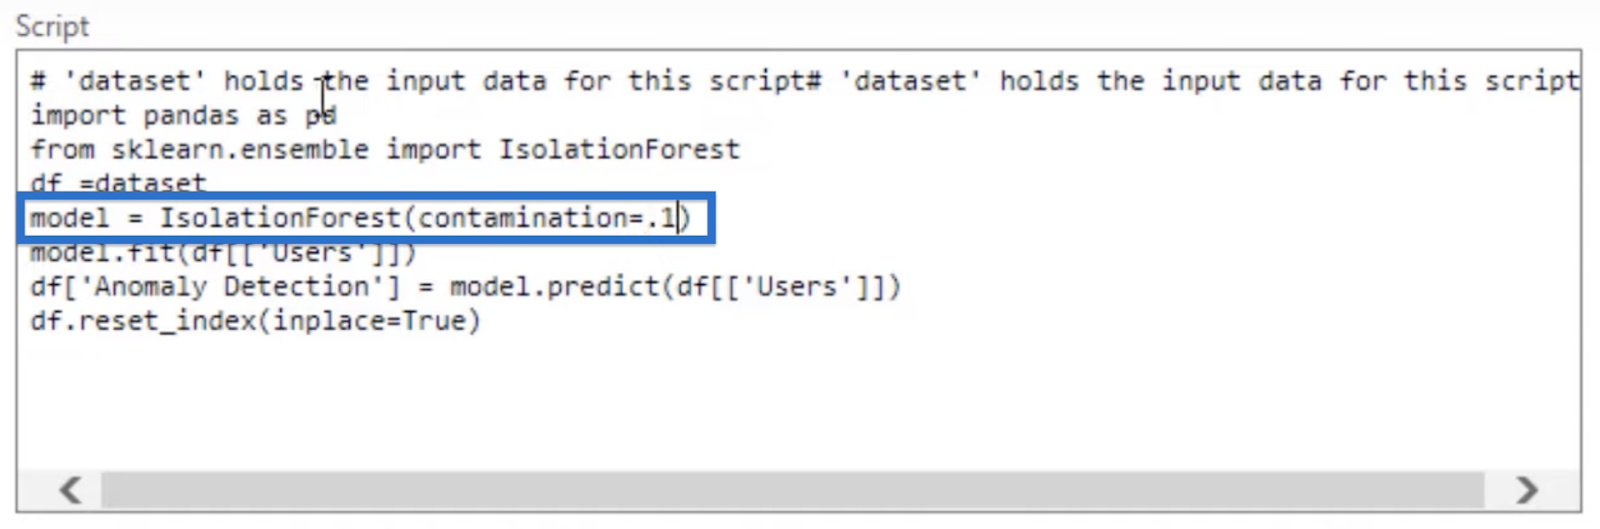
Finally, reset the index and click OK.
The result will show a summary table. Head to the Applied Steps pane and click df.

In the output, we can find the outliers under the Anomaly Detection column.
We also want to see how it performs next to the traditional outlier.
Traditional Outlier Python Code
We’ll run another Python script which in this example is the Run Python script1.

This code adds an outlier function using the first and third quartiles. When we subtract q1 from q3, we get the Interquartile Range (IQR).
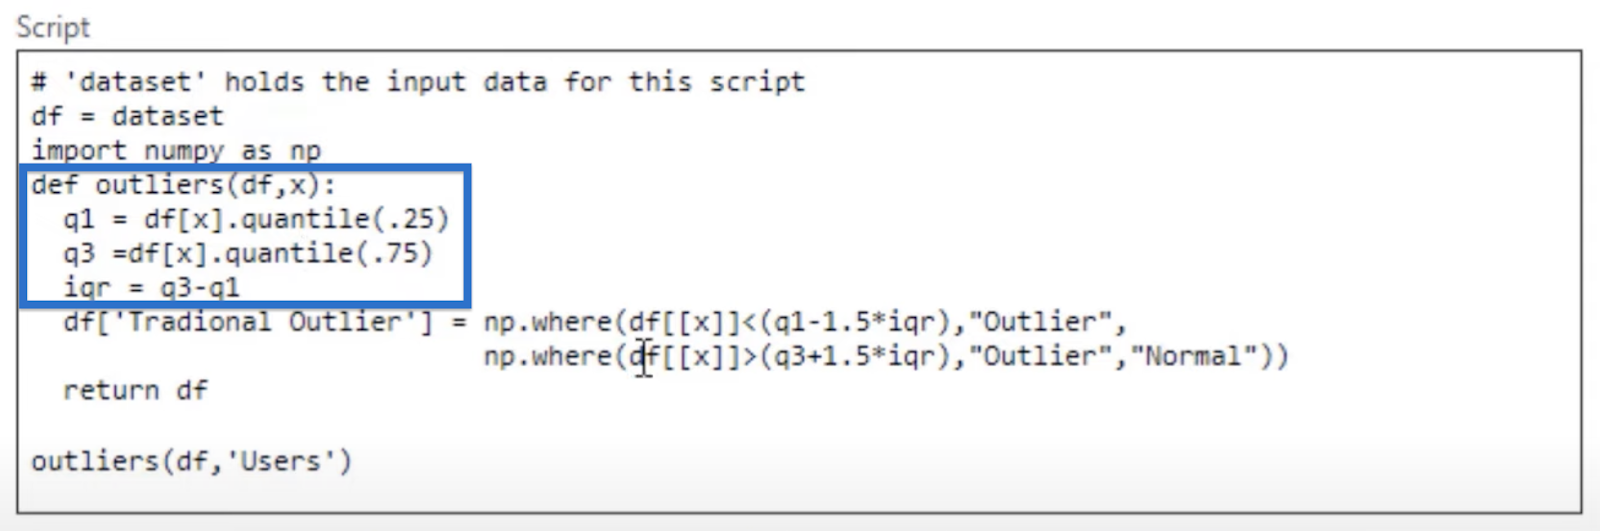
The next two lines set the conditions for the outliers. The first line says that anything less than 1.5 * iqr is considered negative or lower outliers. This is also how we find outliers in the traditional way.
We also know that we have one outlier as the highest point in our data. To account for that, the second line states that data points that are higher than q3 + 1.5 * iqr are also considered outliers.
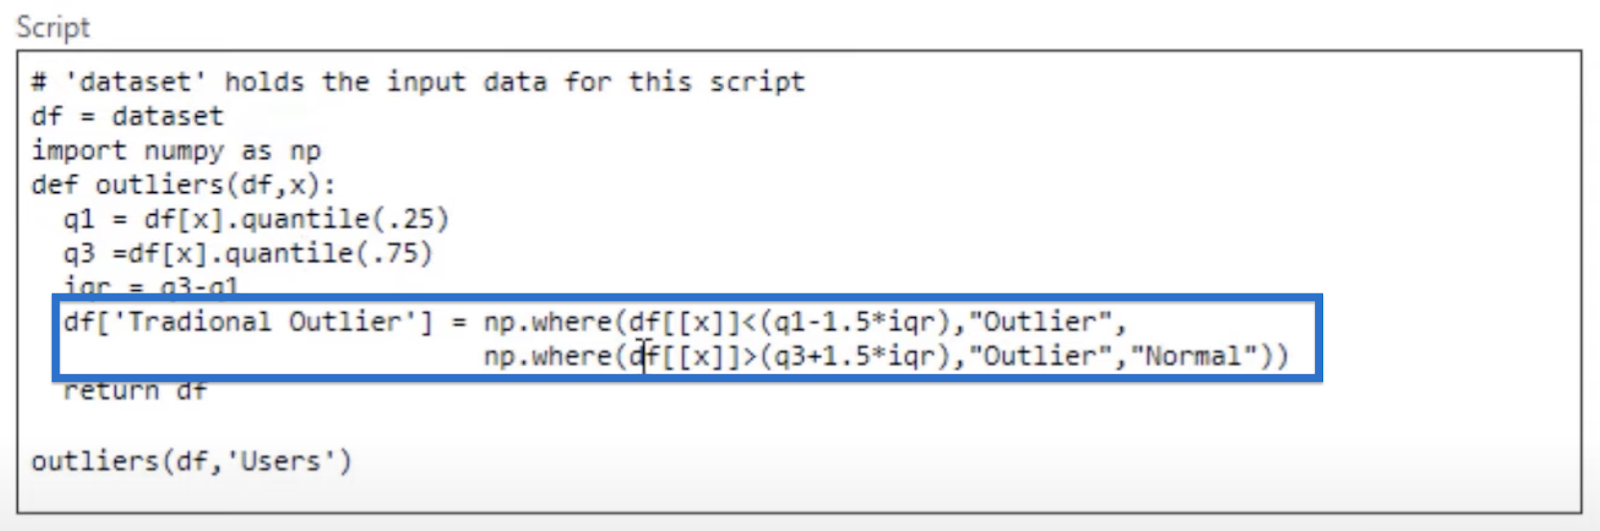
Return that data set and use the function outliers(df, ‘Users’). Then click OK.

A summary table similar to what we have earlier will appear.
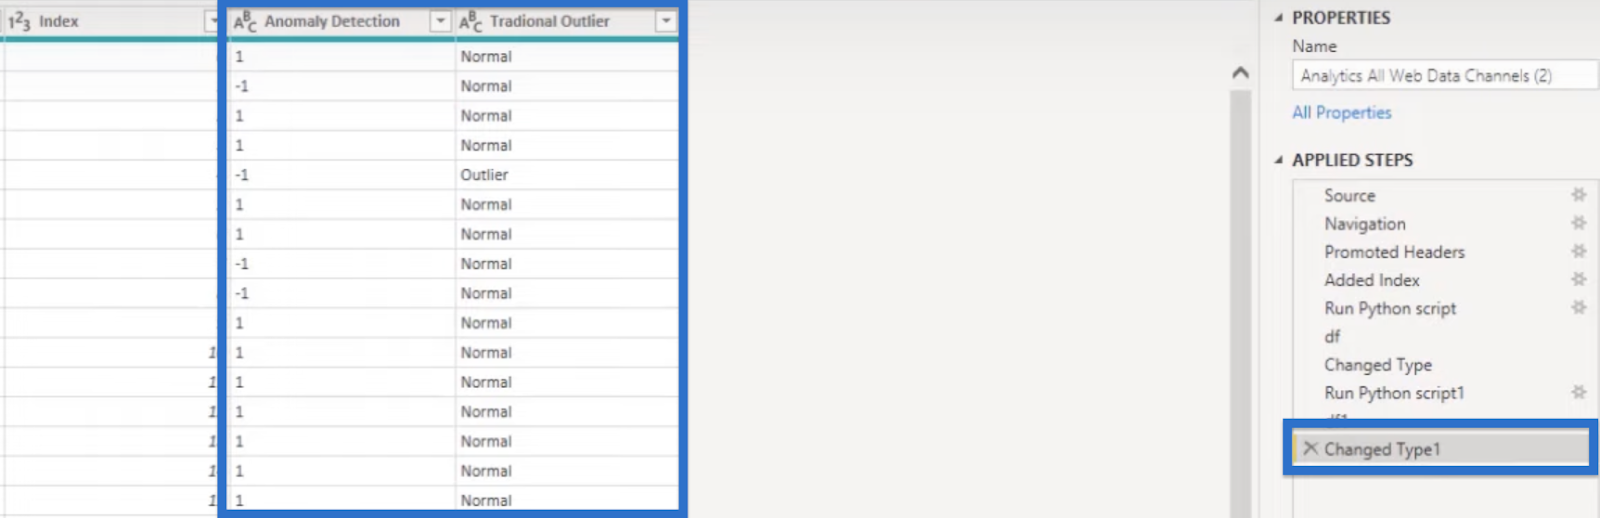
If we go to the Applied Steps pane and click Changed Type1, we’ll get Traditional Outlier and Anomaly Detection columns side by side, with the latter using 1 and -1 to denote outliers and not.
However, when we use dates with Python, they may appear messed up.
What we can do is create an additional column using the Index from the Add Column.

Then, add Index to the previous column with Merge, so we can preserve all the information in that original column/data set.
Once we have everything together, we can run our code and update our visuals. Remember that we changed the contamination of the outlier from 0.5 to 0.1, so we should see this part of the graph shrink quite a bit.

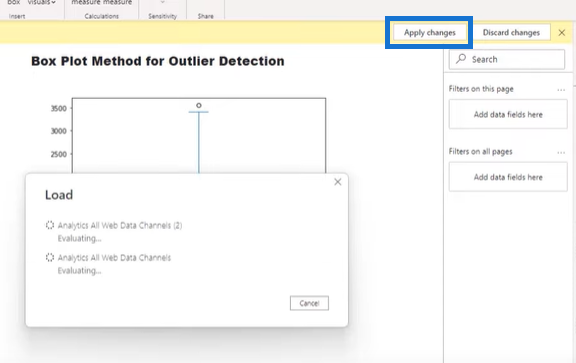
Go back to the visuals and click Apply Changes.
Notice how the Anomaly Detection went all the way from 32.56% down to 11.63% of our data.

As we see in our results, this is a good way to optimize our outlier detection.
Also remember that when people use the traditional method, they may use values lower than 1.5, but 1.5 x IQR is the traditional way, nonetheless.
***** Related Links *****
Detecting & Showcasing Outlier Results In Power BI
Creating Dynamic Outlier Trigger Points In Power BI
Power BI Anomaly Detection Feature: How It Works
Conclusion
By using the Isolation Forest algorithm, we can easily identify and exclude any unusual observations from our dataset, thus improving the accuracy of our analysis. This tutorial has provided a step-by-step guide on how to use the Isolation Forest algorithm for outlier detection using Python, which should help you get started with implementing it in your own projects.
What we did was a very easy way to use our Python code to find anomalies. You can further optimize that algorithm by modifying contamination and a host of other variables that you can learn through Python’s code page.

All the best,
Gaelim Holland


