
Did you know there is a way to create groups virtually in Power BI? You may watch the full video of this tutorial at the bottom of this blog.
I was so happy when I discovered this, as it allows you to quickly and effectively create another grouping dimension in your data sets or data tables. The Power BI team has made it so easy to implement and edit as well.
You may have already run into a problem before where you wanted to group your customer set into segments, or your store network into regional groups. You can already do this inside a calculated column, as you may know.

However, sometimes you have many different segments. You might have 15-20, for example.
In a calculated column, that’s a lot of nested IF statements…
What you actually have is the opportunity to set up a group virtually using a simple point and click.
This is exactly what I’m going to show you in this post.
Creating Virtual Groups In Power BI
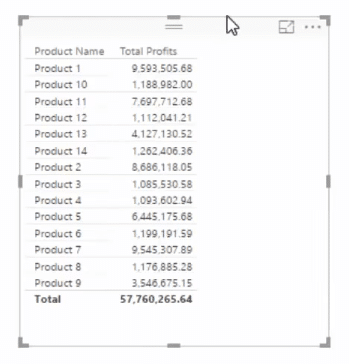
Let us first take a look at the table that we’re going to work on here.
So what we have is a table with just the list of products.
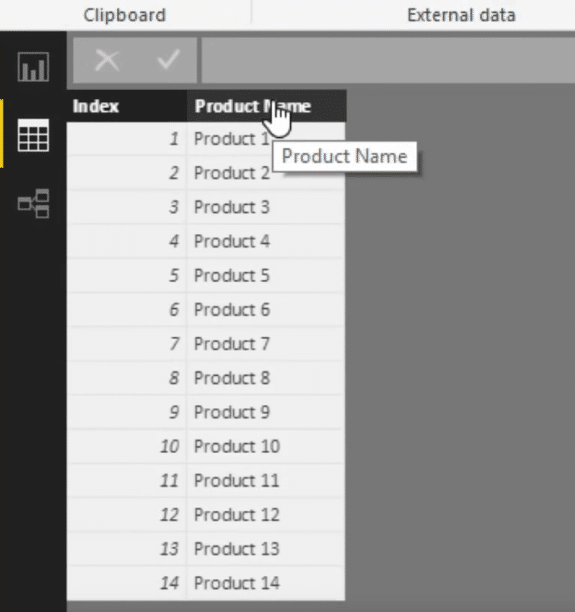
When using this technique, keep in mind that you can use it with tables that have so much information. We’re just using a simple one for this demo.

Now, let’s proceed to the steps in creating virtual groups in Power BI.
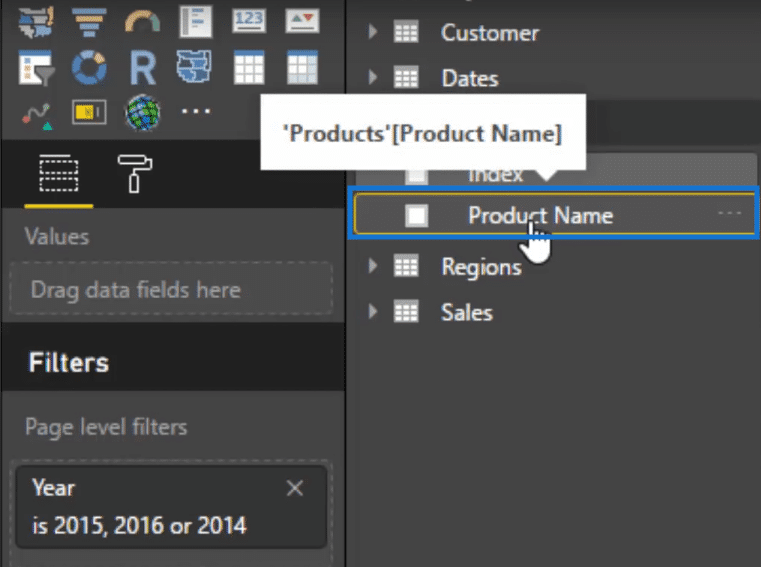
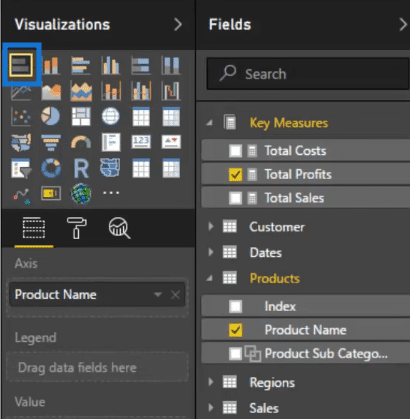
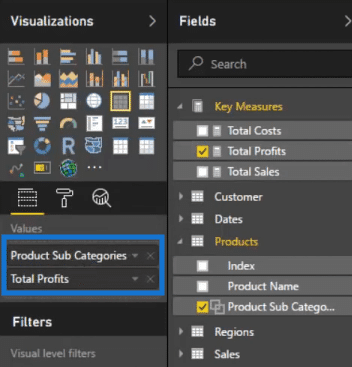
What we need to do first is to look for the column that we want to work on. This can be found in the fields section, located at the right side of the screen.
In our example, we’re working on Product Name. I’m going to click on it.
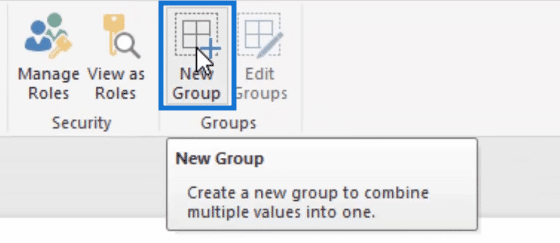
Then we’re going to click on New Group located at the top of the screen.
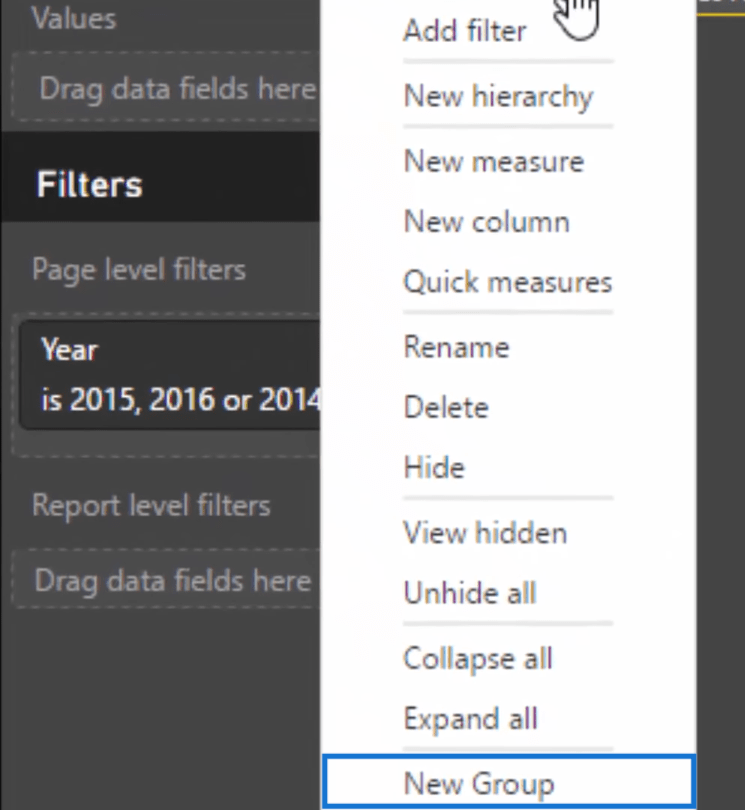
Another option, though, is to just right-click on the column that you want to do the grouping on and then select New Group.
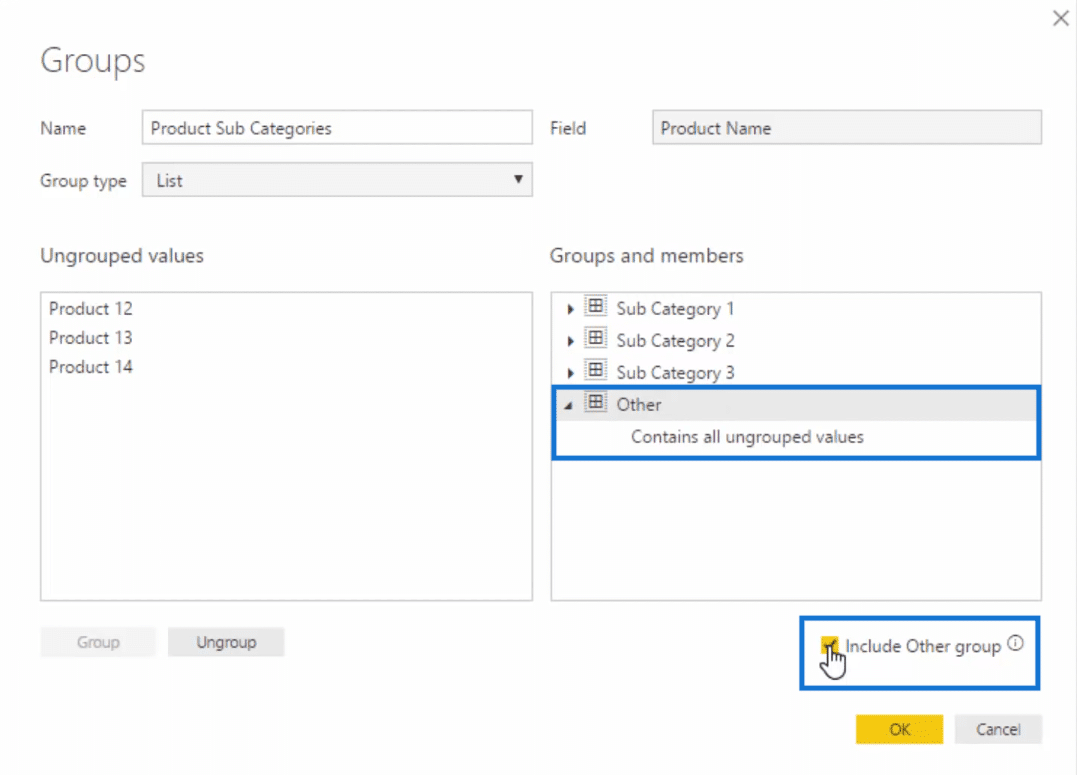
A pop-up box will appear. Let us name it Product Sub Category.
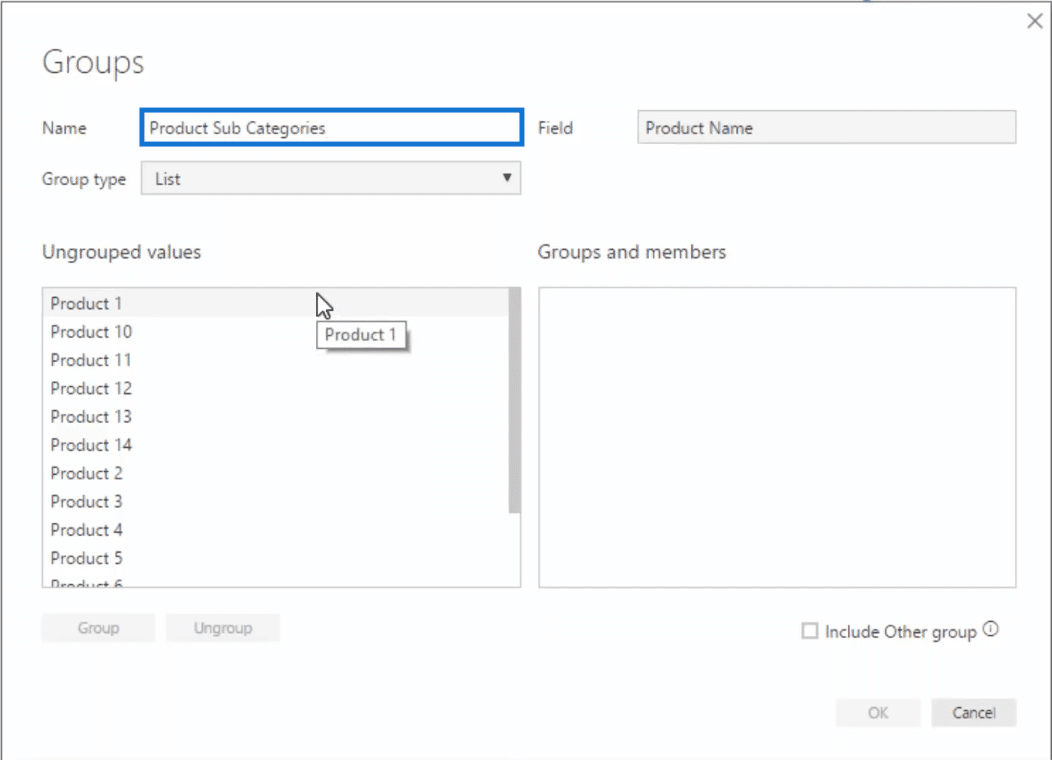
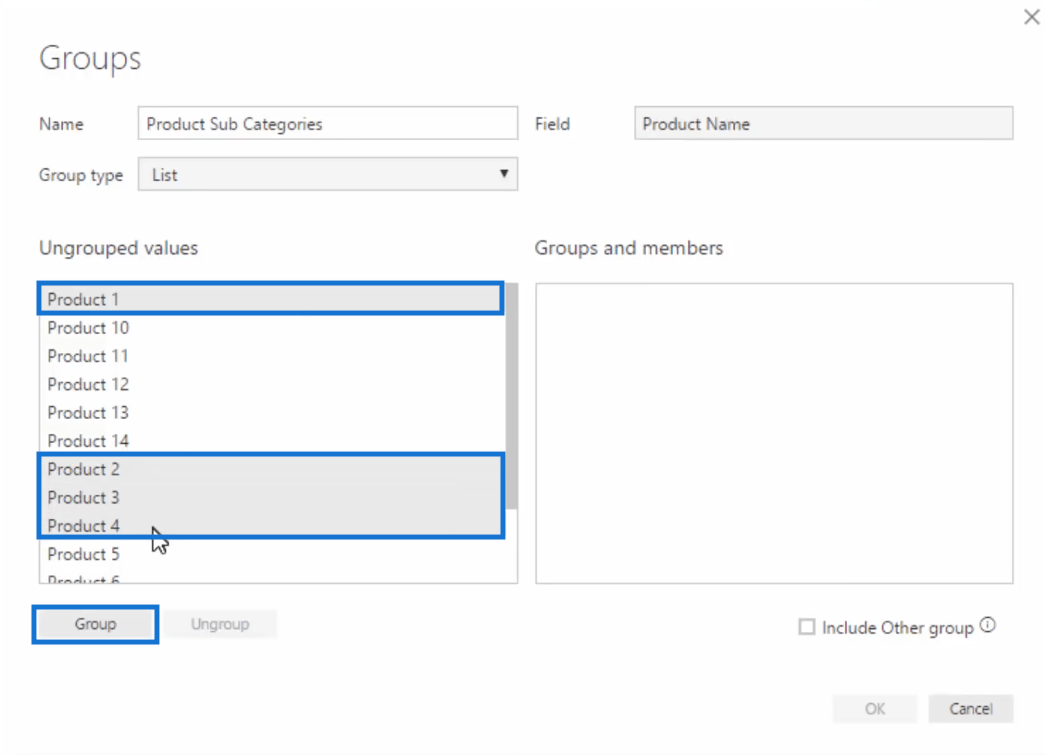
Now, we’re going to select the products that we want to group. Let’s select Products 1, 2, 3, and 4. Press and hold Control and then select Group.
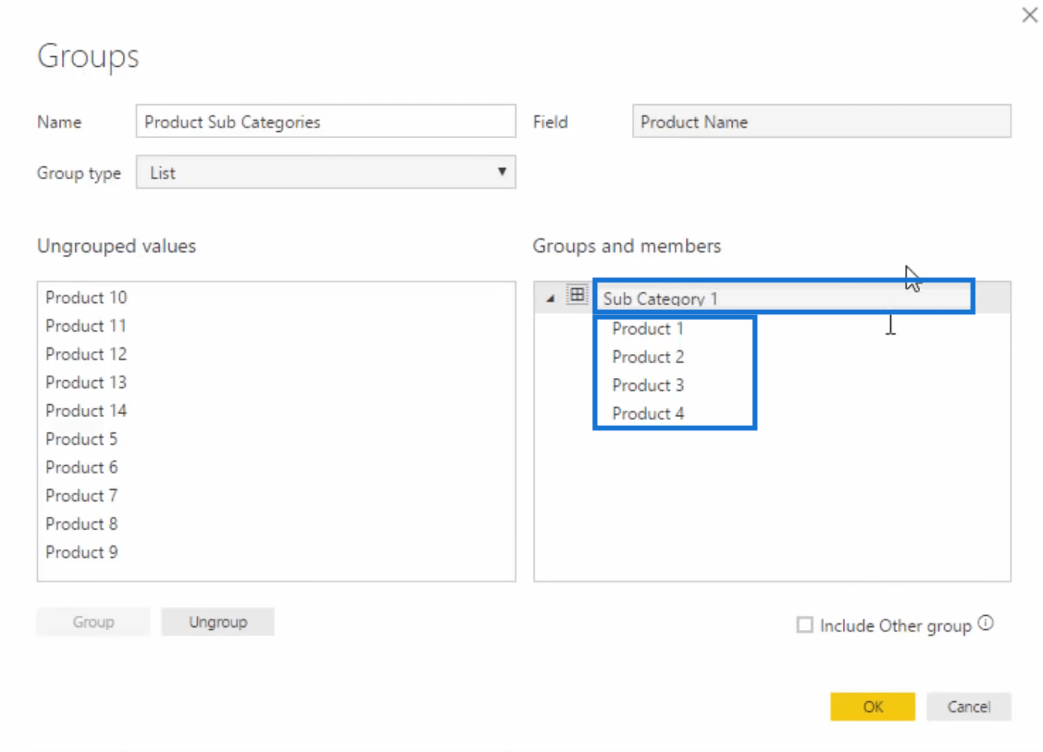
The values we selected will then be transferred to the Groups and members box. Let us call this Sub Category 1.
Let us repeat the same process to create Sub Category 2 and Sub Category 3.
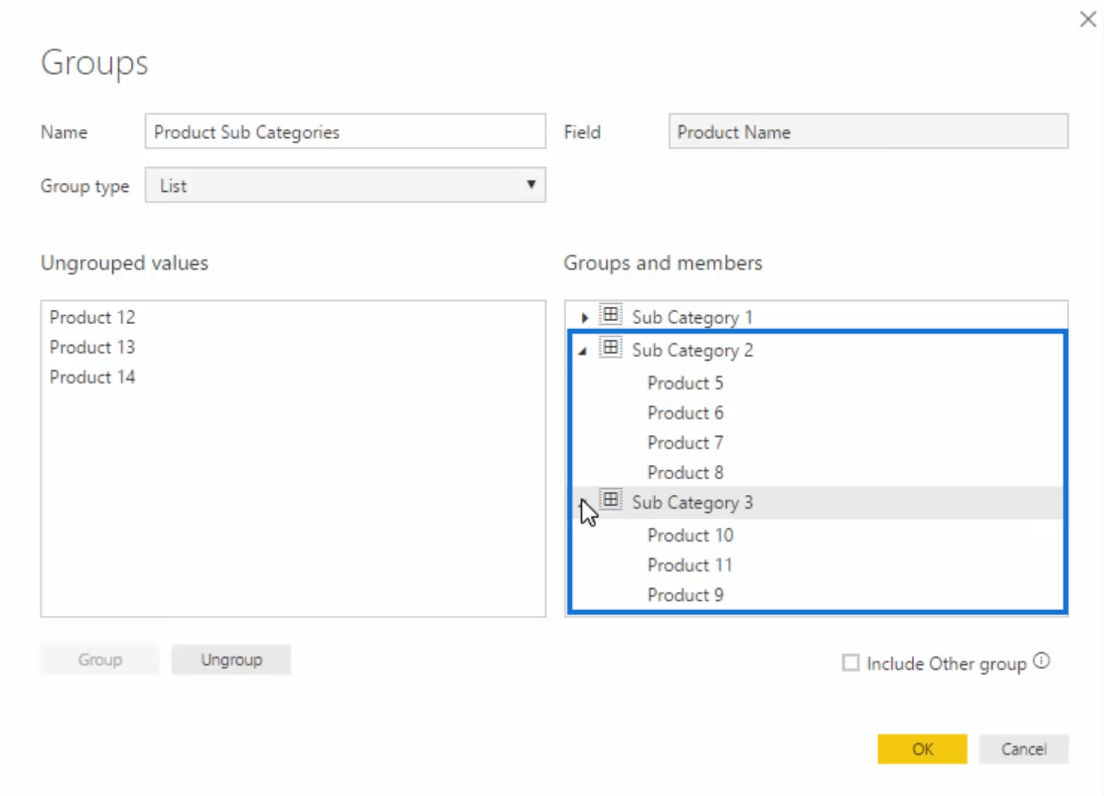
Now we have three subcategories while Products 12, 13, and 14 were left in the Ungrouped values.
If we click on Include Other groups, everything that was not included in the subcategories will be in this Other group.
Then we’re going to click OK.

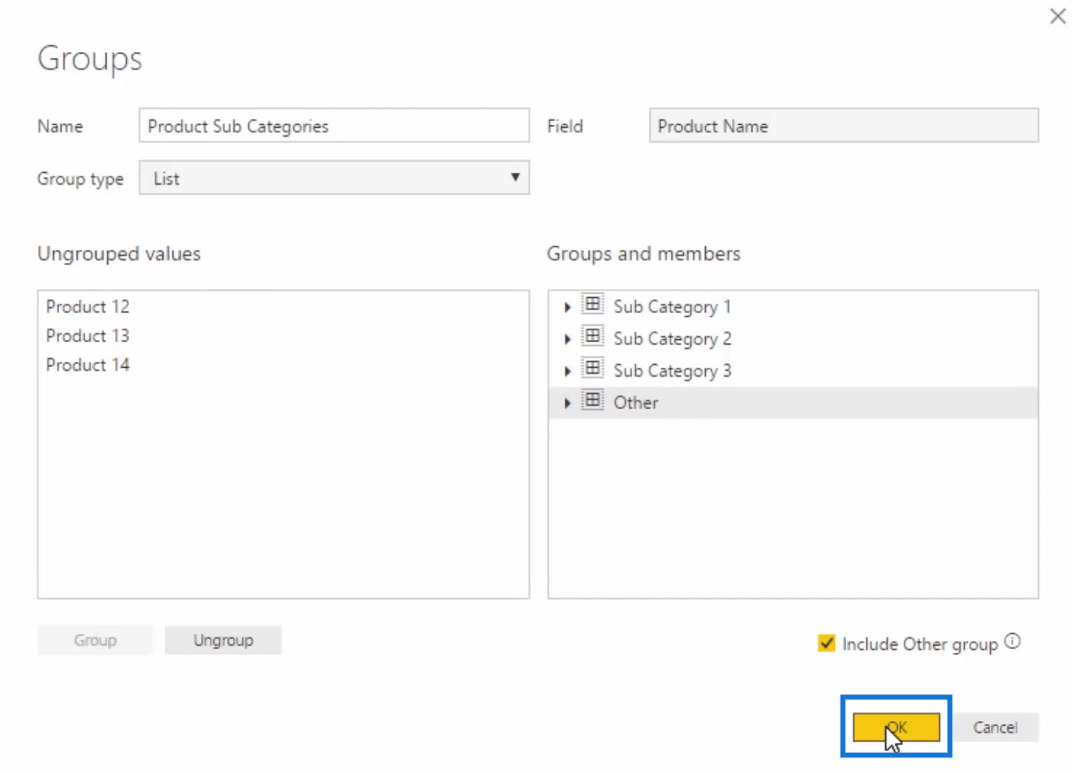
Now we have this Product Sub Categories below the Product Name.
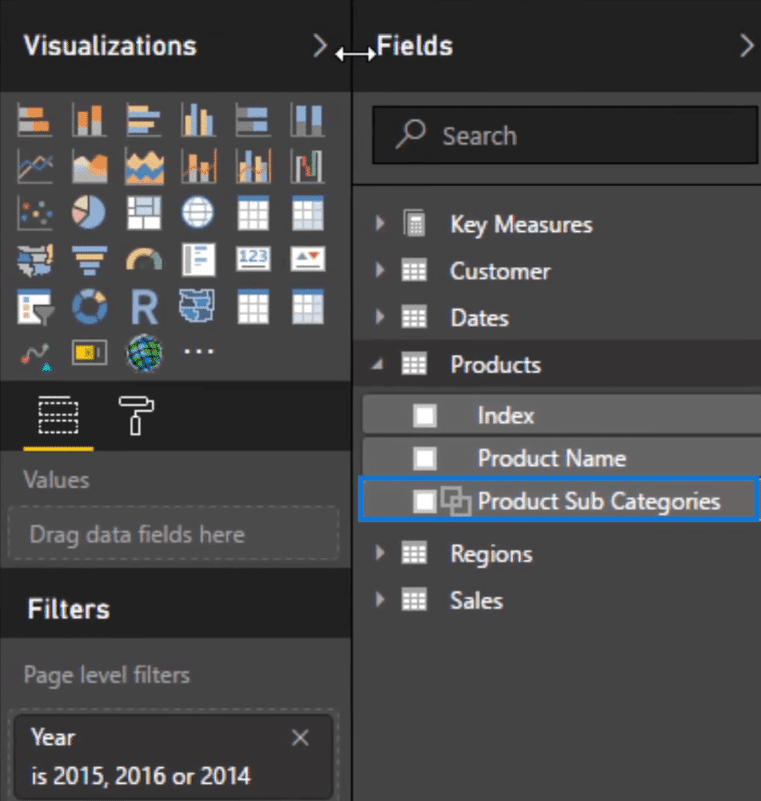
We can now use them in our report.
Using The Virtual Groups In Power BI Reports
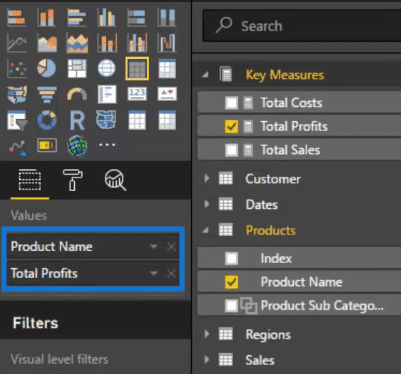
What we want to do now is to use the subcategories that we have created against another measure.
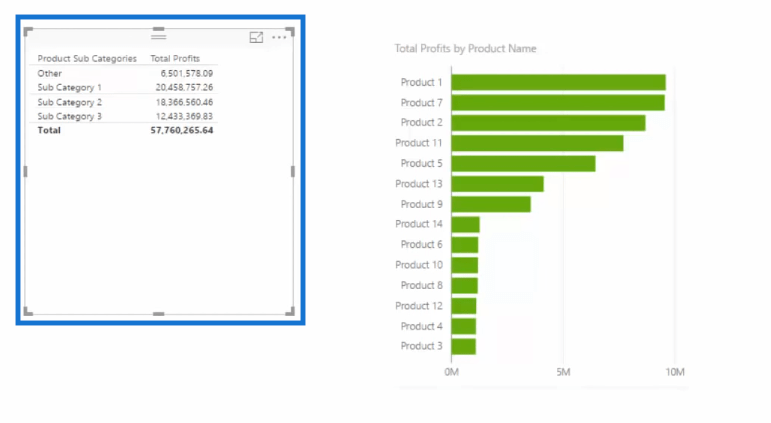
So for this particular example, let us create a table with the Product Name column and the Total Profits column.
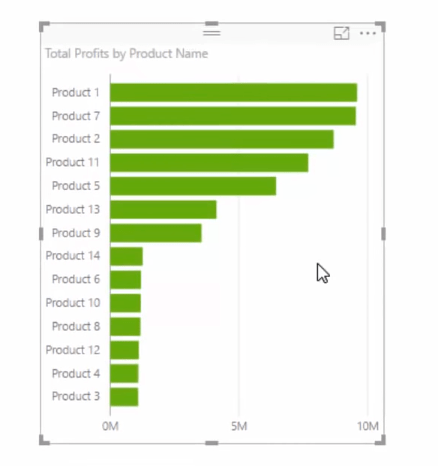
Let’s convert this table into a chart and sort it by total profits.
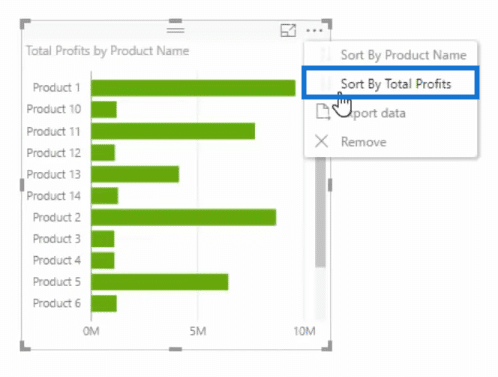
Now, we have this visual with our different products starting from the ones that give us the highest profits to the ones with the lowest profits.
If, let’s say, we have five hundred different products here and we wanted to look at them in groups, we can easily do that using the sub categories that we have created earlier.
Remember that when you create virtual groups in Power BI, it’s like having another column but it’s virtual. We can actually use the Product Sub Categories just like any other column.
So, let us grab the Product Sub Categories into our canvass and add the Total Profits.
We have now created this table on the left. As you can see it sorted the total profits by the three subcategories. And it also shows the total profits for the Other group which includes all the products that we did not add to any of the subcategories.
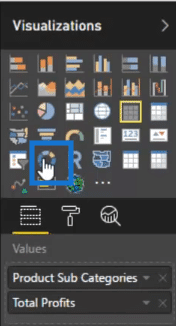
Let us then turn this table into a donut chart.
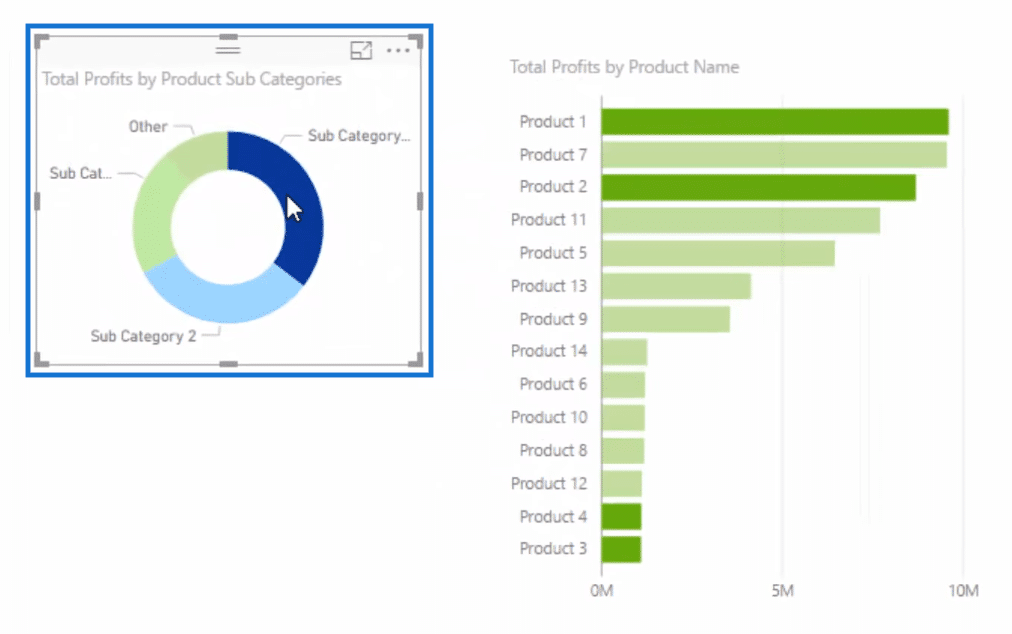
What is really cool is that this donut chart is connected to the other chart that we have created just like a calculated column.
In this image below, we clicked on Sub Category 2 in the donut chart and the other chart highlights the products that belong to this subcategory.
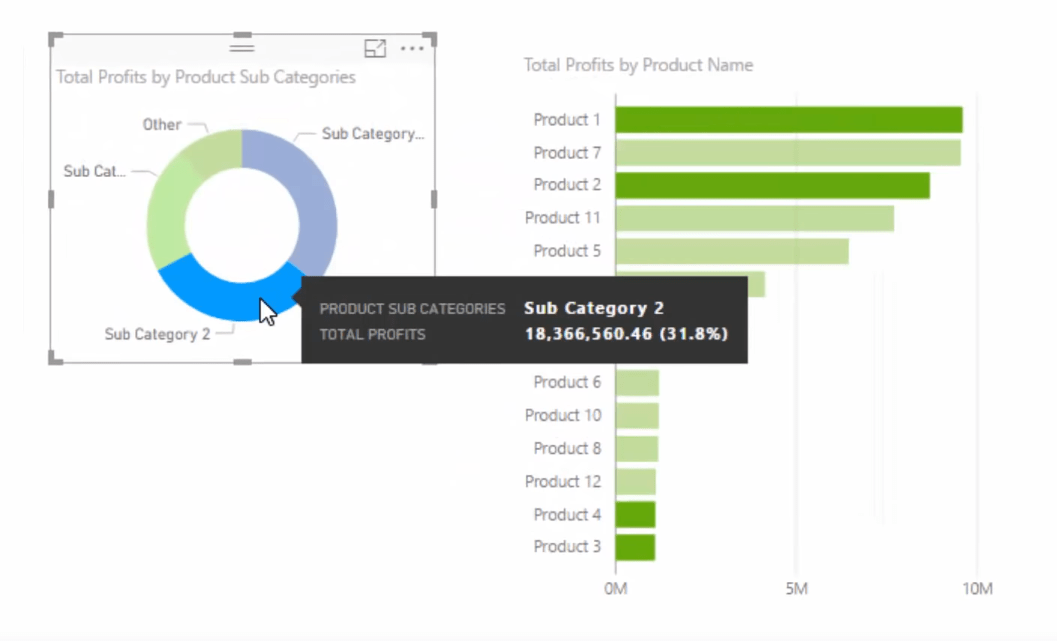
So you can still get all of the dynamic filtering that you could get from an actual dimension when using this technique in Power BI.
Some Reminders When Using This Technique
As a side note, while I do say “virtual”, the column is actually physically inserted into your table once you’ve set it up, but I think that “virtual” is a good way to think about it as you don’t have to write any logic inside a formula to create it.
I recommend using this technique inside your lookup tables. When combining these groups with your data models, you can very quickly create a range of filters across your calculations that ordinarily would not have existed in your raw tables at the source.
This is one of the quickest ways to add additional insight into your data without having to write any DAX formula.
Once you try this feature out, however, you’ll see that there are some limitations. If you wanted to create a group based on a calculation, then this feature doesn’t help too much, and you’ve got to learn DAX.
***** Related Links *****
Group Customers Dynamically By Their Ranking w/DAX In Power BI
Segment Your Customers Into Groups – Advanced DAX Example
Use DAX To Group & Segment Your Data
Conclusion
We have just discussed how to create groups virtually in Power BI using very easy steps such us pointing and clicking on the New Group option.

As we have seen, the virtual groups can be used just like any other columns. You can use these virtual groups with other columns or dimensions which they can interact with dynamically as well.
I hope you enjoyed reading this post.
If you want to learn more grouping techniques, like dynamic and static groups, check out my online course, Solving Analytical Scenarios w/DAX in Power BI.
All the best in implementing this great feature in your models.
Cheers,
Sam


