
Did you know that the ALL function can be used to modify the context of a particular calculation in Power BI? You may watch the full video of this tutorial at the bottom of this blog.
Find out everything about how this function works in the post below.

What Is The ALL Function In Power BI?
The ALL function is an extremely important part of the DAX language in Power BI. It can be used in a number of different ways within formulas.
When utilized effectively, you can calculate results seamlessly when looking to combine logic in your formulas with the filtering available in the data model.
Simply put, the ALL function can remove any context that is coming from any filter or dimension that you have aligned to a formula.
This is perfect in situations like when you want to calculate the percent of a total.
When To Use This Function?
The optimal time to use ALL within your formulas is when you need to remove or adjust the context of a calculation that you are looking to perform.
The most common function used in combination with ALL is the CALCULATE function.
There may be times when you also will use ALL in combination with the FILTER function.
The idea here is within a formula you can adjust what virtual table/context that is applied to your logic before any calculation is done across your model.

How To Use The ALL Function?
I’ll show you how to utilize this function in Power BI when calculating the percentage of sales in a particular region versus all sales ever made.
To do this logically, you need to divide the sales for the region by the total sales across all regions. Getting sales for every region, though, is not that easy with the natural filtering that will occur in your models.
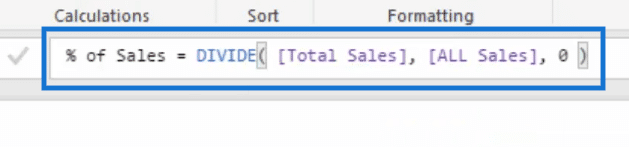
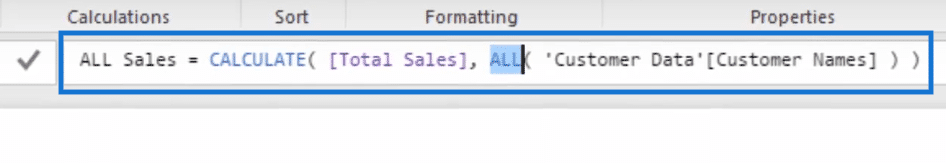
This is where ALL function comes in perfectly to solve this for us. When combined with the CALCULATE function you can remove any region filters and get the correct denominator in place so that the calculation will be correct.
In this case, we referenced the customer names column and combined it with CALCULATE so that the total of all sales can serve as the denominator to compute the percentage of sales.
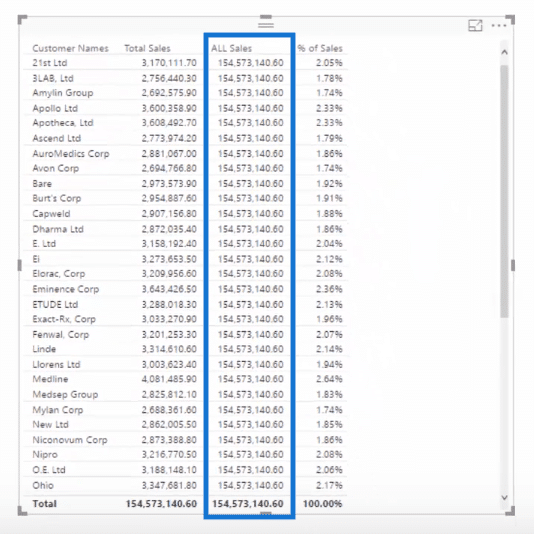
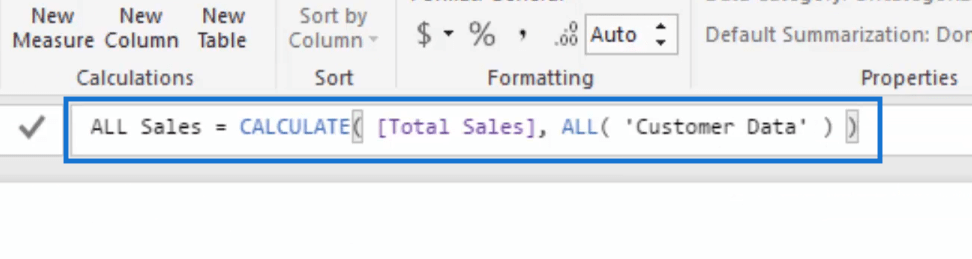
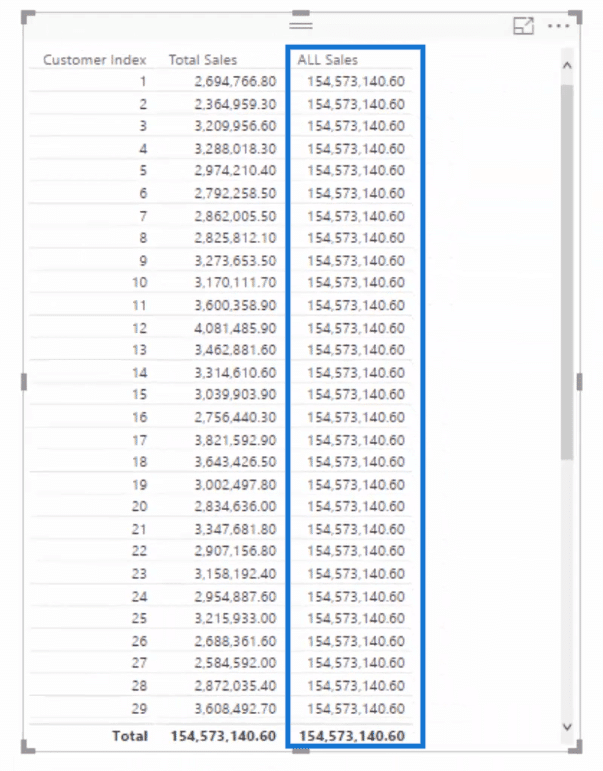
But not only can you remove the filters of every customer name, with this Power BI function you can also remove the filtering coming from any column in a particular table.
In this image below, I’ll show you what I mean. You’ll notice how the ALL Sales column simply repeats the figures from the Total Sales column.
This is because of the ALL function parameter references a specific column and that column is not the Customer Names column.
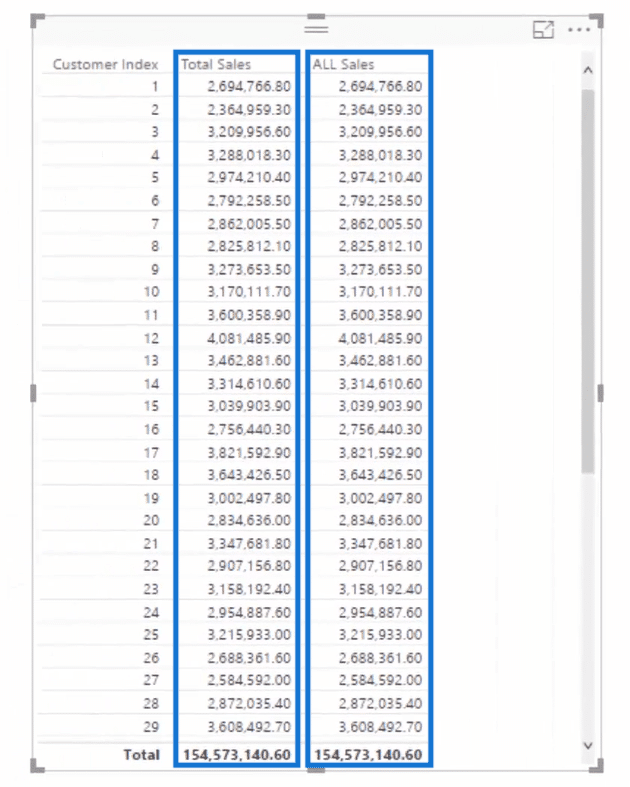
To fix this, we need to reference the entire table, instead of just a specific column. You can remove the filtering from any column within a table by referencing the entire table inside of the ALL Function.
See, for example, the formula below and the corresponding changes in the table.
Another Way To Think About The ALL Function
Hopefully by now you understand that ALL removes any filters or context within your calculation.
Another way to think of what ALL is actually doing in your formulas is to imagine that whenever you reference this particular function, you are generating a virtual table or list of each individual row of information from the parameters that have been input.
This is particularly important if you utilize ALL as the table parameter inside of the FILTER function.
A perfect example of this is the CUMULATIVE TOTAL pattern, which is detailed in this particular blog article.
Create Dynamic Cumulative Totals Using DAX In Power BI
***** Related Links*****
Deep Dive Into ALLSELECTED – DAX Function In Power BI
The Main Difference Between ALL And ALLSELECTED – Power BI & DAX
Cumulative Totals Across Averages & Dynamic Date Logic – Advanced DAX

Conclusion
In summary, think of the ALL function as like the ‘remove all filters’ function. You can place either a table or column in here, and it’s important to understand the effects of doing either.
For more examples of how you can utilize ALL, check out these links below.
Using The ALL Function In Power BI For High Quality Insights
Thanks,
Sam


