
Using logic functions to create accurate, efficient calculations is a fundamental skill in data analysis. One such function is the Switch True logic in Power BI. It allows users to perform multiple conditional checks and return specific results based on those checks.
Switch True is a logic function that evaluates a series of expressions and returns a value that corresponds to the first true condition. This makes it a valuable tool for making decisions in Power BI. It is also known as “Switch” and can be used within measures, calculated columns, and even within Power Query Editor.
In this article, we’ll delve into the Switch True logic function, its syntax, and its uses within Power BI. We’ll also go over examples to help you understand how to apply it in your reports.

Let’s get started!

What is The Syntax of Switch True Logic
The syntax for using “switch true” logic in Power BI involves the SWITCH function, where the first argument is TRUE(), followed by a series of condition-result pairs.
The general syntax of switch statement looks like this:
SWITCH(
    TRUE(),
    Condition1, Result1,
    Condition2, Result2,
    ...
    [DefaultResult]
)
The SWITCH function is a DAX function used to evaluate the conditions. TRUE() is the first argument to the SWITCH function. Using TRUE() as the first argument is what characterizes this pattern as “switch true” logic. It allows the SWITCH function to evaluate each of the following conditions in turn.
Condition1 and Condition2 are the conditions you want to test. Each condition is a logical expression that evaluates to either true or false. It is similar to if statements and an else value in other programming languages.
Result1 and Result2 are the results corresponding to each condition. If Condition1 is true, then Result1 is returned, and so on.

DefaultResult is an optional part of the syntax. If none of the specified conditions are true, the SWITCH function will return this default result. If not specified and no conditions are met, the function returns a blank.

2 Steps to Use Switch True Logic in Power BI
In this section, we will go over 2 steps to use the switch ture logic in Power BI.
The steps are given below:
Step 1: Import the Dataset into Power BI
Open Power BI Desktop.
Click on Get Data and choose the appropriate sample data source to import your dataset.
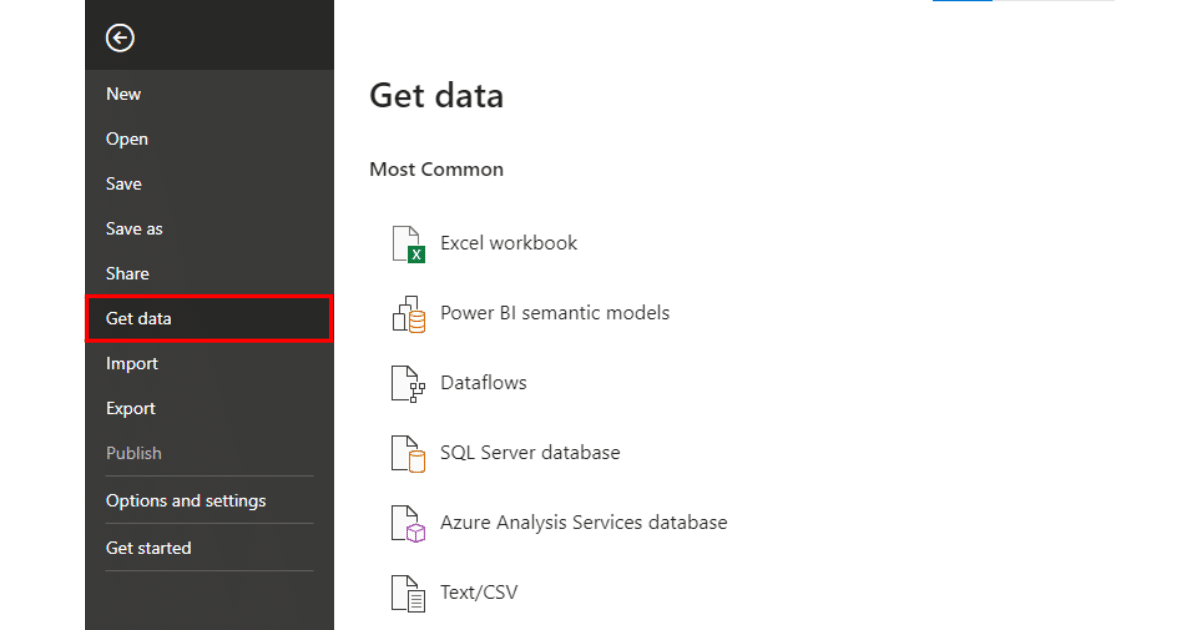
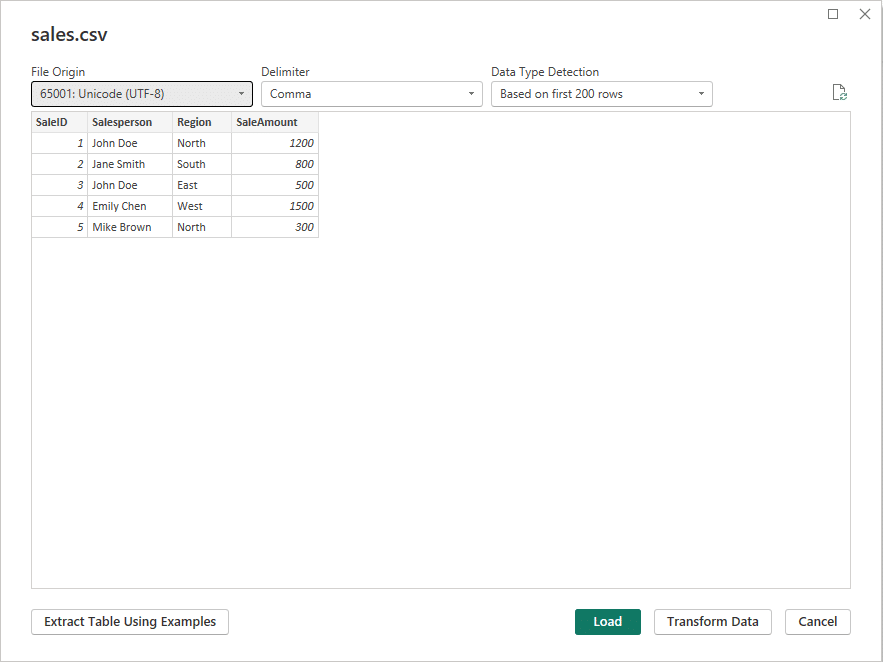
Once connected, Power BI will show you the dataset pane. Click Load to load the dataset.
Step 2: Apply Switch True Logic
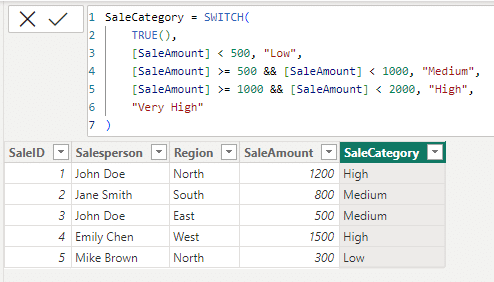
Let’s say we want to categorize each sale based on the SaleAmount. We can use the switch true logic to create a new column that classifies each sale as “Low”, “Medium”, “High”, or “Very High”.
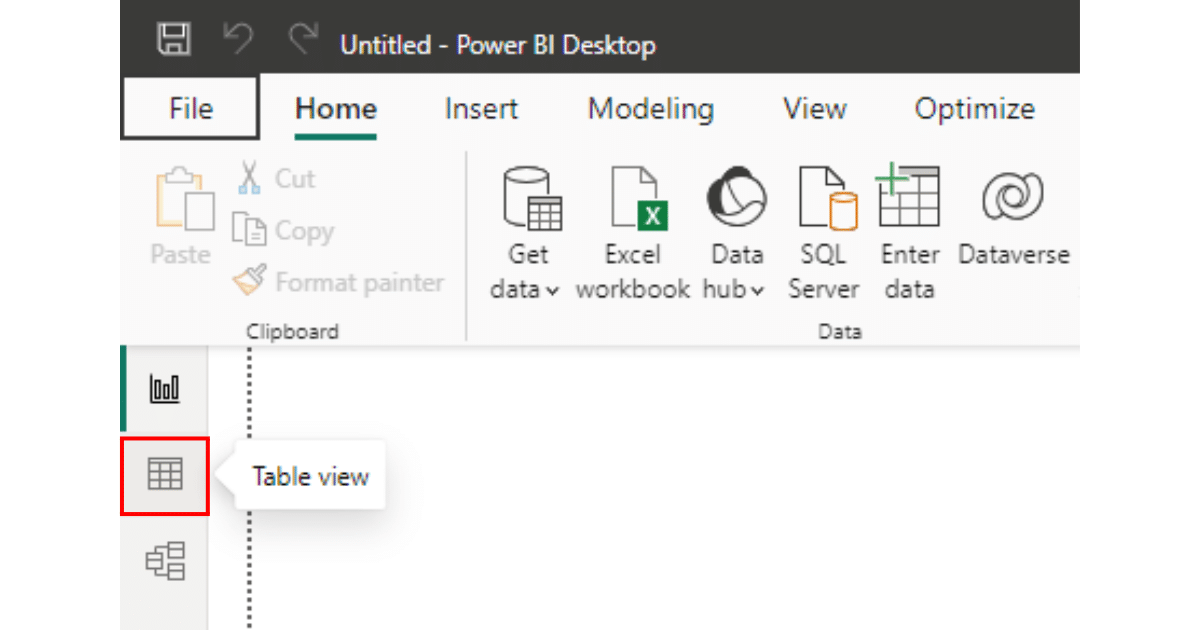
In Power BI Desktop, go to the “Data” view by clicking on the table icon on the left side.
With your sales table selected, go to the “Modeling” tab and click on “New Column”.
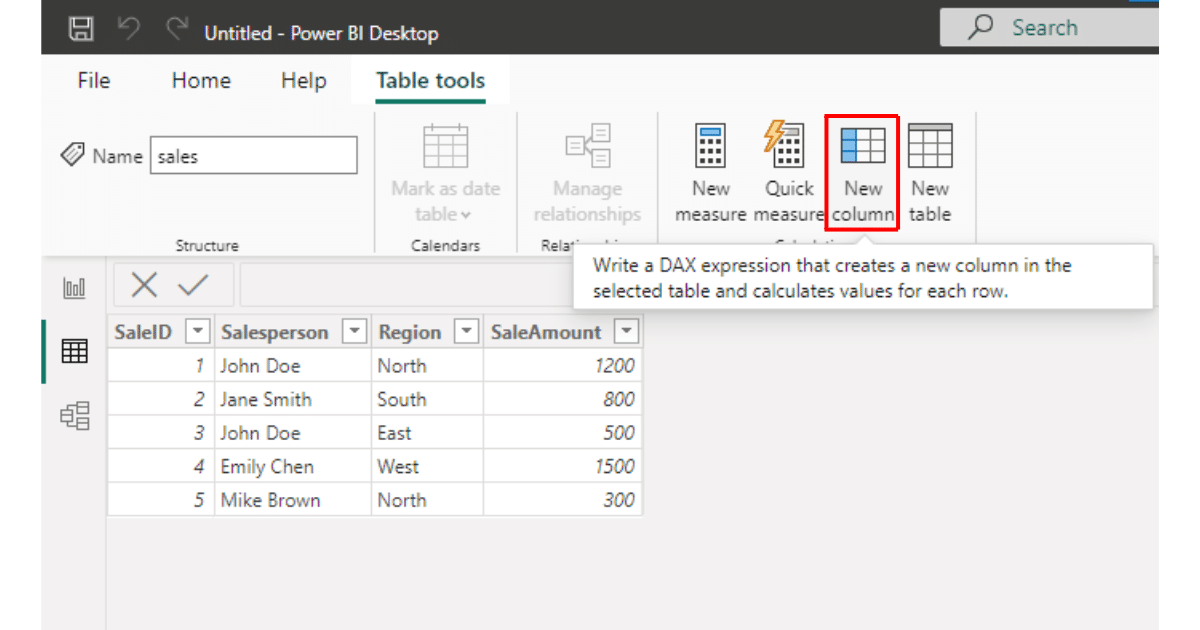
In the formula bar, enter the DAX formula using switch true logic.
For the current scenario, our DAX formula will be:
SaleCategory = SWITCH(
    TRUE(),
    [SaleAmount] = 500 && [SaleAmount] = 1000 && [SaleAmount] < 2000, "High",
    "Very High"
)
This formula creates a new column named SaleCategory where each sale is categorized based on its amount.
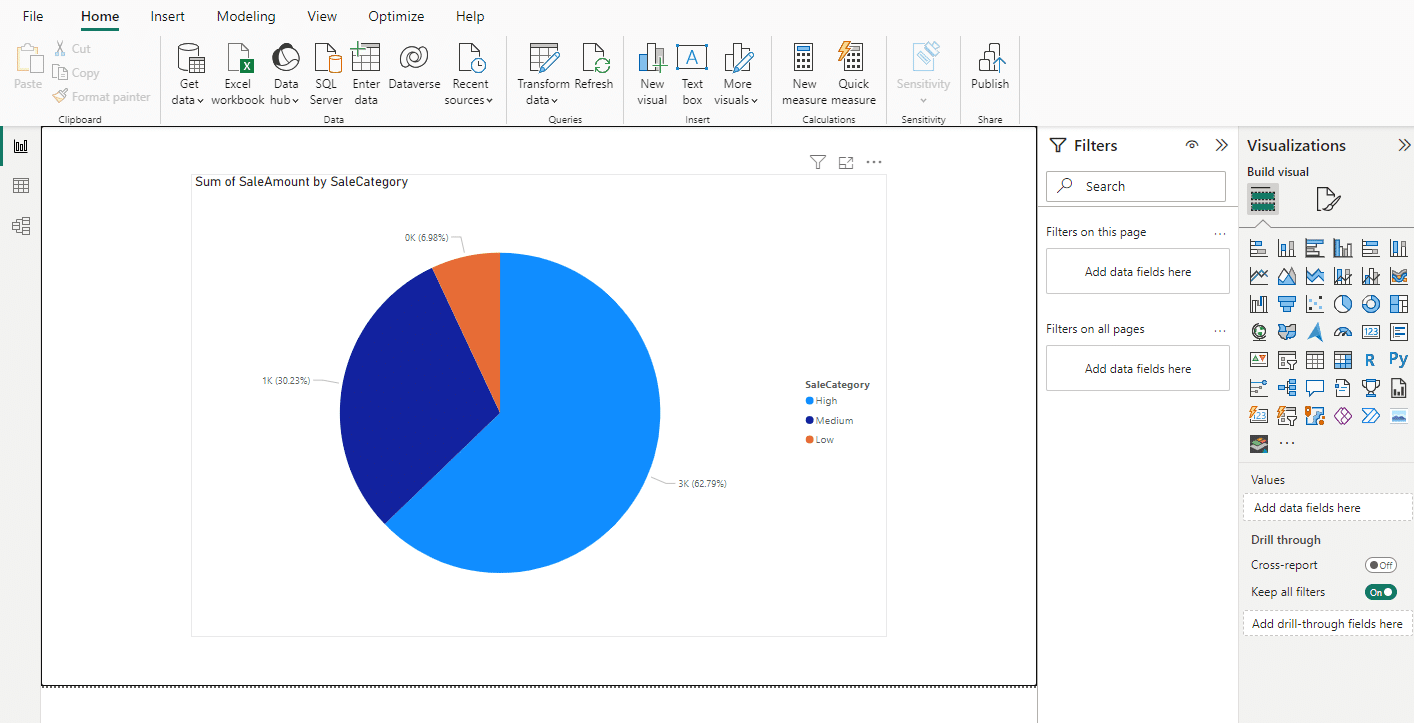
You can now drag the SaleCategory field into your reports and visuals, such as bar charts, pie charts, or tables, to analyze the data based on these categories and tell a more informed data story.
4 Common Use Cases for Switch True Logic in Power BI
The Switch True logic function in Power BI is a versatile tool that can be applied in various scenarios.
In this section, you will learn the 4 most common use cases for switch true logic in Power BI.


1. Creating Calculated Columns
One common use case of the Switch True logic function in Power BI is creating calculated columns.
In the Data View of your Power BI Desktop, you can use Switch True to create new columns that evaluate multiple conditions and return the appropriate result.
An example of this use case is demonstrated in the steps above.
2. Applying Conditional Formatting
The Switch True logic function can also be used to apply conditional formatting to your visualizations. By using Switch True in the conditional formatting rules, you can dynamically change the appearance of your visuals based on specific conditions.
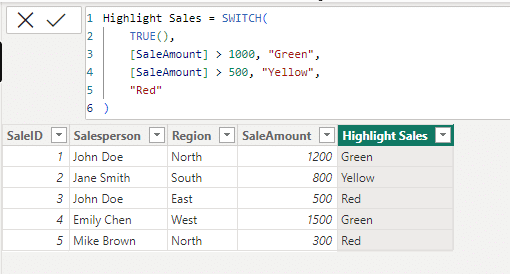
For example, if you have a sales report and want to highlight sales that are above a certain threshold, you can use the following DAX expression in the conditional formatting rules for the sales amount:
Highlight Sales = SWITCH(
    TRUE(),
    [SaleAmount] > 1000, "Green",
    [SaleAmount] > 500, "Yellow",
    "Red"
)
This will create a new column that you can use when applying conditional formatting.
3. Custom Sorting in Visuals
Another useful application of the Switch True logic function is custom sorting in your visuals.
By using Switch True in the sort-by-column option, you can create custom sort orders based on multiple conditions.
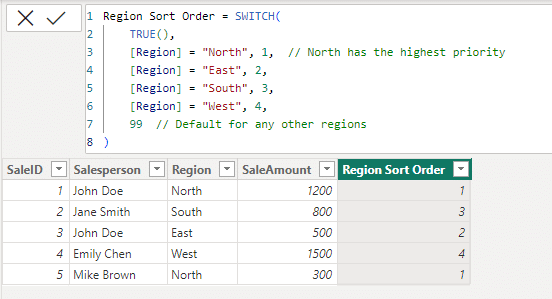
Suppose we want to create a custom sort order for the Region column in a visual. Let’s say our hierarchy for sorting is North, East, South, and then West.
The DAX expression will be:
Region Sort Order = SWITCH(
    TRUE(),
    [Region] = "North", 1,  // North has the highest priority
    [Region] = "East", 2,
    [Region] = "South", 3,
    [Region] = "West", 4,
    99  // Default for any other regions
)
This will generate a new column indicating the sort order.
You can use this column to sort your visuals and tables.
4. Dynamic Measures
The Switch True logic function can be used to create dynamic measures that change based on user input or other conditions.
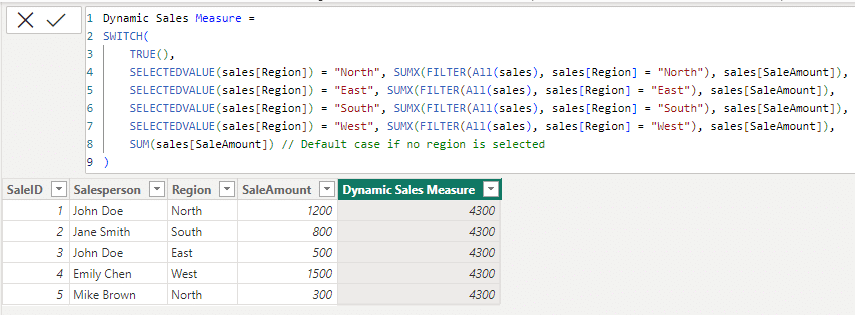
Suppose you want to create a dynamic measure that calculates different total sales values based on the region selected by the user.
The DAX expression will be:
Dynamic Sales Measure =
SWITCH(
    TRUE(),
    SELECTEDVALUE(Region) = "North", SUMX(FILTER(All(SalesData), SalesData[Region] = "North"), SalesData[SaleAmount]),
    SELECTEDVALUE(Region) = "East", SUMX(FILTER(All(SalesData), SalesData[Region] = "East"), SalesData[SaleAmount]),
    SELECTEDVALUE(Region) = "South", SUMX(FILTER(All(SalesData), SalesData[Region] = "South"), SalesData[SaleAmount]),
    SELECTEDVALUE(Region) = "West", SUMX(FILTER(All(SalesData), SalesData[Region] = "West"), SalesData[SaleAmount]),
    SUM(SalesData[SaleAmount]) // Default case if no region is selected
)
In this formula, SalesData is the name of your sales table. Region and SaleAmount are columns in your sales data. The measure calculates the total sales for the selected region. If no region is selected, it defaults to the total sales across all regions.
This creates a dynamic field in your table that when used in a visualization, allows users to interact with. You can use this especially when you want a dynamic report created.
These are just a few examples of how you can use the Switch True logic function in Power BI. The possibilities are endless, and with a little creativity, you can find many more ways to apply this powerful tool to your data analysis tasks.
Learn Power Query for Power BI by watching the following video:
Final Thoughts
The Switch True logical functions in Power BI is a powerful and versatile tool that allows you to evaluate multiple conditions and return the appropriate result. Whether you’re categorizing data, applying conditional formatting, or creating dynamic measures, Switch True can help you make your reports and visualizations more insightful and interactive.

Understanding the basics of Switch True syntax and its practical applications can significantly enhance your data analysis capabilities. This will help you build more efficient and reliable reports, enabling you to tell better data stories.
Frequently Asked Questions
In this section, you will find some frequently asked questions you may have when using switch true logic in Power BI.

What is the difference between the SWITCH and SWITCH TRUE functions in Power BI?
The Switch function evaluates an expression and returns a result based on a specific condition.
The Switch True function, on the other hand, evaluates multiple expressions and returns a result based on the first true condition.
Can I use the Switch True function in the Power Query Editor?
Yes, you can use the Switch True function in the Power Query Editor. To do this, you can create a new custom column or transform an existing column using the M language.
Is it possible to use the Switch True function within a calculated table in Power BI?
Yes, you can use the Switch True function within a calculated table in Power BI. This function allows you to create a table that meets specific conditions or logical value.
How can I use the Switch True function with multiple conditions?
To use the Power BI Switch True function with multiple conditions, you can include several pairs of conditions and results within the function.
Power BI will evaluate conditions like logical operators in the order you specify and return the result for the first true condition.
What are some practical examples of using the Switch True function?
Some practical examples of using the Switch True function include categorizing data table based on multiple conditions, creating custom sorting orders for visuals, applying conditional formatting, and creating dynamic measures.


