In this article, I am going to give you an overview of simple filters in Power BI.
We have already done a few examples regarding this so it should not be too difficult to pick up.
I am doing these demonstrations in tables for a good reason. It is easier to understand how formulas work when you see the numbers since looking at visuals can sometimes be confusing. You may watch the full video of this tutorial at the bottom of this blog.
Proper Usage Of Simple Filters
For example, in this Sales in NC measure, you do not have to use a FILTER function to generate a result.
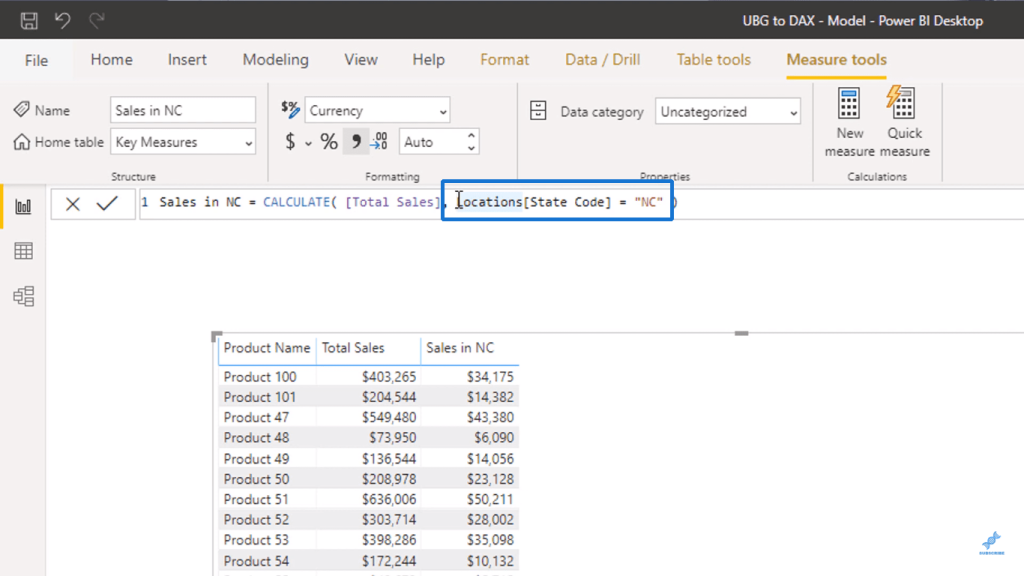
This is because inside the CALCULATE function, the formula can already pick up what table you are referencing through the relationships in your model.
To show another example, I will create another measure called Sales in 2019.
I will use CALCULATE with Total Sales as the expression, put in the Year column of the Date table to serve as a simple filter, set it equal to “2019”, and then drag in our new measure.
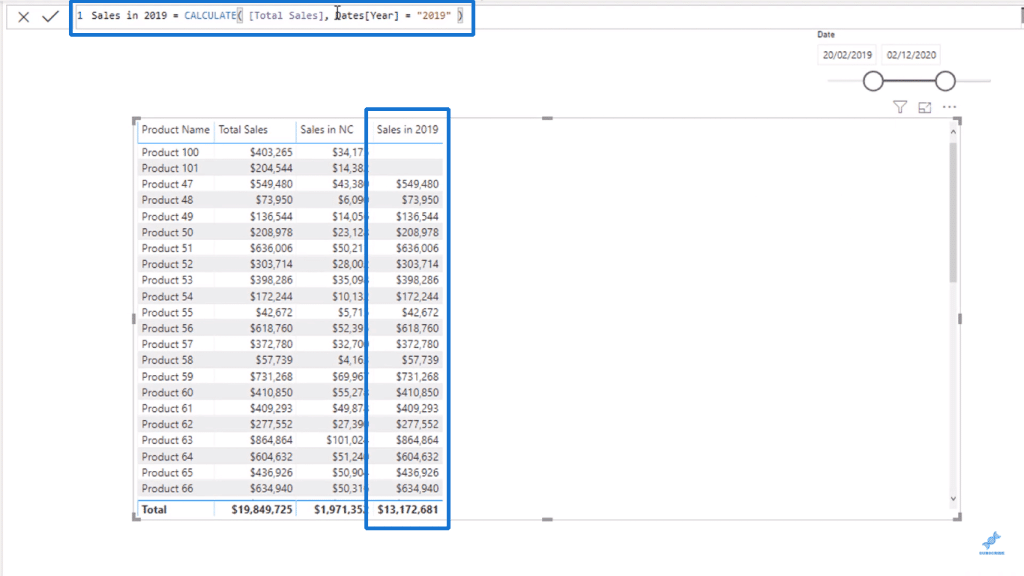
It is best practice to always use a FILTER function to do these simple filters since you can run into trouble if you do not.
To show an example of how it can go wrong, I will create a new measure called Sales of Product 100 to look at the sales of just one product.
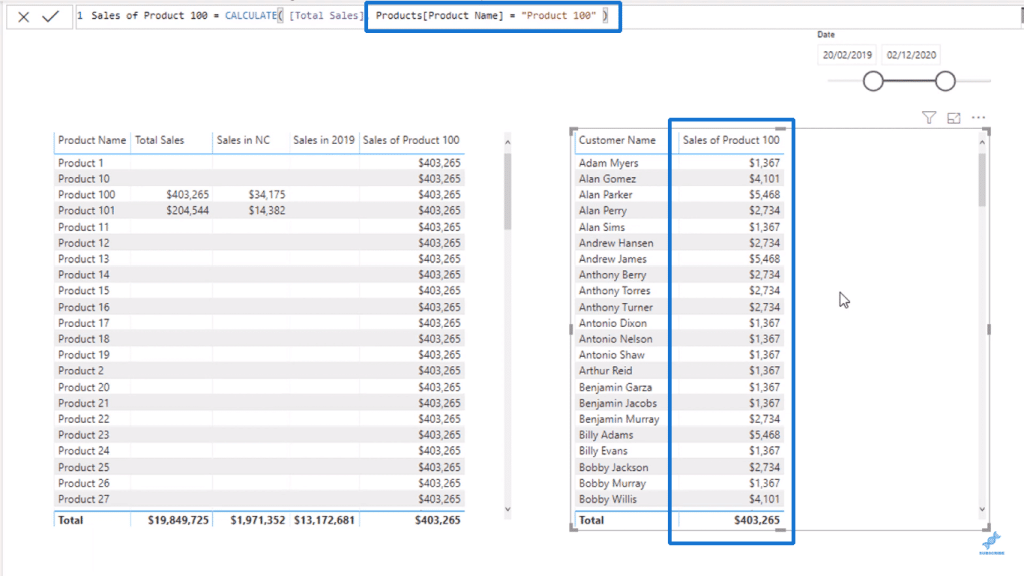
I will use CALCULATE again and use Total Sales as the expression. Then, I will insert my Product Name column from the Products table, set it equal to “Product 100”, and drag in the measure.
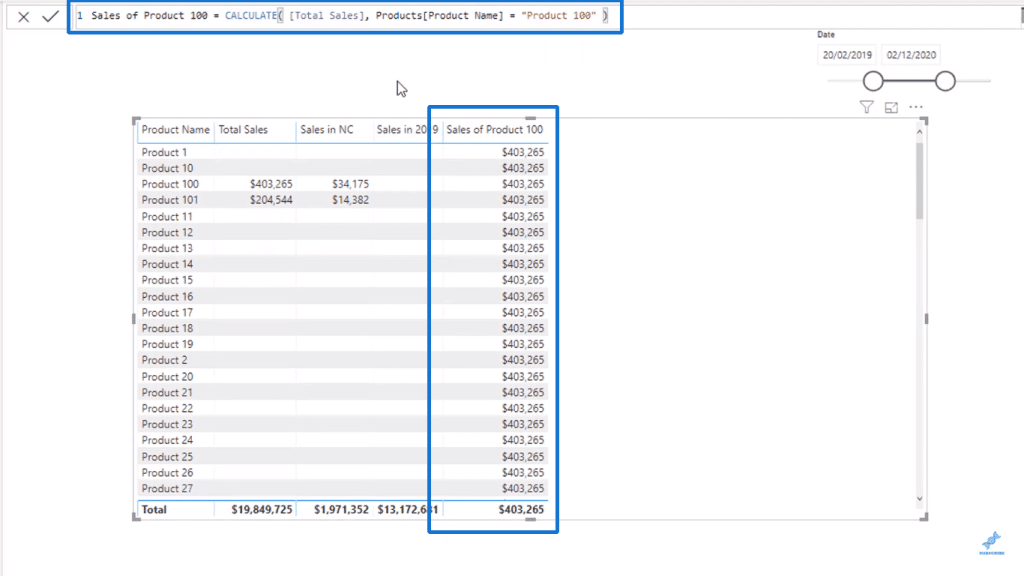
Because of its initial context, the measure puts the Sales of Product 100 in every single row.
The CALCULATE function cannot differentiate based on the simple filter that we used since the Product Name column is in a table.
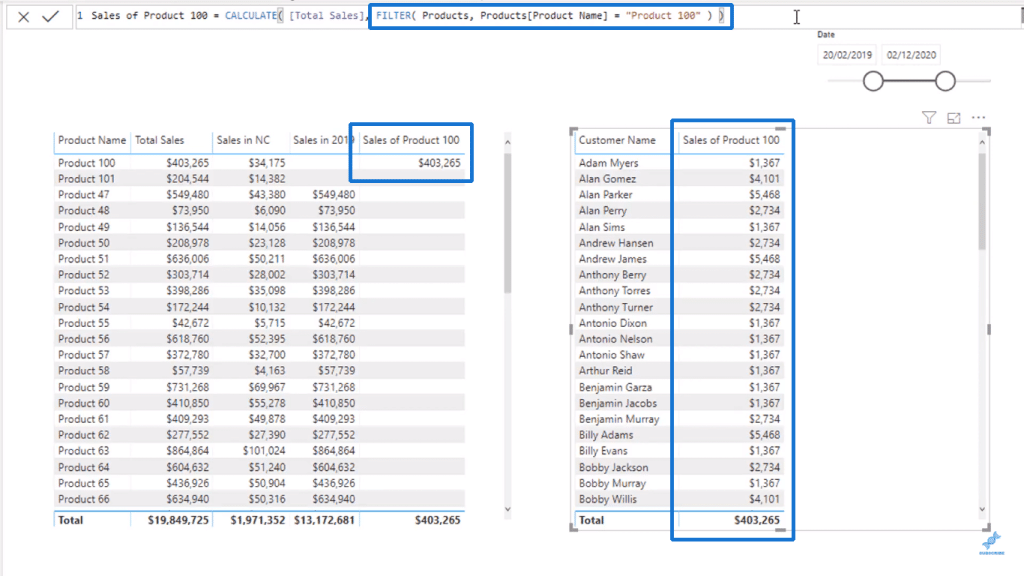
To fix this, you need to use the FILTER function and put it in the Products table.
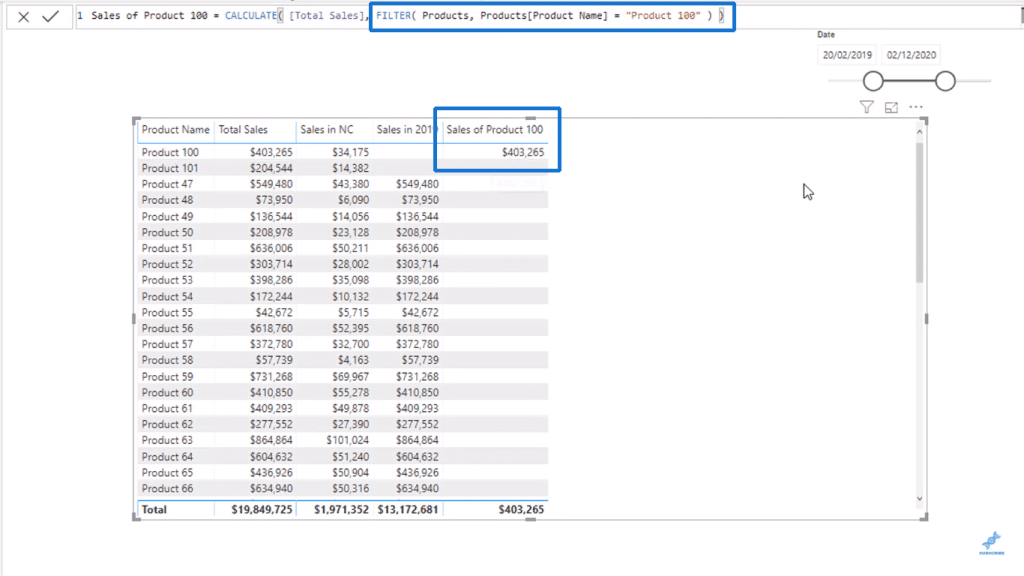
As you can see, we finally got the value we needed just for Product 100.
The tricky thing here is that you get different results based on the different contexts that you have.
For example, if I use the Customer Name as my context and change back the simple filter without the FILTER function, the result is displayed normally.
The reason why I always default to using the FILTER function is because it would always work for both cases.
To avoid confusion, you should always use the FILTER function as best practice.
***** Related Links *****
Introduction To Filter Context In Power BI
Filtering Data By Custom Fiscal Years And Quarters Using Calculated Columns In Power BI
Using Filter Fields And Visual Interactions To Create Compelling Visualizations In Power BI
Conclusion
In this post, we talked about simple filters in Power BI and the best practices regarding their usage.
We also determined how these filters relate to the CALCULATE function and context in general.
Next, we will be covering table functions like FILTER, when you might use them, and how they work within Power BI.
All the best,
Sam


