In today’s blog post, I’ll go over the process of how I choose my color scheme for my Power BI reports. You may watch the full video of this tutorial at the bottom of this blog.
This is one of my recent entries for the Power BI Challenges going on right now at the Enterprise DNA website. Make sure to check that out whenever you can.
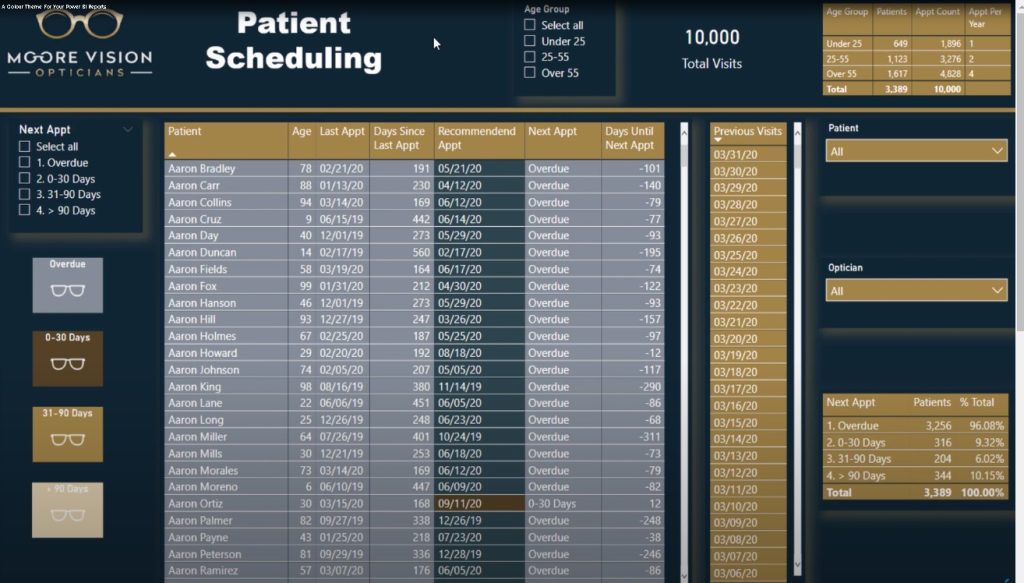
I’ll show you how I chose my color scheme for this entry. The first thing I usually do is go to Google and do a search for a theme of the report that I’ll be doing. In this case, we were given a data set for a vision company, so I went on Google and searched for optician company logos.
I found this logo of a company called Moore Vision opticians. I liked the color scheme that was involved in their image.
Once I have an image, I go over to the Analyst Hub on the Enterprise DNA website. You can see there are different options on how you can choose colors for your theme.
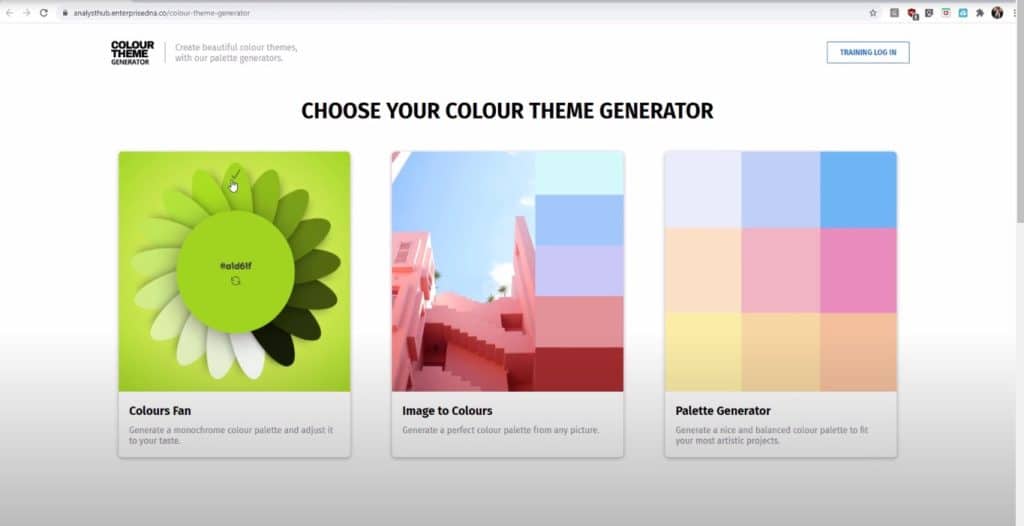
But since I saved a photo, I’ll choose the Image to Colours option. Then I’ll click the Upload Your Image button and select the vision logo.
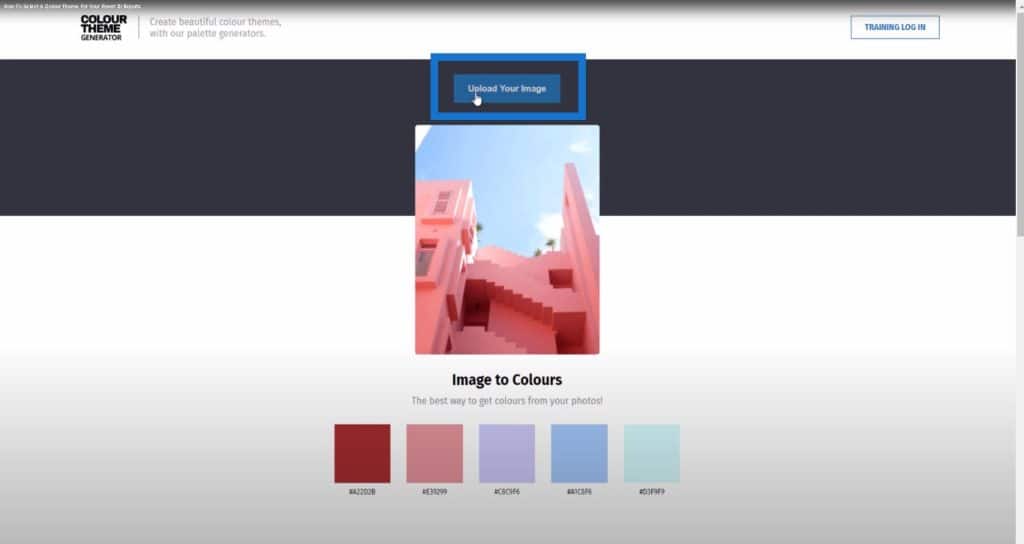
Once that image appears on the screen, I’ll review some of the colors at the bottom.
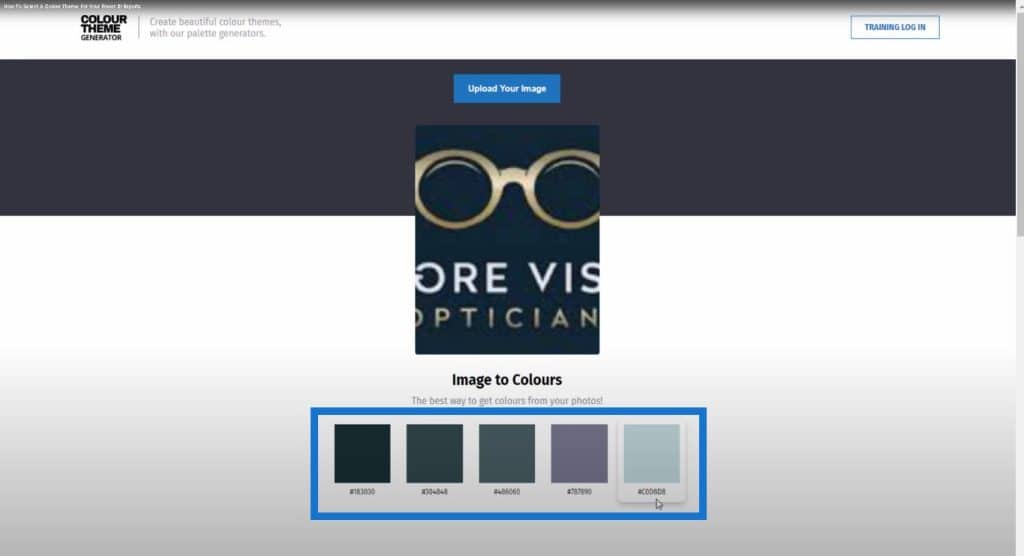
If I can’t use any of these colors, I go to other sites to choose my themes like imagepicker.com. This is very similar to the one that’s on the Enterprise DNA website.

I’ll click on the green Upload your image button at the bottom of the page and then select on my logo. Once the image loads, the site gives you a bunch of color palette schemes at the bottom.
What I like about this website is if you click on any part of the picture, it will give you the hex code or RGB code.

This is what I use to help generate a JSON theme that I’m going to upload into my Power BI report.
I’ll browse through the colors below the image. I’ll select the ones I’ll use to copy their hex codes and put them in a Word file.
I’ll copy these hex codes and go over to themes.power bi.tips, which is a themes generator page. All you have to do is enter the hex codes there and the site will auto-generate a JSON theme.
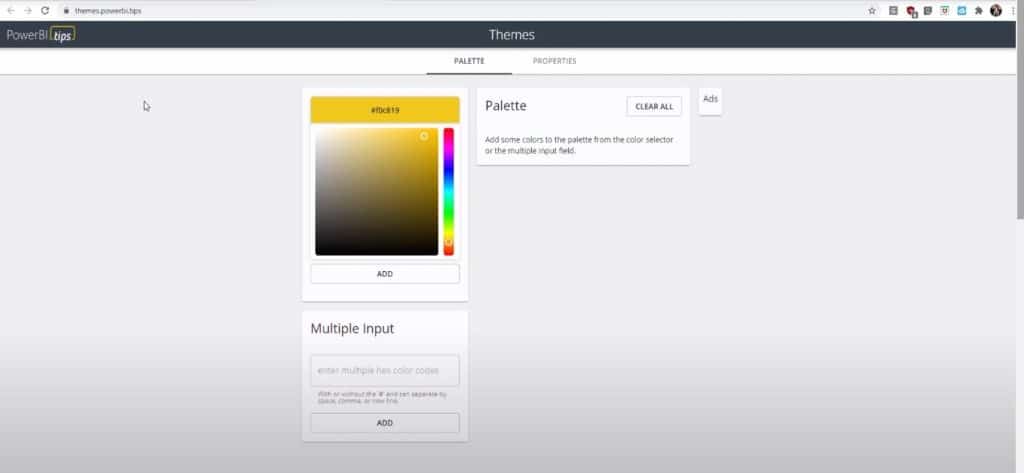
I’ll paste the hex codes here and click on the ADD button.

This will give you a preview of all the colors that you can add or remove.

Then I’ll click on Download your theme, name it, then save it to the appropriate folder on my computer.

This is what the JSON theme file looks like if you were to open it up on your computer.

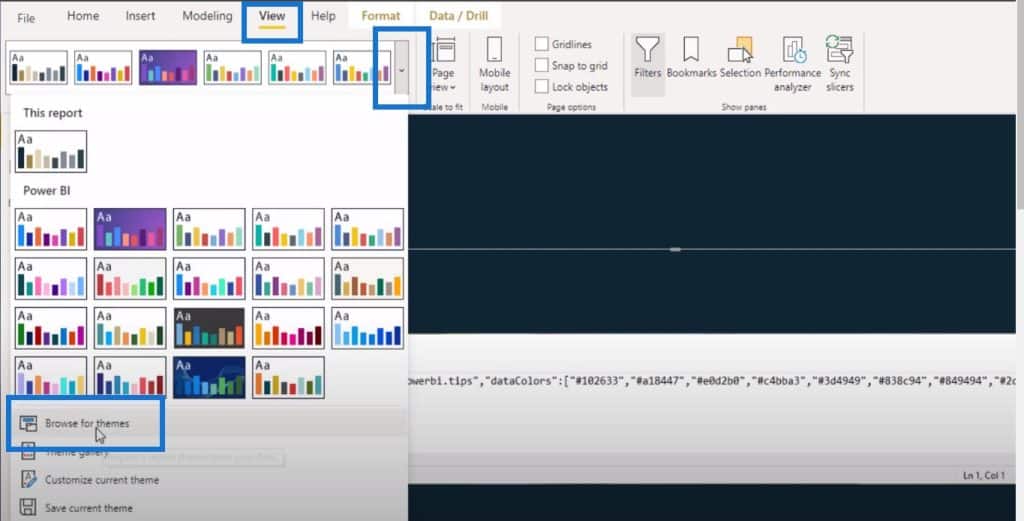
Once I have this saved, I’ll click on the View tab in Power BI, click on the down arrow, and then click on Browse for themes to select the JSON theme that we just created.
I will then go back to my report page and click on one of these slicers.
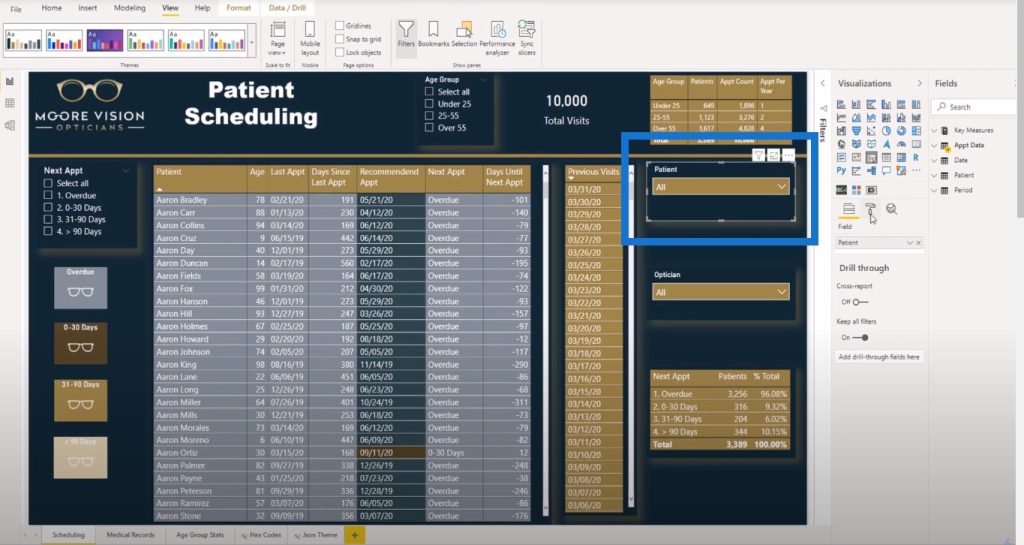
Then click on the Formatting pane, open up the background color, and then we can see all of the Power BI color themes that was just downloaded from the JSON theme.

Conclusion
These are the colors that were incorporated into this report page. For more tips on how you can format your report page, make sure to subscribe to the Enterprise DNA YouTube channel if you haven’t done so already.
All the best,
Jarrett
[youtube https://www.youtube.com/watch?v=4gKm-AF1fdo?rel=0&w=784&h=441]
***** Related Links *****
How To Control The Interactions Of Your Visuals In Power BI
Custom Conditional Formatting Techniques In Power BI
Using Filter Fields & Visual Interactions To Create Compelling Visualizations In Power BI
***** Related Course Modules *****
Data Visualization Tips
Dashboarding & Data Visualization Intensive
Mastering DAX Calculations
***** Related Support Forum Posts *****
Power BI Challenge 5 – Optical Data From Jarrett
What Layout/Schemes Do You Like Using?
Choose A Different Color
For more visual technique queries to review see here…..


