
In this blog, I am introducing Power BI cohort analysis. This was one of the topics that I went through in detail in a Learning Summit, where I demonstrated what cohort analysis is and how you can do it in Power BI. In this tutorial, you will learn how to set it up inside your Power BI model. You may watch the full video of this tutorial at the bottom of this blog.
The idea around cohort analysis is that we group our customers based on a particular behavior or attribute that they have.
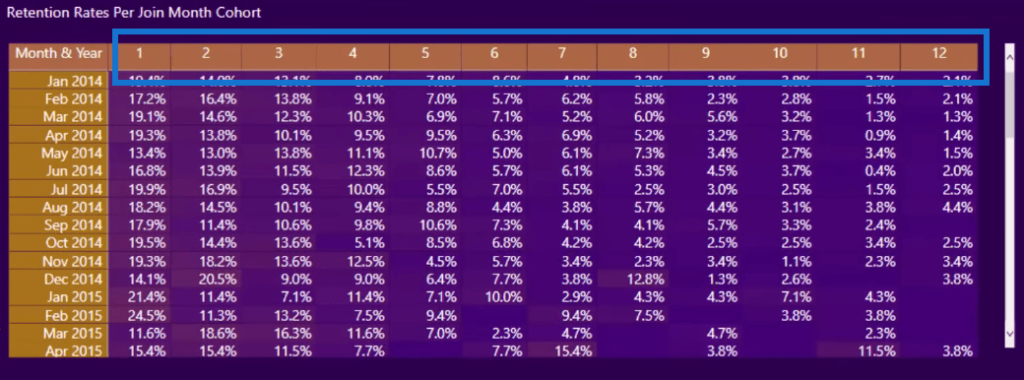
In this example, we’re grouping our customers based on when they first initially purchased, and then we’re going to analyze the retention rate of those customers.
So the idea is to create a cohort of when the customers first purchase and then analyzed through time how long it takes for them to come and purchase again. We then compare all the customers in our cohort of all the months and see whether the retention levels improve or reduce.

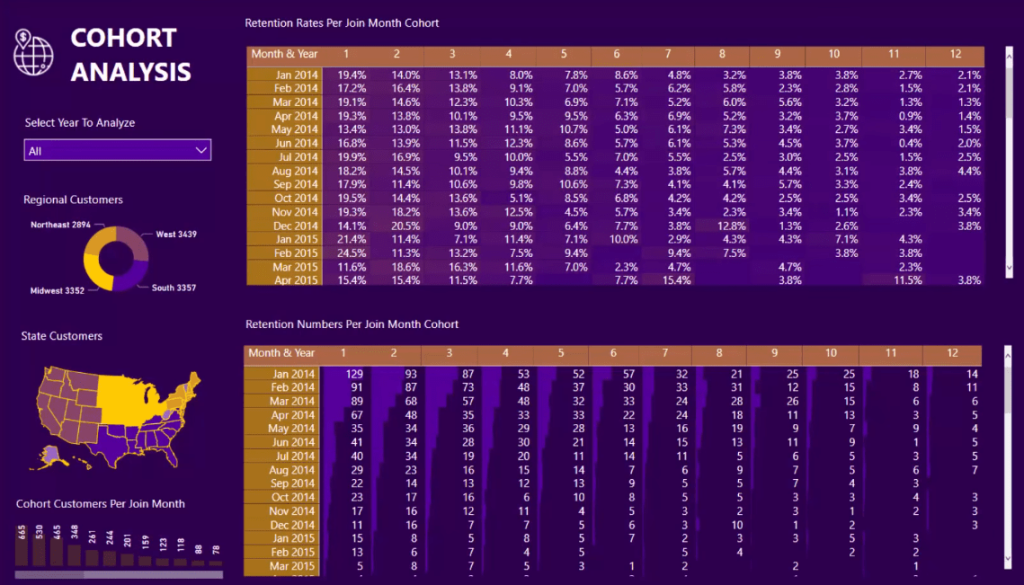
In this demonstration, we have percentages, which is a good way of looking at it, but we also have absolute numbers as well.
Classifying Customer Purchases
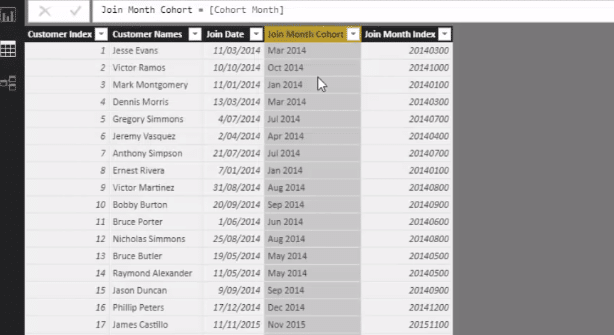
If you think about cohort by itself, it means “grouping of customers”. So here we work out when the customer joined or when they first purchased from us. This is what we’re classifying as the Join Date.
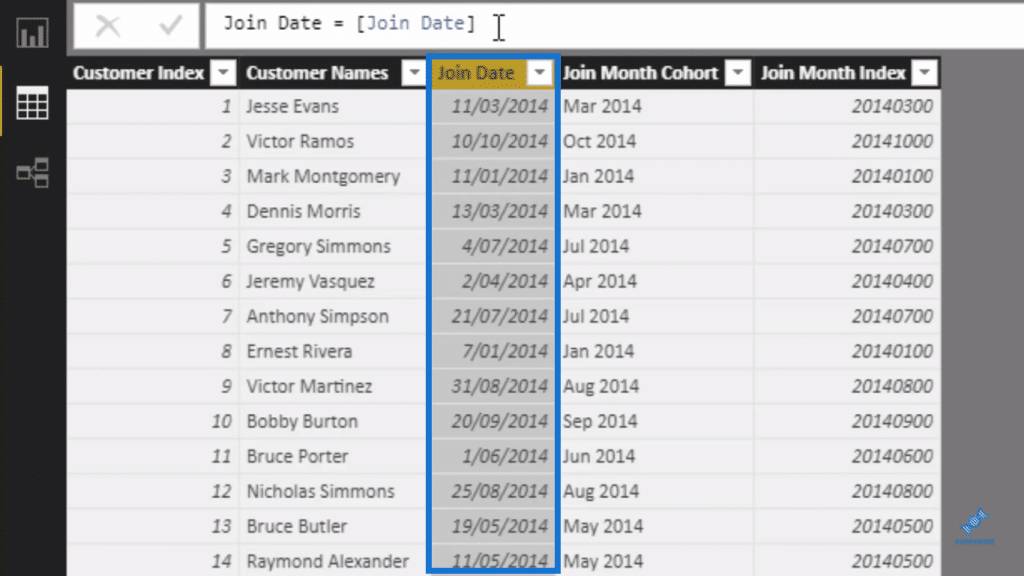
The Join Date formula is just the Min Purchase Date in the Sales table. So we’re working out the minimum or the lowest date that any of these customers at each different row has purchased.
Then we classified them in their particular cohort based on what month and year they have purchased.
For example, Jesse Evans here purchased on March 11, 2014, so customers like Evans will be in the March 2014 cohort.
DAX Formulas For Cohort Analysis
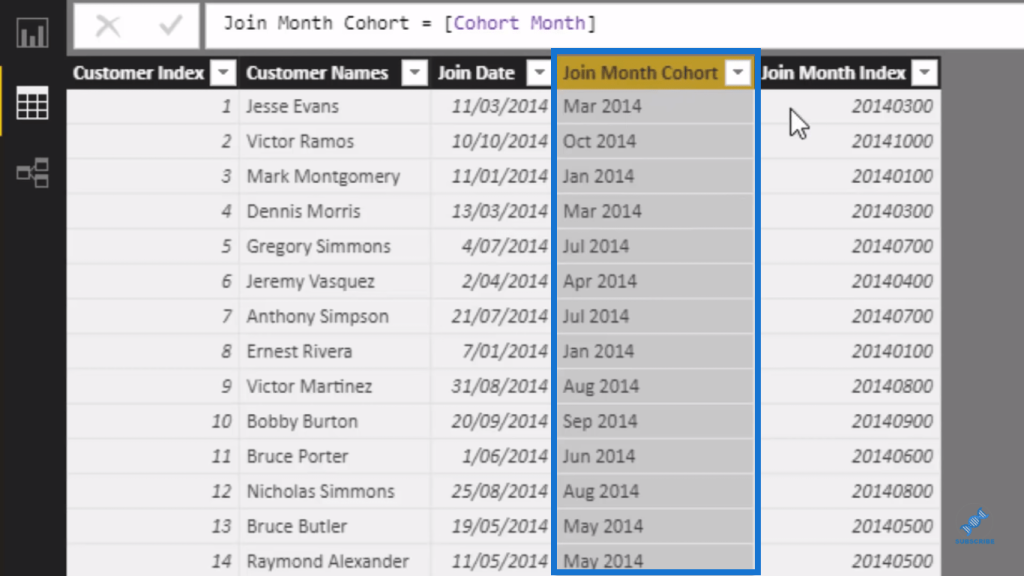
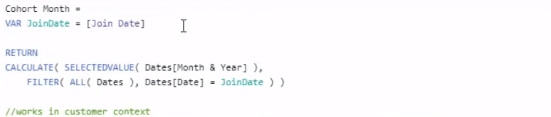
The formulas we use here are very simple. The Join Date is just the MIN of the Order Date (Sales).


The Cohort Month is basically finding out the month of that Join Date.
And then, we bring them here.
We can create a cohort on many different variables. This is just one real world example of retention rates.
Classifying Time Frames
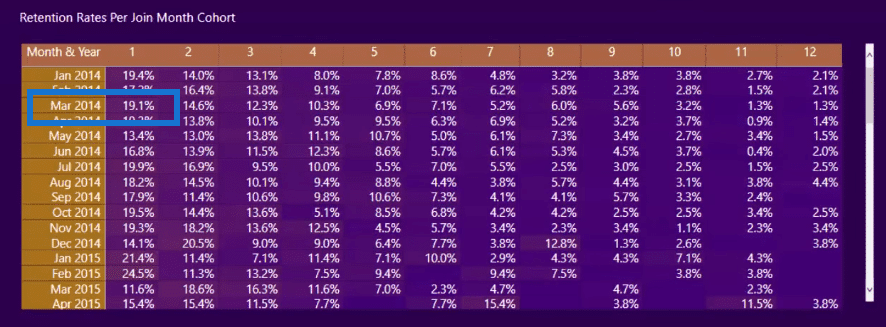
The other thing to classify is the time periods. These are just generic (1, 2, 3, etc.), but we need to create some generic time periods to compare all these cohorts (Jan 2014, Feb 2014, etc.) because they’re all in different time frames. We need to do a like-for-like comparison of all these cohorts over different time periods.
So this is how we set it up if we’re doing this sort of analysis. We have Period 1 to 12, and we’re capturing Min Days and Max Days.
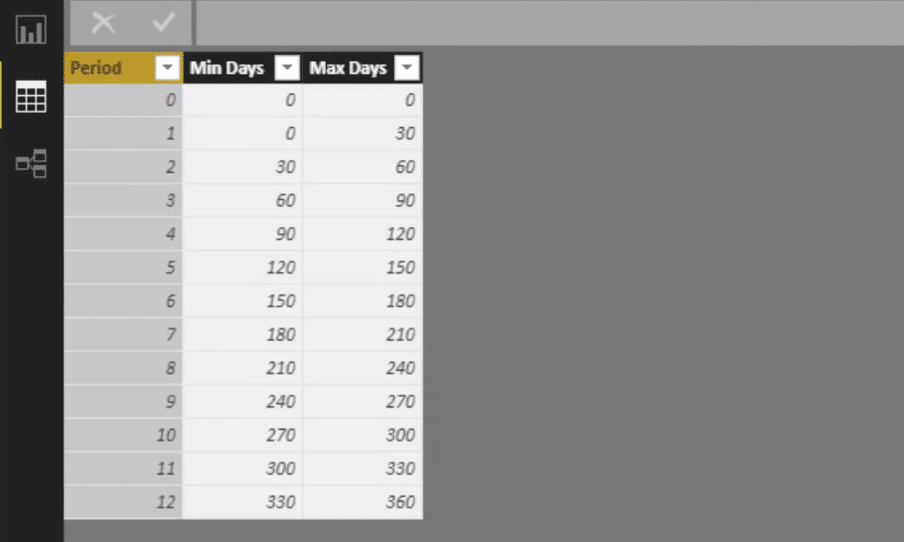
For instance, if a customer purchased from us and then purchased back again within the first 30 days, that customer would be classified as the first retention period (Period 1). If the customer purchased from us again between 120 and 150 days, that customer is in Period 5, and so on.
We see that this is being completed across all our Cohorts even though these customers are making their initial purchase at a later time. We then compare our cohort on a like-for-like basis all the way back to January 2014 by utilizing the complex combination of calculations.
***** Related Links*****
Time Based Cohort Analysis – How To Setup Your Data Model In Power BI
Customer Analysis In Power BI: Reviewing Performance Over Time
Customer Segmentation Techniques Using The Data Model – Power BI & DAX
Conclusion
In the Learning Summit I dove much further into how exactly you can generate your formulas to be able to do this, but I thought that this would be a good introduction. Many of you probably even haven’t heard of cohort analysis.
This is quite an advanced analytical technique, but I wanted to give you a primer of what cohort analysis is and show you how we can figure this out in Power BI. We can also do it in a very dynamic and effective way where we can integrate it into our model.
I’ve seen this analysis done in Excel and some other advanced tools, but we can do it in Power Bi and make it even better and more efficient. Check out the links below for more Power BI resources around this topic.
Cheers!
Sam
***** Learning Power BI? *****
FREE COURSE – Ultimate Beginners Guide To Power BI
FREE COURSE – Ultimate Beginners Guide To DAX
FREE – 60 Page DAX Reference Guide Download
FREE – Power BI Resources
Enterprise DNA Membership
Enterprise DNA Online
Enterprise DNA Events


