Today, I want to show you a group of free resources for both Enterprise DNA members and non-members that I think you’ll find incredibly useful. You can also find a useful tool for producing random dataset in this collection of resources. You can watch the full video of this tutorial at the bottom of this blog.

What’s Inside The Ultimate Power BI Resource Collection
Within this resource, I want to demonstrate in particular the Data Randomizer, which is a tool that I think even our members are not aware of.
One of the things we’ve done to make it easy for everybody is we’ve grouped these resources together into this collection so you don’t have to download each of them individually. If you’re a member, you’ll be able to jump right into it. If not, it will just ask for your email and then provide you a link to where you can download all the resources.
This resource collection has a wide variety of useful stuff. We have a DAX formulas reference guide and another guide to optimizing DAX.
There’s also an extended date table developed by one of our experts, Melissa de Korte. It’s an amazingly comprehensive and powerful date table for Power BI. We also have a cheat sheet for how you can use this extended date table.

This cheat sheet is a quick guide to the example values for each field, the data types, and how you can sort each field in Power BI.
We also have another grouping for top-notch Power BI reports which you can go through and download to see how those were put together.

We also have a series of deployment, implementation, and licensing planner resources.
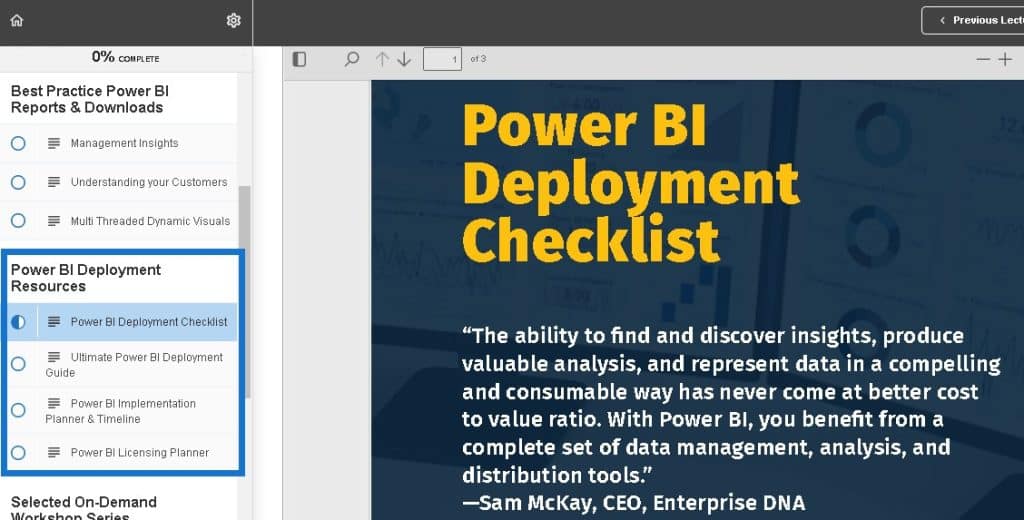
We also have a whole series of course work on a beginner’s guide to Power BI and DAX. This alone is about six hours of course work.

You will also get three of our most popular workshop series. They’re about advanced budgeting, effective Power BI reporting, and detecting and analyzing outliers. I think you can become quite competent in Power BI just by using the resources in this package.

But the thing I want to highlight from this collection is something called the Power BI Data Randomizer. Just go to the resource collection and download this xlsb file.

Where To Use The Data Randomizer
Go to Downloads and then open the file in Excel. This is great for creating a random dataset, which can be used in different ways. For example, members of the Enterprise DNA forum (or in any other forum) use an example PBIX file if their information is confidential and can be very difficult to mask.
So what you can do is use this tool to develop a representative data set using random names, random addresses, and random dates but conform to the requirements of your particular data set. This is representative without including any confidential information.
In addition, you may want to develop a data set to test some codes. For example, if you have Power BI calling an R script to test whether a distribution is normal or not, you may want to generate some normal distributions or non-normal distributions to see if the code is working.
This is also good if you teach Power BI and want to create examples for quizzes or tests. You can create it according to any parameters you want.
How The Data Randomizer Works
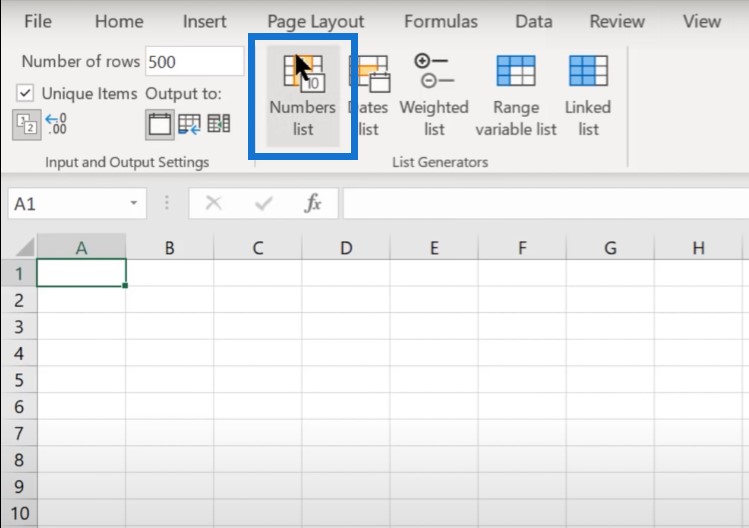
Let’s see how this works. Let’s create an open sheet and call it Test. Then click on RANDOM LISTS, which is an add-in created by the data randomizer.
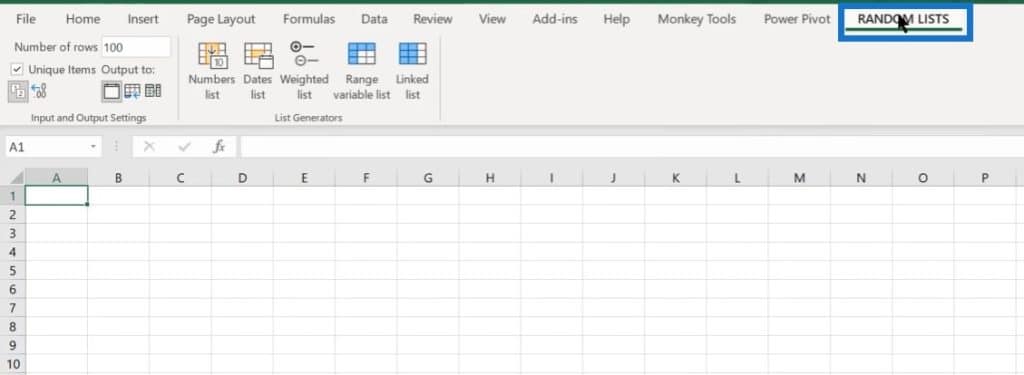
As you can see, it has some simple options and some fairly complex ones. I’ll walk through the simple ones first.
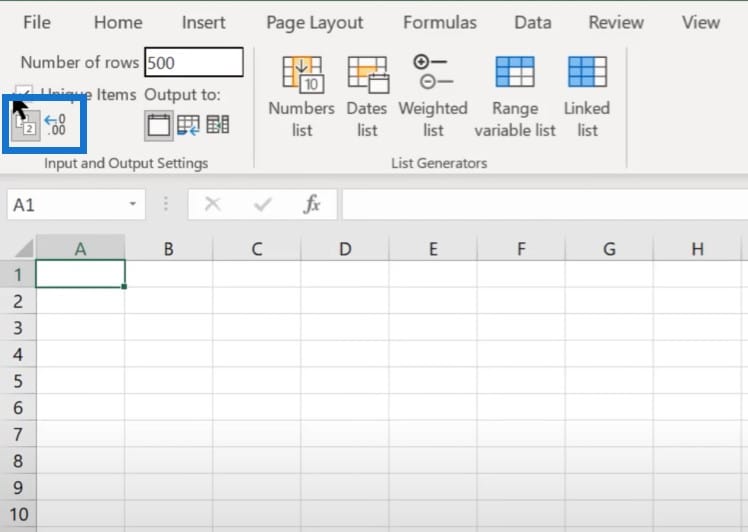
You can just pick the number of rows you want to create. You can also choose whether you want them to be unique or not.
Let’s say we want 500 rows. Since we’re creating a fact table, we’ll untick the box for unique items.

We can create whole numbers or decimals.
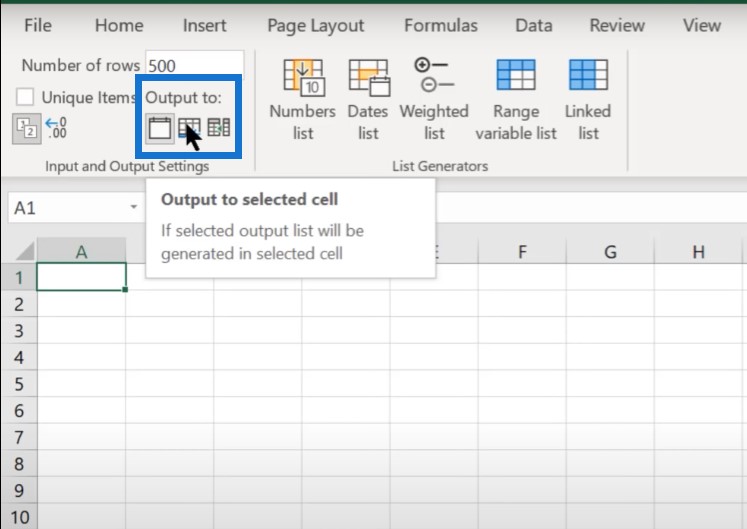
We can also use the output options to output to a particular cell, a new sheet, or the last column and space in the the existing workbook.
So let’s go to Numbers list, enter 0 as minimum, and 1000 as maximum.
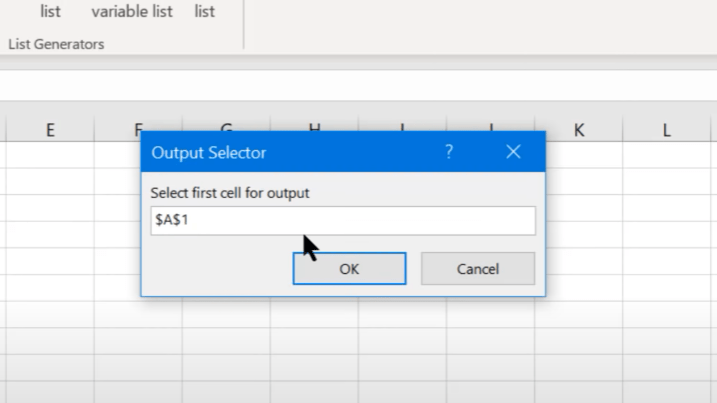
Then let’s put output to A1.
Now we have 500 unique random numbers.

We can do the same thing for dates. Let’s create a Dates list and use the beginning of this year as our START date, and the end of this year as our END date.


We just need to format these numbers into a date format.
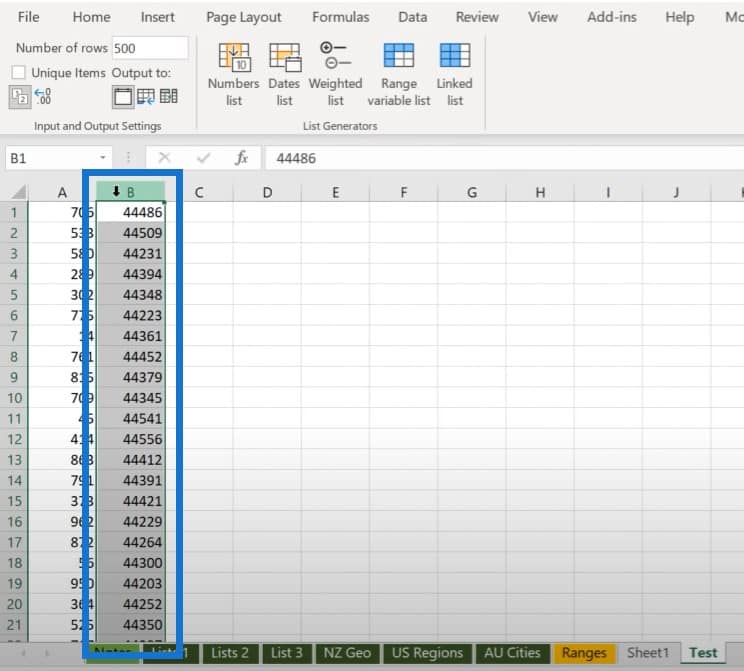

We now have 500 random dates within the bounds of this year.
Note that if we create a numbers list or a dates list, it is going to create a uniform distribution where there is an equal chance of pulling any number within that range.
Creating A Weighted List From A Random Dataset
We can also create a weighted list. This will prompt you for the different segments of the distribution, and how much weight you want to put in each segment.
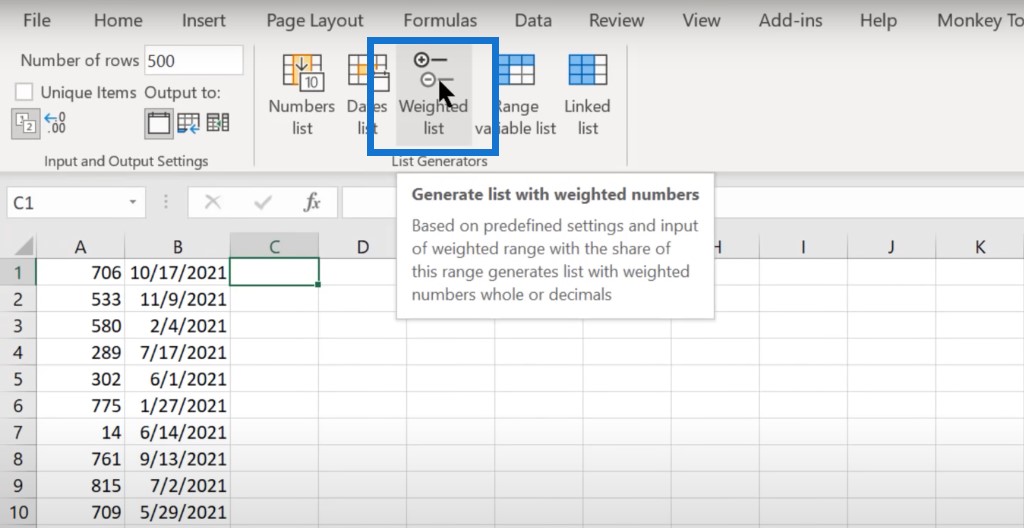
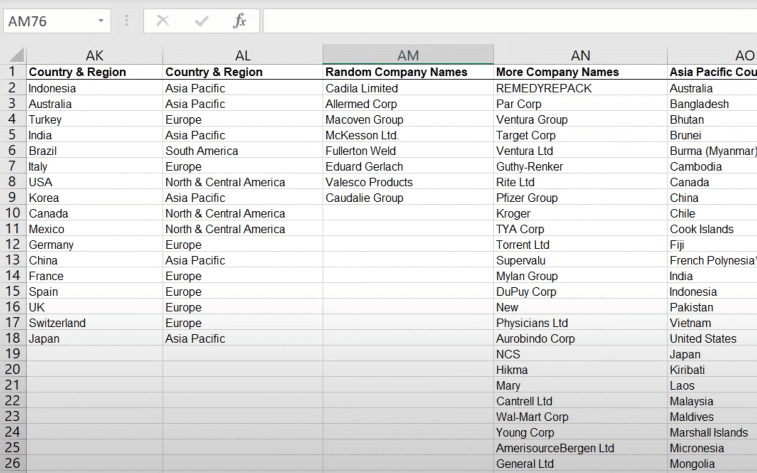
The one feature that is really, really helpful in addition to the ones I’ve showed you is the Linked list. There’s a whole range of dummy data here like names, phone numbers, addresses, email addresses, countries, regions, products, company names, and distribution channels. You can even add your own list to this.
To show you how this works, let’s do a sentiment analysis. Let’s take this list (positive, neutral, and negative) copied over to our Test list.

Let’s pop it in the third column of our created list and then click on Linked list.
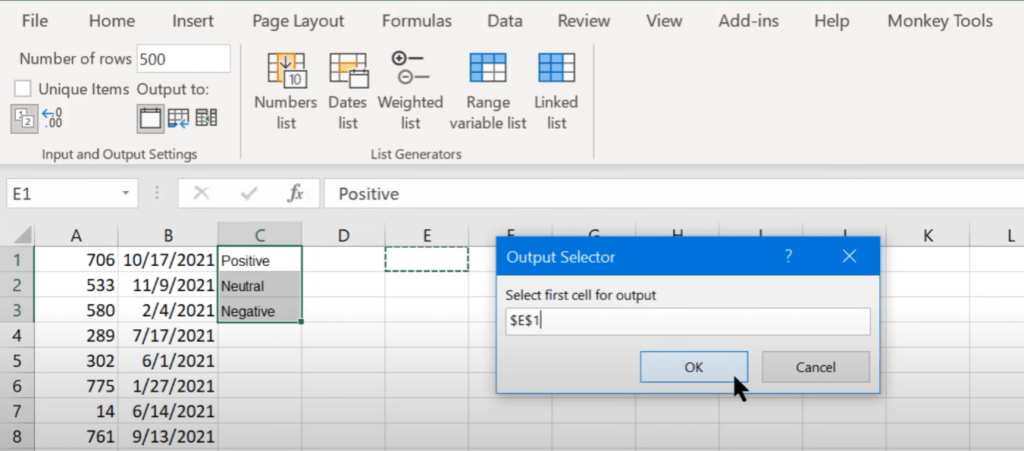
This is going to create 500 sentiments of a uniform distribution based on this list.

One of the things that is great about this is that you can do on-the-fly weighing. Let’s say you want 3x more positive responses than negative or neutral. What you can do is to put two more positives in the column, copy it again, click on Linked list, and put the results in the F column.

This is going to create the same 500 records, but it’s going to create three times the number of positives. You can adapt this to create an on-the-fly weighted list and create any kind of dataset that you want.

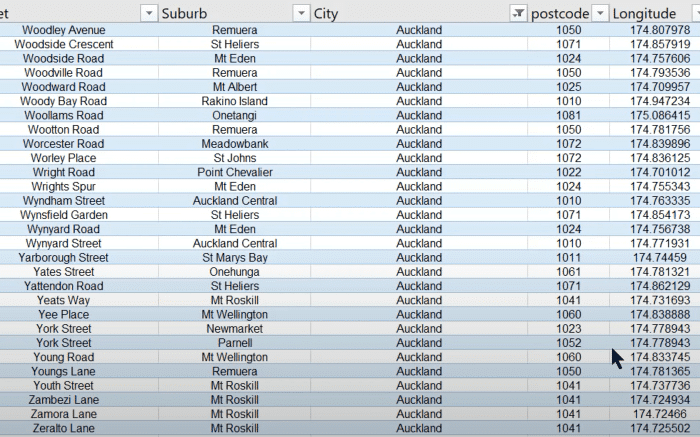
Another thing we have here is geographic data. You can go through postcodes, longitudes, latitudes, and addresses. These can be used to create simulated geographic data.
Creating A Data Model From Your Random Dataset
If you’re trying to create a whole data model through this random dataset tool, you can create just the fact table and then go into Power BI and power query. You can create your dimension tables from the fact table by referencing and pulling out the unique records of your dimensions.
Another way is to build additional sheets with the unique items and basically build those out as your dimension tables. When you import this, you’ll import both the fact and dimension tables, and then join them in Power BI.
***** Related Links *****
Create a Perpetually Updated Practice Dataset in Power BI
Power BI Report Example For An Optical Dataset
Power BI Demo Data For Sample Reports & Apps
Conclusion
The Data Randomizer is really quite simple when it comes to creating a random dataset once you get the hang of it. You can add information to make this customized according to the type of datasets you want to generate.
I really hope you’ll take a look at this Power BI resource collection. Regardless of your expertise level or experience with Power BI, you’ll find something in here that will be incredibly valuable and helpful to you.
If you enjoyed the content covered in this particular tutorial, please don’t forget to subscribe to the Enterprise DNA TV channel, and check out the rest of our website for more learning resources.


