The standard error is a key statistical tool that allows you to assess the accuracy and reliability of your data. But how do you calculate it in Microsoft Excel?
To calculate the standard error in Excel, you can use the formula =STDEV.S(range of data)/SQRT(count of data points). This formula calculates the standard deviation (STDEV.S) of a spread of data and then divides it by the square root of the number of data points (N).
- Type the formula in a cell.
- Insert your sample standard deviation and the count of the data points in the formula.
- Press Enter.
In this article, you’ll get a step-by-step guide, uncovering its two broad applications and exploring various formulas. You’ll also learn how to check the normality of your data and apply the standard deviation to solve real business problems.
Let’s get started!
What is Standard Error?

The standard error (SE) measures the uncertainty in a statistical estimation. It is based on the standard deviation, which quantifies how close the data points are to the sample means.
In other words, the standard error indicates how likely the mean estimate is to be close to the population mean. If the standard error is high, then it means there’s a high chance that the mean estimate can vary widely from the actual population mean.
The standard error formula in Excel is derived using the formula SE = s / ?n where:
- SE is the standard error
- s is the sample standard deviation
- n is the number of data points in the sample
This is the method you can use to calculate standard error in Microsoft Excel
How to Calculate It in Excel?

There are various methods for calculating standard error in Excel. The method you choose depends on the data type you are working with.
In this section, we’ll explore three different methods for calculating the standard error in Excel:
- Using the AVERAGE Function
- Using the STDEV.P and STDEV.S Functions
- Using the STDEVA and STDEVPA Functions
No matter what method you use, it’s essential to understand the purpose of each technique and how to apply them to your specific datasets.
Let’s explore these methods, plus check out Standard Deviation and the Standard Normal Distribution.
1. Using the AVERAGE Function

The AVERAGE function is a straightforward way to calculate the standard error of the mean in Excel. This function takes a list of values and computes their average, which is used as an estimate for the actual population mean.
The formula for this method is:
SE = AVERAGE(range of cells)/SQRT(number of cells)Here’s how to apply the above formula to calculate the standard error of the mean:
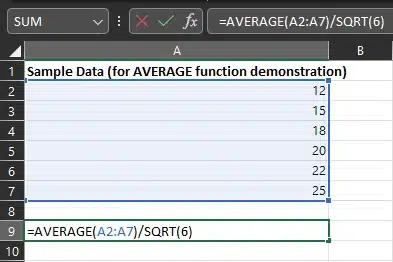
First, select a cell where you want the standard error value to be displayed. Go to the cell and type the following formula, replacing “range” with the actual range of cells you want to calculate the standard error for:
Next, press Enter to see your standard error of the mean value.
Value = 7.620634755
We’ll help you go through this process and provide more examples and visual aids in the upcoming sections.
2. Using the STDEV.P and STDEV.S Functions

There are two functions in Excel that you can use to calculate standard error: the P- and S- functions. Let’s go over each one separately.
P-Function: STDEVP
The standard error is a part of the population data when you know the entire group, and you can calculate STDEVP to estimate the SE.
The STDEVP function stands for the standard deviation of an entire population. It calculates the standard deviation using the whole data set as if it were a population.
The syntax for the STDEVP function is as follows:
- number1, number2, …: These are the individual values of a sample data set.
To use the STDEVP function, pass your entire population data set as arguments to the function. Here’s an example:
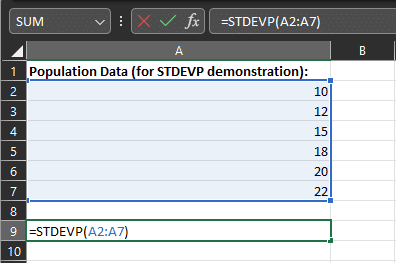
In this example, you are calculating the standard deviation of the population data range A2:A7.
=STDEVP(A2:A7)The formula above calculates the standard deviation for the population standard deviation. If you want to calculate the standard error in Excel for the sample data standard deviation.
S-Function: STDEV.S
The STDEV.S function calculates the standard deviation using a portion of the data set. This function is used when you have a sample data set and want to estimate the standard deviation of the entire population.
The syntax for the STDEVS function is as follows:
- number1, number2, …:
These are the individual values of a sample dataset or array.
First, type the range of your cell in parentheses.
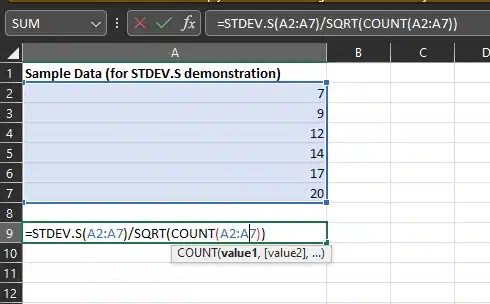
Next, to find the number of data points in the range, divide the count of cells by Excel’s SQRT function. Like this:
=STDEV.S(B2:B7)/SQRT(COUNT(B2:B7))In this formula, you are calculating the standard deviation of the sample data range B2:B7.
Now that you understand the basics let’s move on and explore a more advanced method.
3. Using the STDEVA and STDEVPA Functions

There are times when your dataset contains errors or text values. Instead of getting an error message, you can use the STDEVA and STDEVPA functions.
These two versions of the standard deviation function are used when you mix numerical and non-numerical values in your data set.
Using STDEVA for an Entire Population with Mixed Data
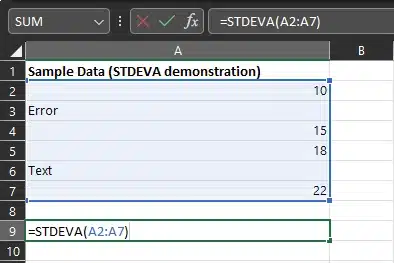
The STDEVA function is used when you want to calculate the standard deviation for an entire population that may contain errors or non-numeric values.
- number1, number2, …: These are the individual values of a sample data set, including text.
Using STDEVPA for a Sample Data Set with Mixed Data
The STDEVPA function is used for sample data rather than data. To use it, simply type the range of your sample cell in parentheses.
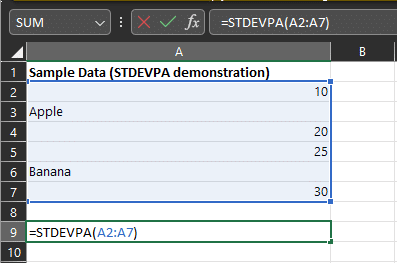
- Values are the individual values of the sample data set that you want to determine the standard deviation for.
Both functions are useful when dealing with mixed data sets, as they allow you to include non-numeric values in your calculations.
Let’s look at how you can calculate the standard deviation and use that to calculate the standard error in Excel.
Standard Deviation and the Standard Normal Distribution

Standard deviation and the standard normal distribution help measure data variability. However, they are not the same thing.
The standard deviation measures how spread out the values of a data set are, whereas the standard normal distribution is a theoretical model that describes the probability distribution of a random variable.
Standard deviation is expressed in the same units as the original data, making it easy to interpret. If the standard deviation is a small number, it means the values in the data set are close to the mean.
If the standard deviation is a large number, it means the values are spread out more. Because the standard normal probability distribution function is set up to have a mean of 0 and a standard deviation of 1, you are directly comparing your data to the model.
Both are useful when working with numerical data to get a better overall view of your data set.
Final Thoughts

Understanding how to calculate and interpret the standard error in Excel is essential for anyone involved in data analysis or statistics.
The standard error is a crucial measure of the accuracy and uncertainty in your data, revealing how closely the sample mean aligns with the true population mean.
Throughout this comprehensive guide, we’ve explored various techniques and formulas, including the use of the STDEV.P Function in Excel.
Additionally, we’ve delved into the value and application of standard deviation methods, shedding light on their significance in data analysis.
Mastering standard error calculation in Excel empowers you to make informed decisions in various professional settings, be it research, finance, or business analytics.
As you embark on your journey of data analysis and statistical exploration, armed with these techniques, you can confidently navigate the intricacies of your data, ultimately leading to more informed and reliable insights.
Best of luck in your Excel endeavors, and may your statistical analyses be precise and insightful!
Frequently Asked Questions
What is the standard error, and why is it important in data analysis?
The standard error (SE) is a statistical measure of the uncertainty or variability in a sample mean’s estimate compared to the true population mean.
It is crucial in data analysis because it helps assess the reliability and accuracy of your data. A smaller SE indicates a more precise estimate, while a larger SE suggests more significant uncertainty.
How does standard error differ from standard deviation?
Standard deviation (SD) measures the spread or dispersion of data values in a dataset, while standard error measures the precision of the sample mean as an estimate of the population mean. SD reflects the variability within a dataset, while SE indicates the reliability of the mean estimate.
Which formula should I use to calculate the standard error in Excel?
In Excel, you can calculate the standard error using the formula =STDEV.S(range of data)/SQRT(count of data points).
This formula computes your data set’s standard deviation (STDEV.S) and divides it by the square root of the number of data points (N). Alternatively, you can use other STDEV functions based on your specific data and population characteristics.
When should I use the STDEVP and STDEV.S functions in Excel?
Use the STDEVP function when you want to calculate the standard deviation for an entire population data set, assuming you have access to all the data points.
In contrast, use the STDEV.S function when working with a sample from a larger population and you want to estimate the population standard deviation based on that sample.
Can I calculate the standard error in Excel for datasets containing text or non-numeric values?
Yes, you can use functions like STDEVA and STDEVPA in Excel to calculate the standard error for datasets that include numerical and non-numerical values. These functions are helpful when dealing with mixed data sets and help you account for non-numeric entries.
What is the significance of the standard normal distribution mentioned in the article?
The standard normal distribution is a theoretical model with a mean of 0 and a standard deviation of 1. It serves as a statistical reference distribution and is used for hypothesis testing and confidence interval calculations.
While not directly related to standard error, understanding the standard normal distribution can be valuable in various statistical analyses.
Are there any limitations to using standard error in data analysis?
Standard error provides valuable insights into the reliability of sample means. However, it assumes that the data follows a normal distribution and that the sample is representative of the population.
Deviations from these assumptions can affect the accuracy of standard error calculations. Additionally, larger sample sizes tend to result in smaller standard errors, which may not necessarily indicate better data quality.
What are some practical applications of standard error in real-world scenarios?
The standard error is commonly used in scientific research, market research, quality control, and financial analysis.
It helps researchers determine the precision of survey results, assess the accuracy of investment return estimates, and evaluate the consistency of manufacturing processes, among other applications.


