
If you want to add a Power BI emoji and make your reports livelier, there are several ways to go about it. You can copy and paste an emoji from an online source, or use Python which I’ll demonstrate today. You can watch the full video of this tutorial at the bottom of this blog.
In this blog, you will learn to leverage a Python package to analyze an emoji and pipe this information to Power BI. I will guide you every step of the way from importing libraries and functions from Jupyter to running the Python Script.

Importing Libraries
We want to end up with a code we can easily apply to different data sets and environments, such as the Python Script Editor in Power BI.
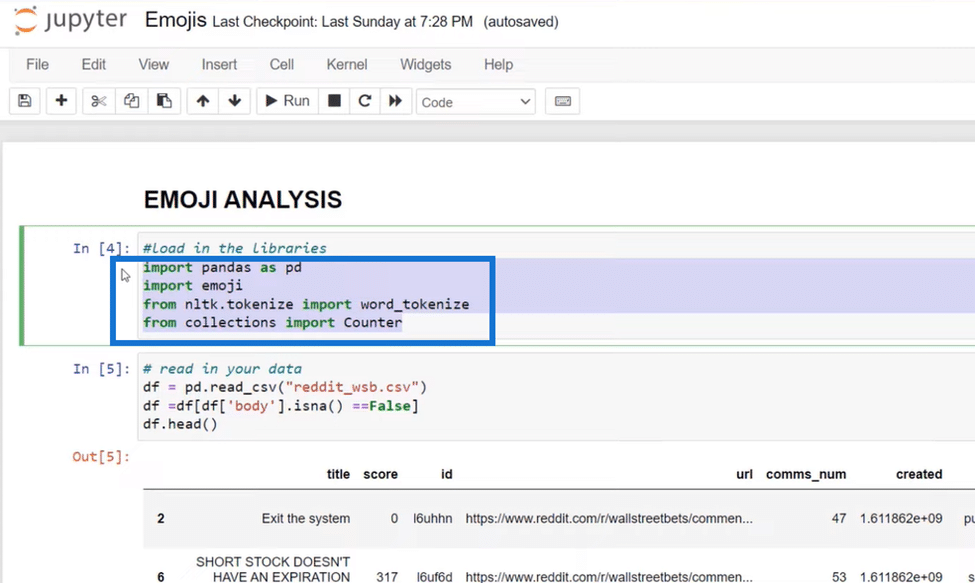
The image above are the emojis we’ll use in this tutorial. So let’s review the code and each essential step in applying it to Power BI. Let’s go to the top of the notebook and bring in our needed libraries.
The first is pandas, our data manipulation library, and the second is emoji, which allows us to identify and decode emojis.
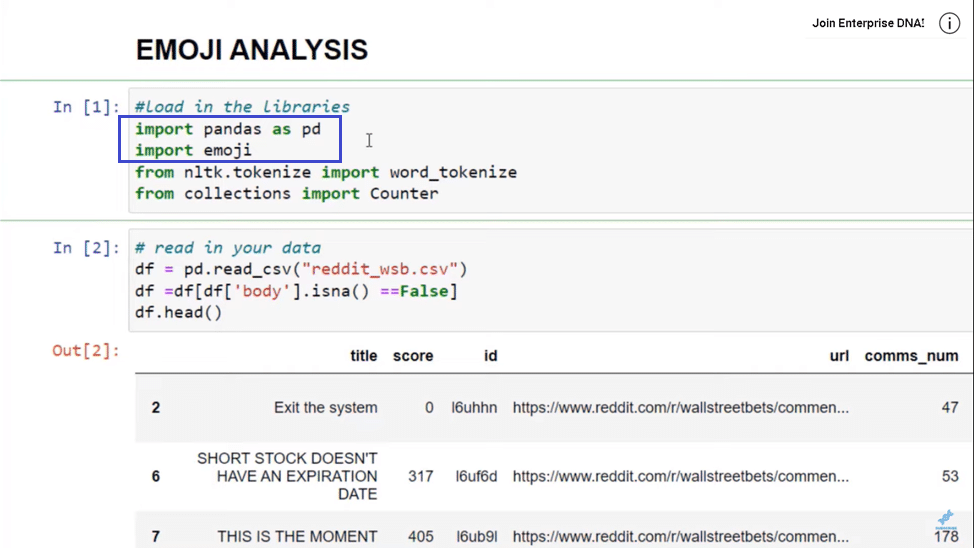
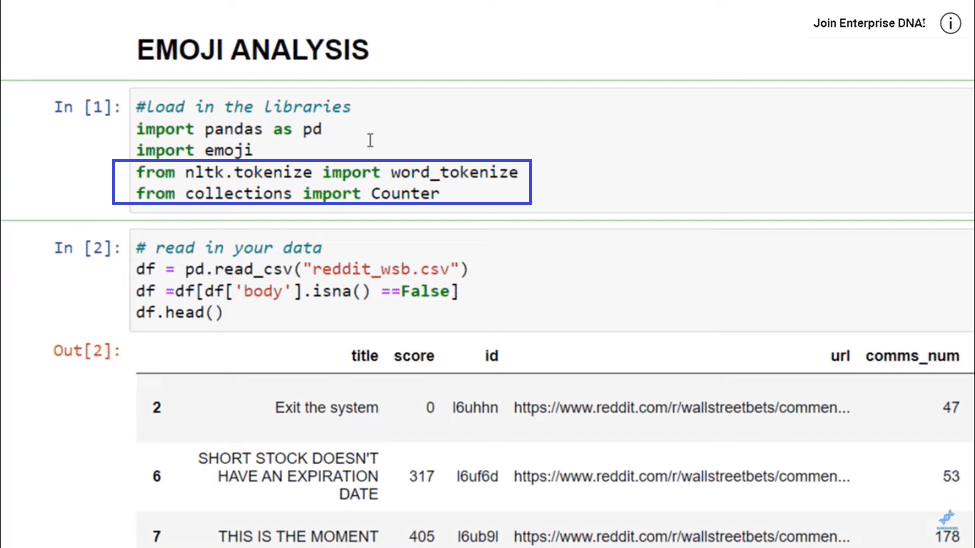
If you don’t have these libraries in your Python environment, you need to install them before we can proceed. Next, we’ll use the natural language toolkit and conduct deep-level text analysis.
So we’ll bring in word tokenize, which allows us to look at each word and evaluate it from the Collections library. We’ll also import Counter for counting and executing frequency analysis on our emojis.
Data Set For Emoji In Power BI
Our data set is WallStreetBets in Reddit, and you can see below it has a head, title, id, and body section. This data set will allow us to evaluate all the different rows inside it. But we need to eliminate these rows and create what we call a bag of words.
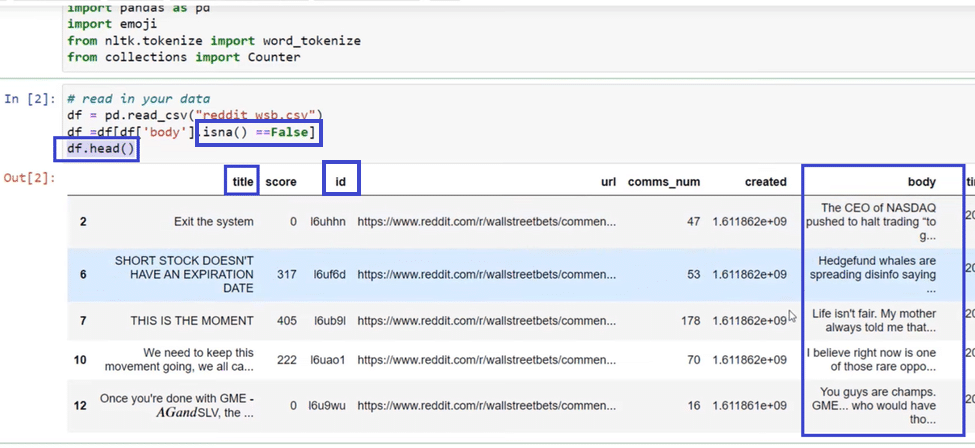
We’ll look at body sections that don’t have a comment. If it has na and is false, as highlighted above, we want to keep it. Next, we’ll pre-process this data set into a bag of words without looking at each section.

So let’s create another line and enter the code highlighted in the image below to join the first 10 body sections in our data set. But be sure to delete the Bow = part in the code because we already have that variable in the next line.
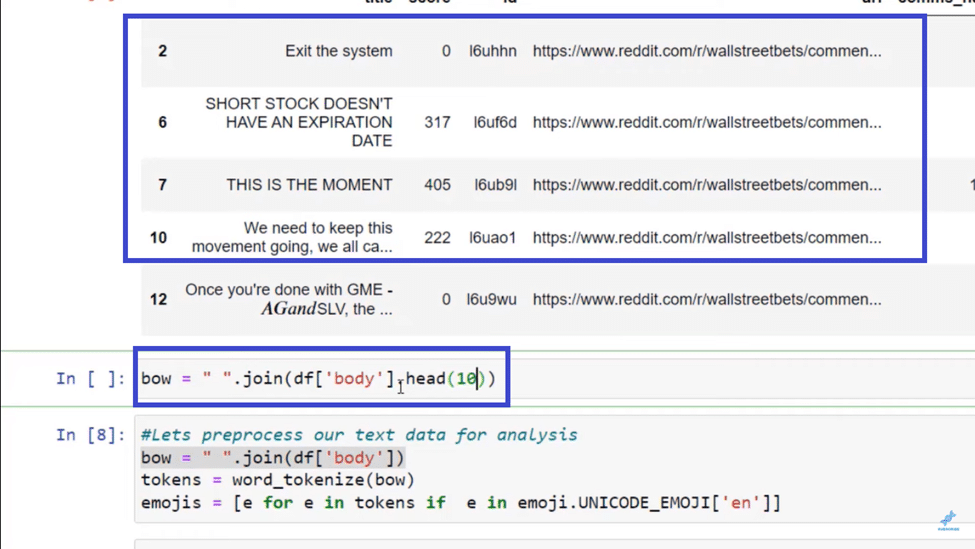
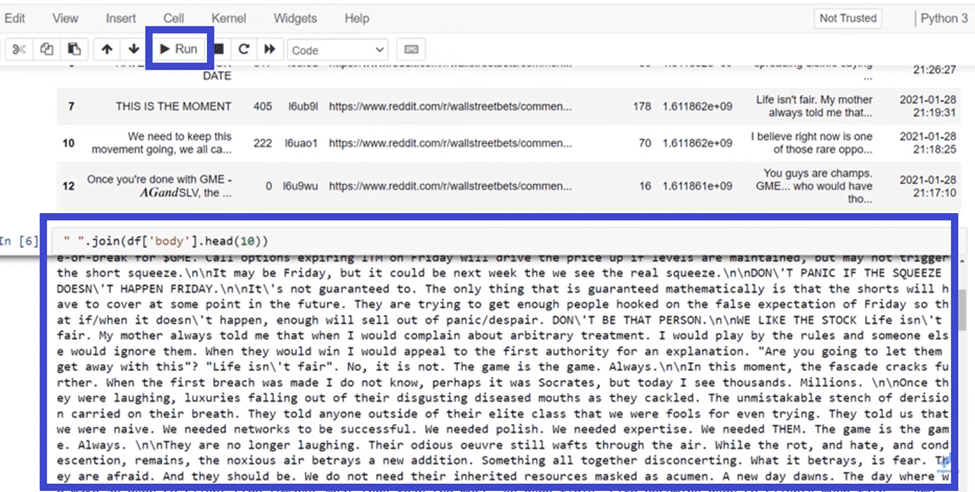
After that we click Run and what we get is the 10 body sections that are now in words.
The next step is to turn those words into tokens. Let’s go back to the line we made earlier and call that variable a, so we put a = at the beginning. And because we want to tokenize it, we’ll type word_tokenize(a) at the bottom and click Run.
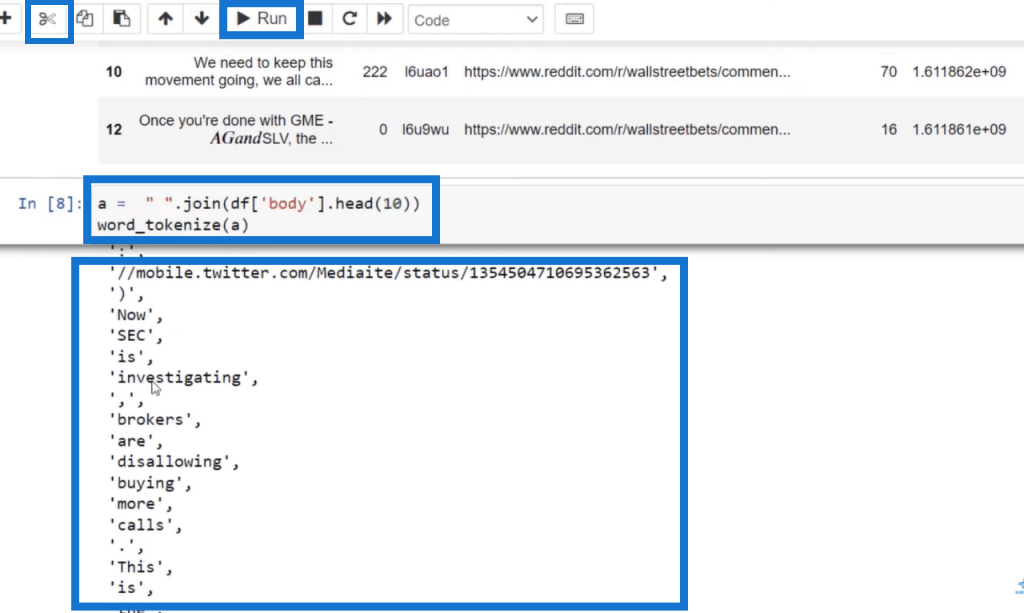
We can see from the results above that we no longer have the collection of words that we had when we joined those 10 sections. Now we have words in a list indicated by brackets which we can review and evaluate one by one to see if it’s an emoji.
So we’ll eliminate this variable because we don’t need it by clicking on the scissors icon at the top left, highlighted in the previous image above.
We’ll then do a list comprehension by saying that for each element in the list, if it’s in our tokens and it is an emoji, we want to return only the emoji as highlighted below.
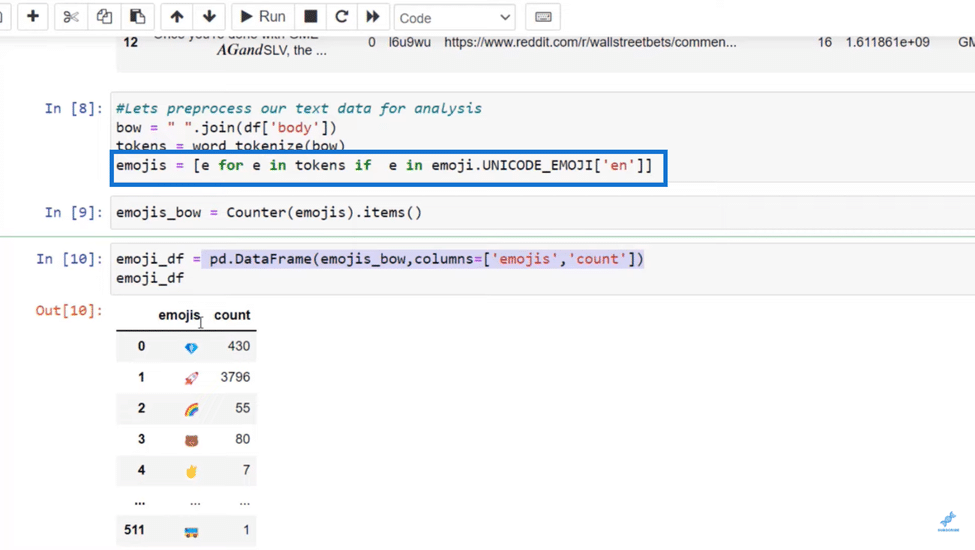
Then we create a counter (highlighted in the In [9] section below) of those different emojis resulting in a data frame. That’s because we’re applying the data frame function (highlighted in the In [10] section below), which counts each emoji in a column and a row.
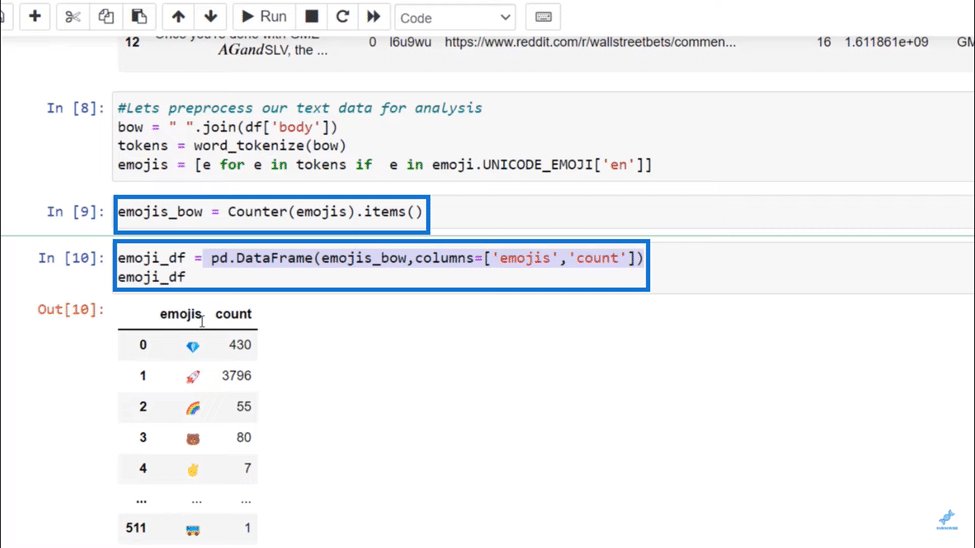
We turn it into a bag of words, then a list using tokenize, and finally count it using the counter. Thus we counted each one of the items in that list and ended up with these emojis below, highlighted in the Out[10] section.
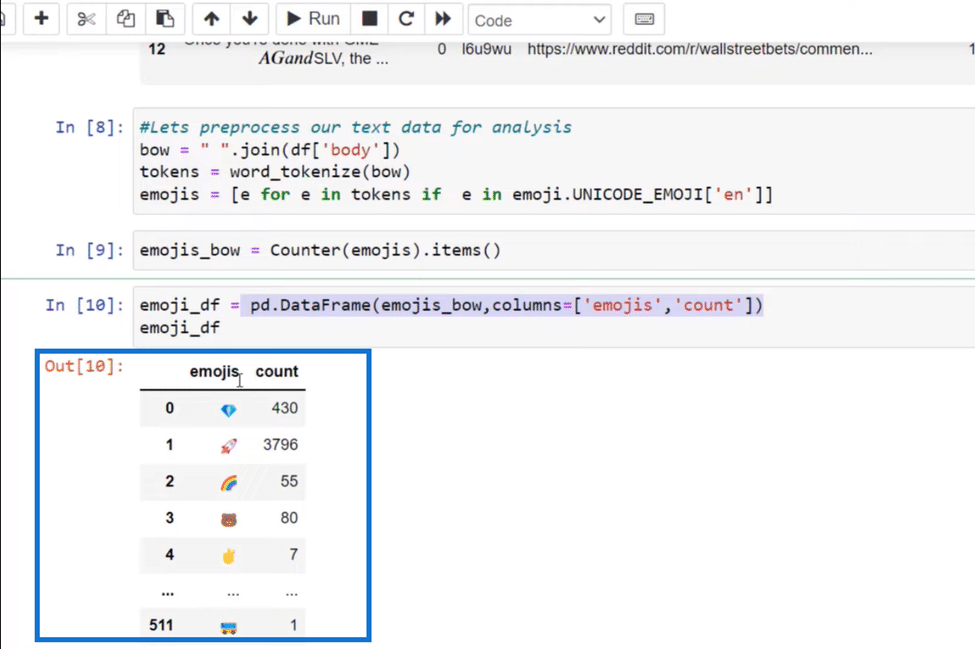
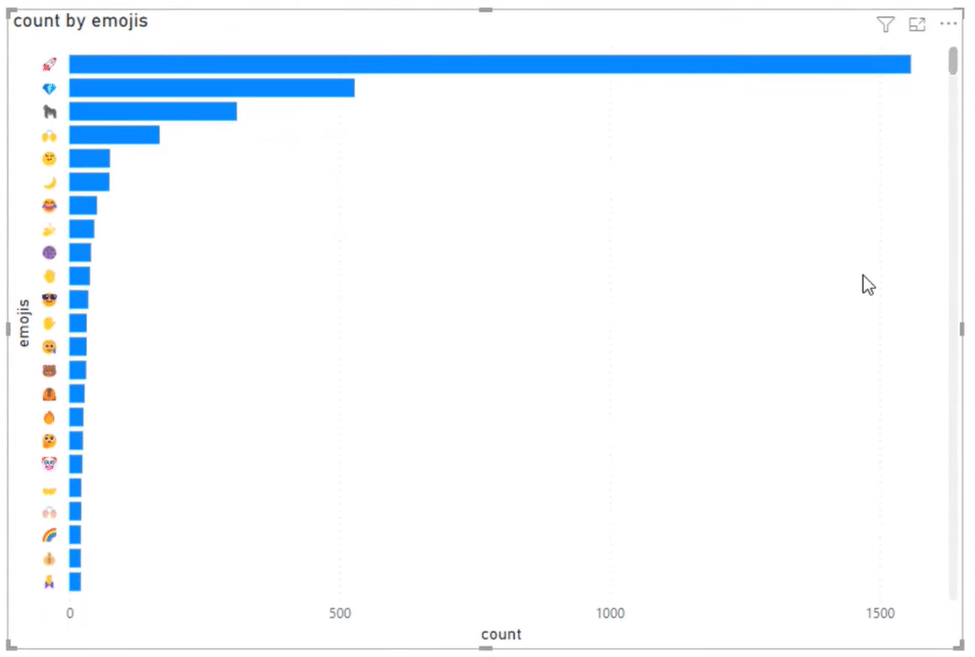
You can see that the diamond (diamond hands was a popular phrase for WallStreetBets) and the rocket are the top emojis used.
Creating A Function
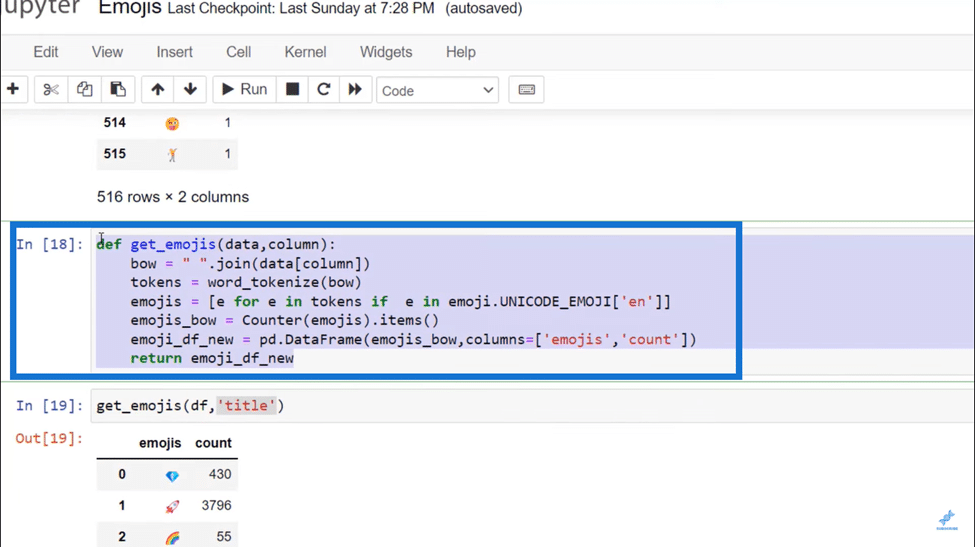
After creating the lines we did independently, we want to create a function, which is nothing more than repeatable code. So far, we have created our bag of words and tokens, searched for emojis, counted those emojis, and created a table with the data frame.
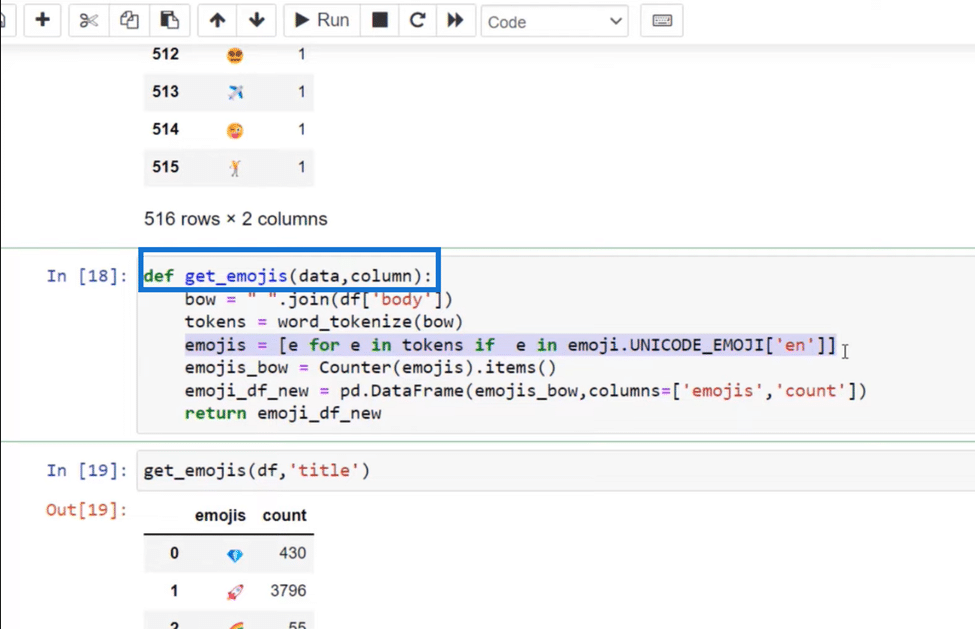
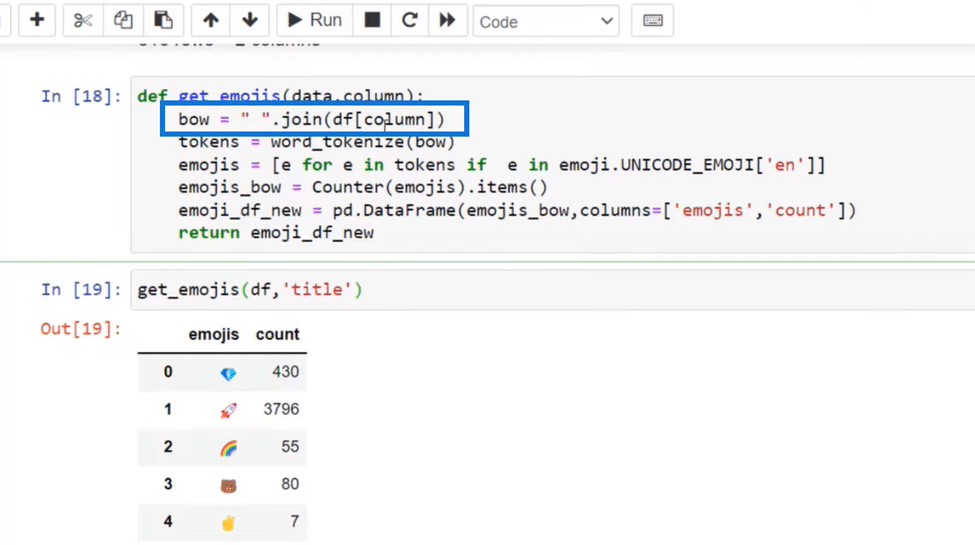
Now we can have those repeatable steps and run the function highlighted above over any of our existing columns. This function has two arguments: we need data and a column.
And because of the second argument, we should change the body inside bow = ” “.join(df[body]) into column, as we want to make sure that’s passed in and not just the body. Thus, it becomes bow = “”.join(df[column]), like in the image below.
Importing The Emoji In Power BI
So let’s open up Power BI and go to Transform Data using our WallStreetBets data set. After that, we go back to our notebook to get our code. So we highlight the codes we need and press Ctrl + V to copy them.
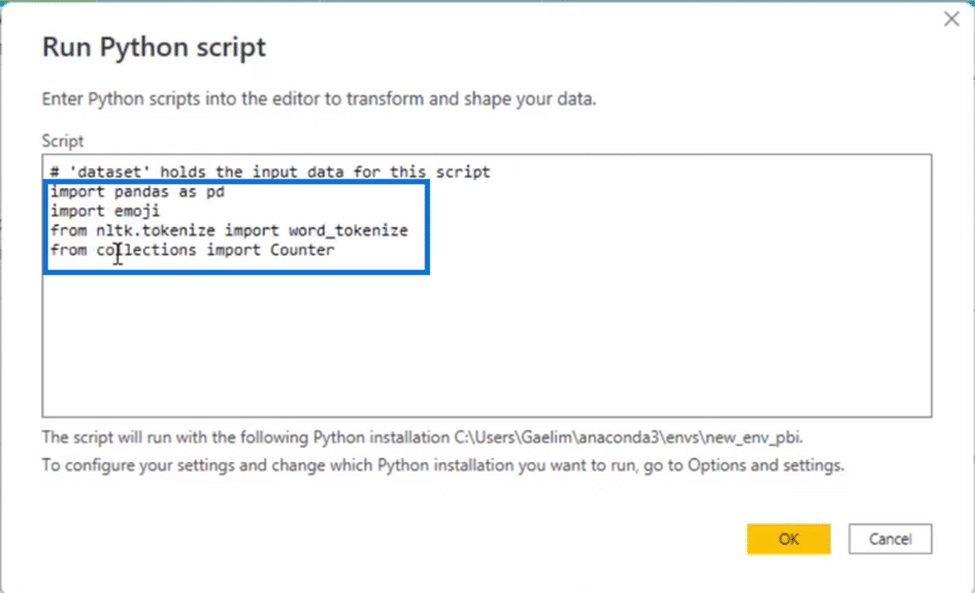
Next, we go to the Run Python Script from the Transform tab, and you can see it “says dataset holds the variable,” which was done by pandas. So we bring in the libraries or codes we copied from our notebook and place them here.
Now we go back to our Jupyter notebook and copy our function highlighted in the image below.

We then paste our function in the Python Script one space below the libraries. To document our function, we’ll write # our emoji function at the top.
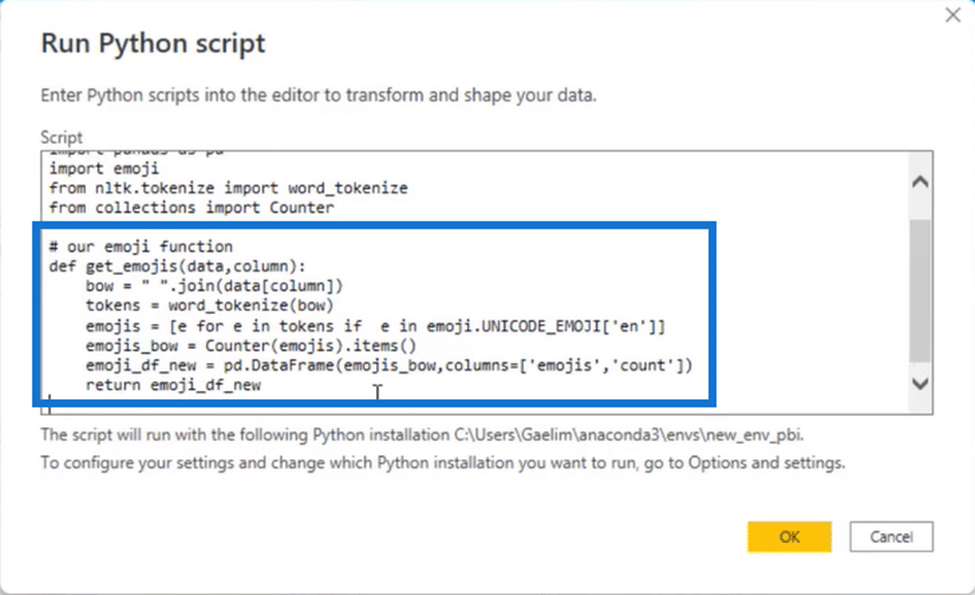
We continue by calling our function, so we copy def get_emojis(data, column) and paste it at the bottom. We then make some modifications by replacing data with dataset and column with title, our column name. We’ll also need to add a name for it so let’s call it emoji_table.
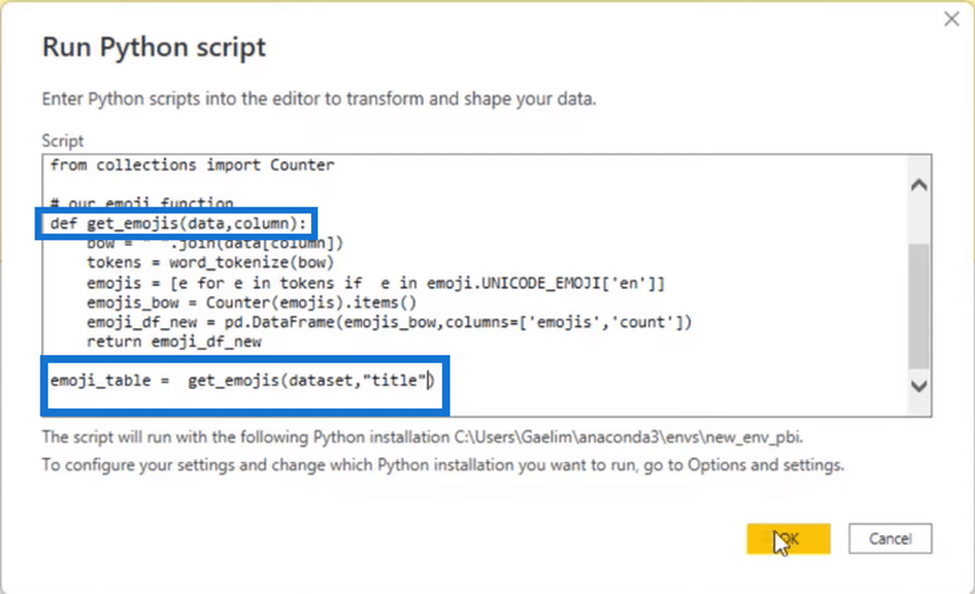
After calling our function, we press OK and get the results below.
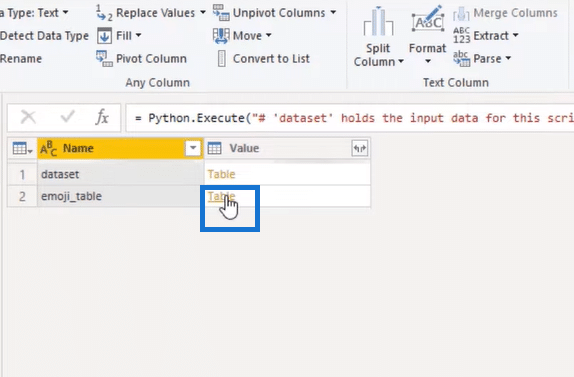
So now you can see we returned a table. We’ll then open up our emoji_table by clicking Table and end up with this emoji table below.
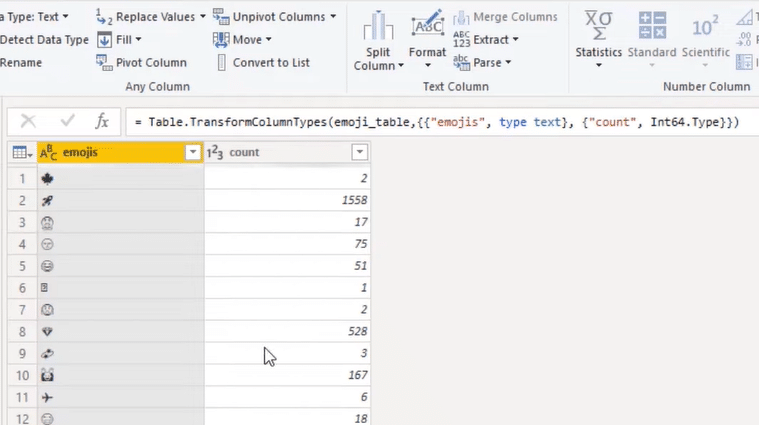
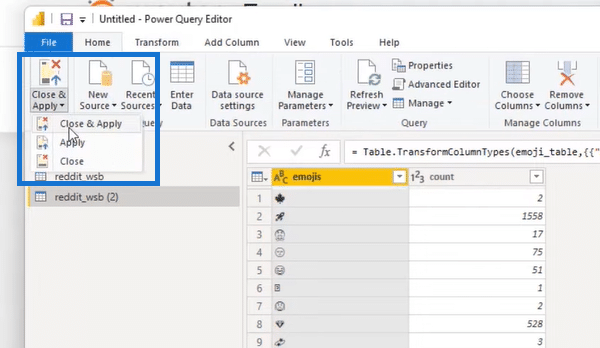
In the table, you can see we have the count and the emoji in Unicode. We will apply our results by going to the Home tab, clicking on Close & Apply, and selecting Close & Apply.
Now that we have successfully run our table, let’s head over to the Fields section at the right and add our count and emojis.
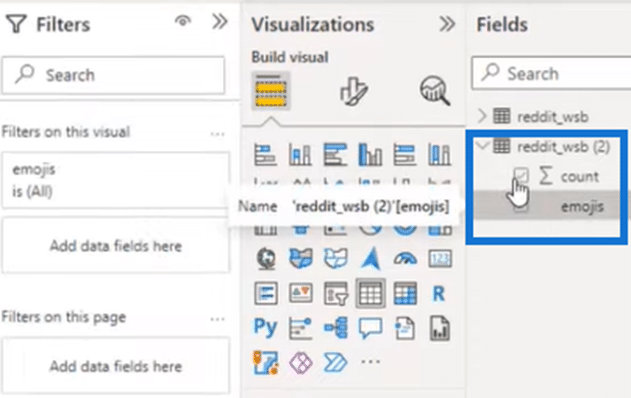
Now we can see our emojis and the count.
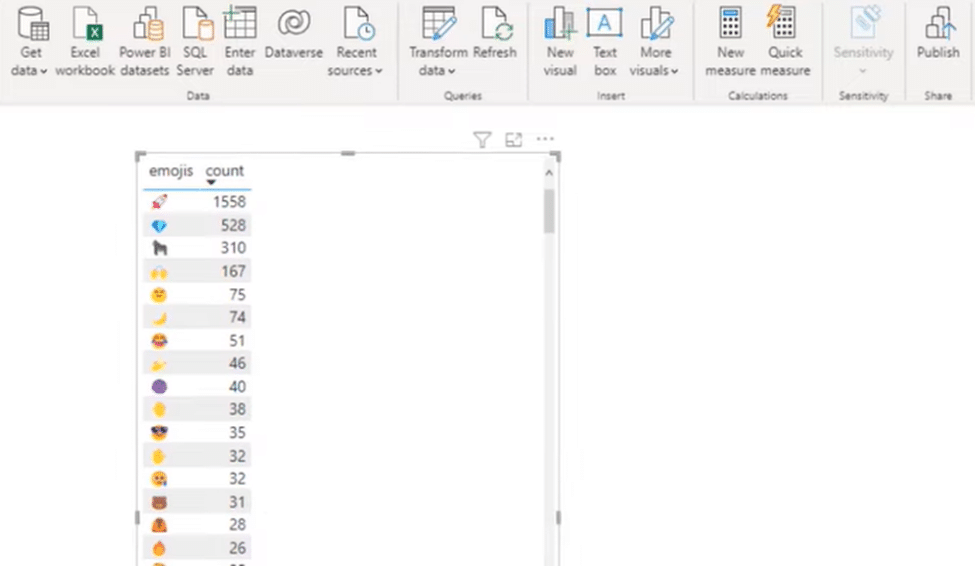
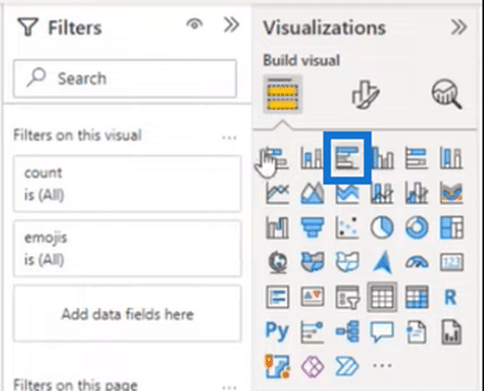
And that is how you can easily bring in emojis to Power BI. You can also turn it into a bar chart from the Visualizations section to get an even better look!
Organizing Your Emoji In Power BI
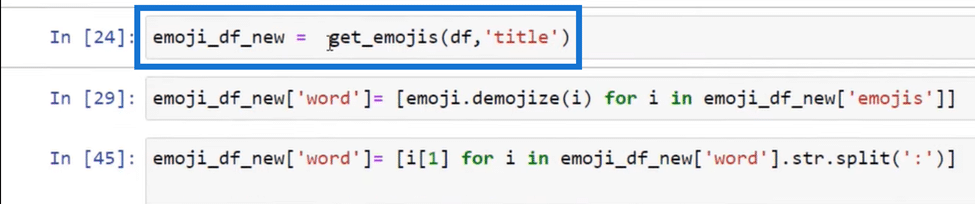
Now, if you don’t want to use the actual emoji but only its name, there’s a way around it. The emoji library in our Jupyter notebook has an emoji.demojize function that can turn an emoji into a word.
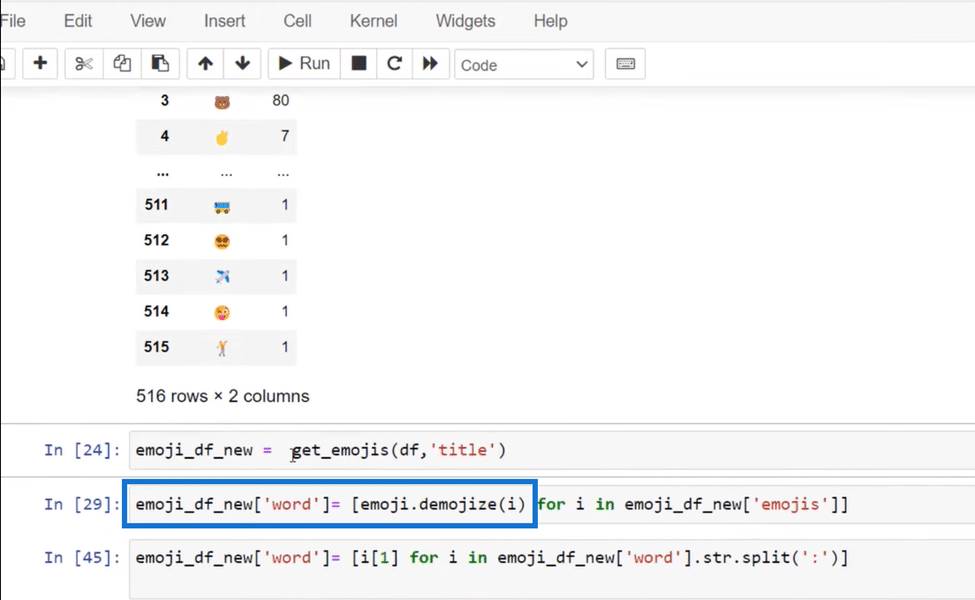
We’ll take similar actions that we did previously, and you can add these to your actual function. So in the data frame we’ve brought into Power BI highlighted in the image below, we’ve taken the emoji and did a list comprehension.
We’re saying that for all the emojis in our emoji data frame (emoji_df_new), we want to demojize that (demojize(i)). And then we’re saving it as a new column word (emoji_df_new[‘word’] =. Thus we have the code for this function below.
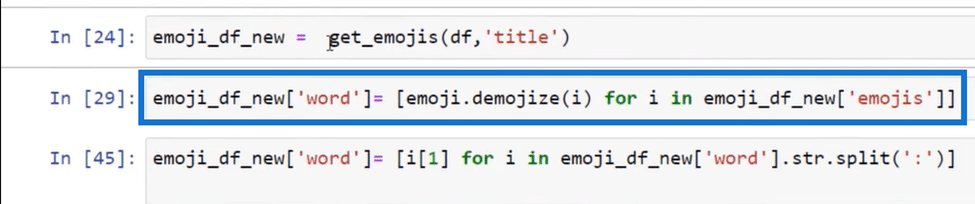
However, it only sometimes comes clean because emojis usually have other things like colons. So you want to remove the colons from your codes like the one highlighted below.
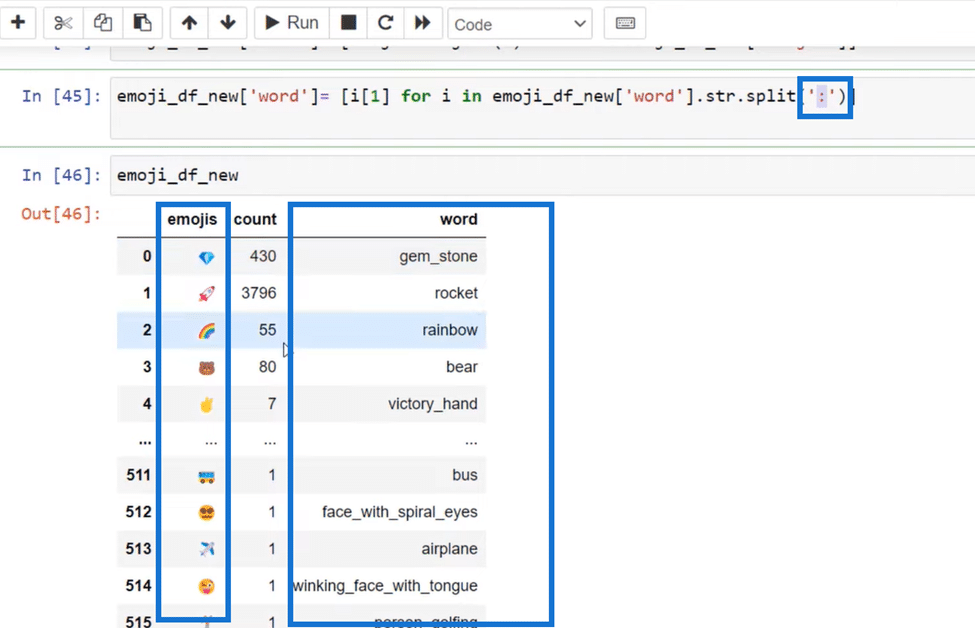
Thus, after you run it in Python Script, you do the same list comprehension and then go through each emoji and remove the semicolon. After removing them, you’ll end with the emoji symbol and word definition, like in the image above. So that’s another step you can take in your analysis.
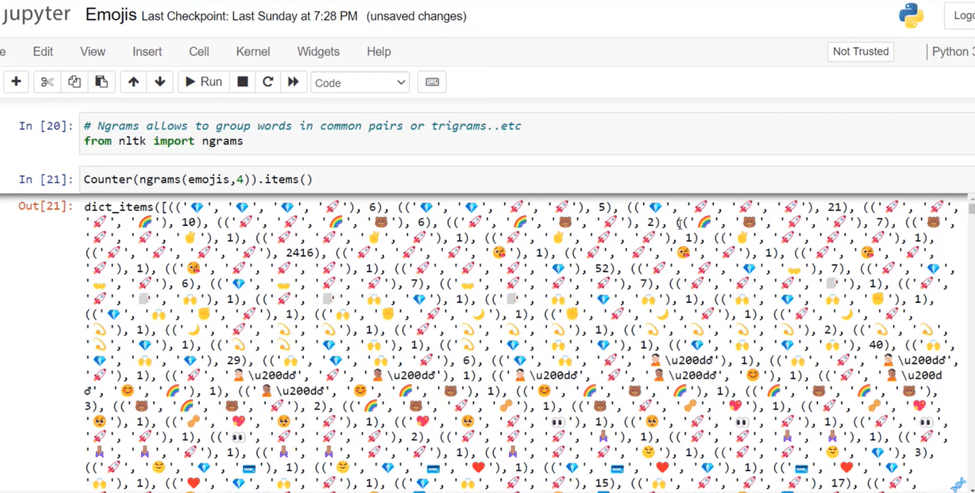
Making Emoji Sentences With Ngrams
Finally, I want to share another method of organizing your emojis. In our nltk, there’s something called ngrams, which allows you to bring in combinations of words or emojis. If someone made a sentence with an emoji, we could use engrams to aggregate those combinations.
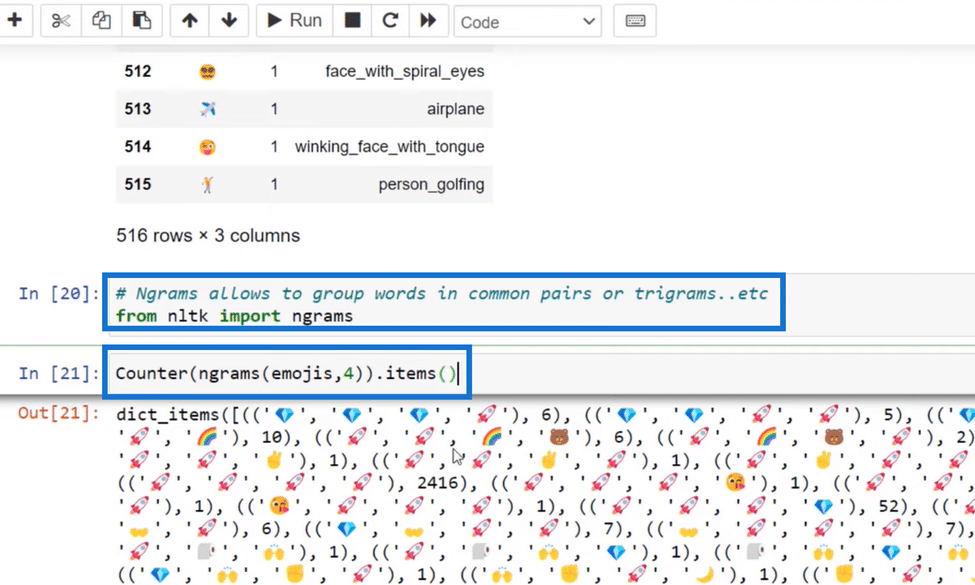
If you look at this function at In [21] in the image above, it looks similar to what we did before. We are counting the engrams (Counter) and taking those emojis that we saved in a variable at the four most common put-together combinations (emojis,4). We are also looking at those items (.items()).
You can create a data frame with this function similar to what we did earlier, so it might be a good practice for you to bring these in and see if they make an emoji sentence.
***** Related Links *****
Datasets In Pandas With ProfileReport() | Python In Power BI
Python II For Power BI Users – New Course In The On-Demand Platform
Python Scripting In Power BI Data Reports
Conclusion
In this blog, you learned all the steps in adding an emoji in Power BI using Python. You discovered how to import essential libraries in your Jupyter notebook and the steps in pre-processing your data set. That includes creating a bag of words and tokens, searching for emojis, counting those emojis, and creating a table with the data frame.
We then created a function that we placed in our Python Script Editor so we could import our Data set into Power BI. And finally, you learned how to organize emojis through demojize and ngrams. Try practicing all the techniques and methods demonstrated from this blog to master your skill in adding an emoji in Power BI.
All the best,

Gaelim Holland


