In this blog post, I want to hone into a real world application of Power BI – How can we discover how much profit we are missing out on? There are probably a few ways that you can work out solutions to profit leakage. The way I have done it with this example is to focus in on margin analysis for each sale that we make. You may watch the full video of this tutorial at the bottom of this blog.
I wanted to demonstrate how specific you can get inside Power BI just by expanding your mind around what’s possible.
Minimizing Margin Differentials
Across different customers and regions, you might actually have sales of similar products at different margins. By working hard to minimize these margin differentials, you will ultimately benefit from increased returns across the board.
For this blog post, we’re going to run through an analytical scenario that will show how far you can take debt and discover these amazing insights that is historically very difficult to achieve in a scalable way.
We can also dynamically drill into any aspect of these really unique insights and then make comparisons. For this particular tutorial, I will be focusing on profit leakage and seek to understand why and where we are missing out on some profits.
Finding Out Missing Profits
If we are selling certain products to certain customers under the average of what we’re selling it for, then we’re missing out on profits. We have to know why some customers are getting the same product in different areas or at different times for a profit margin that is less than the average.
This is to determine if we can increase those that are down at the bottom and have a big margin differential to the average. By doing so, we can pick up more profit or at least identify where you’re losing profit.
Let’s work out how you can actually do this. First off, we need to make a table with our customers and margins.
By using a slicer, we can click through and see what margins we get in the different regions that we sell to.

Since this is a demo data set, it’s not going to be perfect. But the same technique can be used in a real-life data set, and the insights you will get make a little more sense.
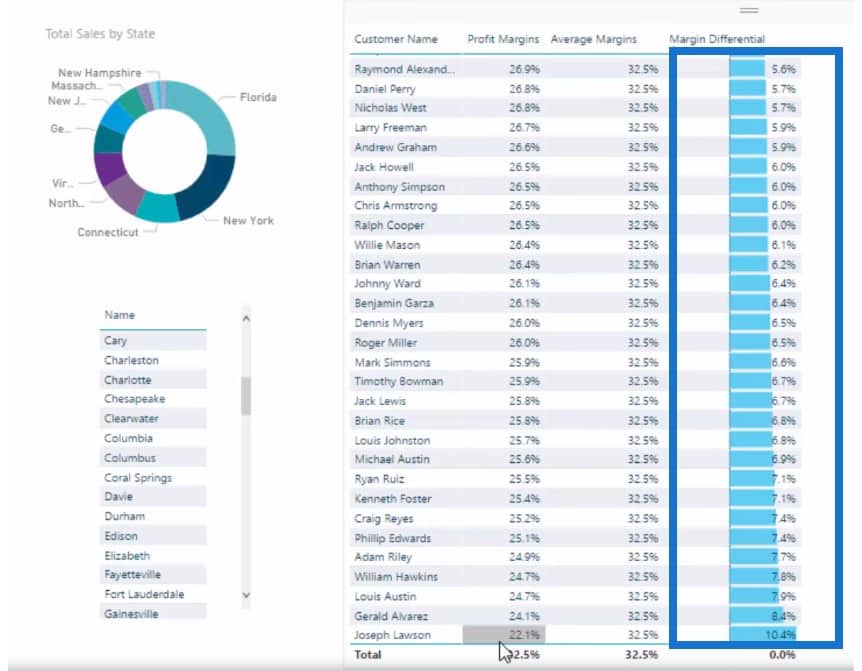
The average (32.5%) is already done for us with the total at the bottom of the table. Somehow, we just need to get this total up into every single row in our table.
Average Profit Margins
We already have our Customer Name and Profit Margins in the table, so the next thing to do is work out the Average Profit Margins across all of our customers.

Let’s create a new measure and call it Average Margins. I will use the CALCULATE function to calculate profit margins, but instead being filtered by Customers, I will go with ALL(Customers).

Once I bring this measure into the canvas and change it to a percentage, you’ll see the total is now 32.5%, which is the same as our Average Margins.

Margin Differential
Now that we have the Average Margins, we can also work out the differential. Who (and where) are our customers that are buying products from us for less than the average?
I’ll create a new measure and call it Margin Differential. I will then deduct the Profit Margins from the Average Margins, then format and change it into a percentage.

Once we drag this measure into the table, we start getting results:

We can now see the differential and see some customers that have better margins than the average, which is great.
If we can get people at a higher profit margin, why don’t we push more people up to this margin?
We want to isolate the negative margins, or the ones that are well below our average margins. The next step is to investigate why this is happening and push these customers up.

Changing Visual Level Filters
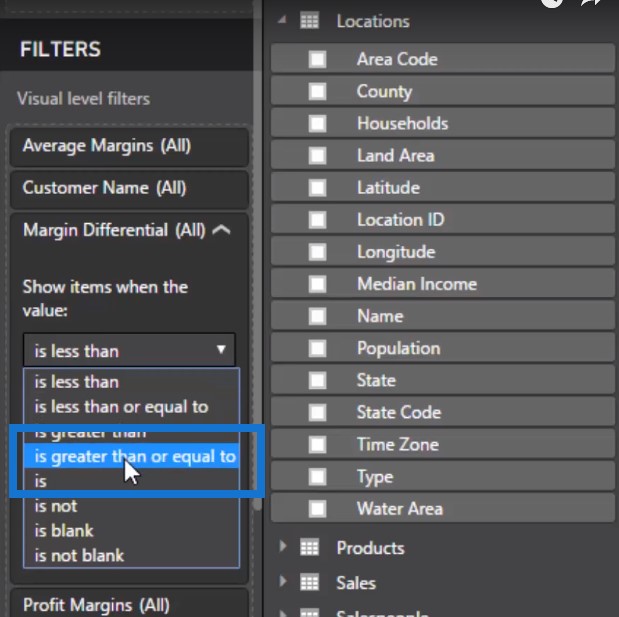
The other thing I want to do is to restrict this table since I only want to see the ones that are below the average rate. I’m going to my visual level filters and changing the settings to greater than 0.

Missing Profits
So how do we work out the profits that we’re missing out on? We find out our profit leakage by deducting the Margin Differential by the Total Sales because if we increase the margin differential after average, it will then give us the profits that we missed out on. We then drag this measure out onto the canvass.

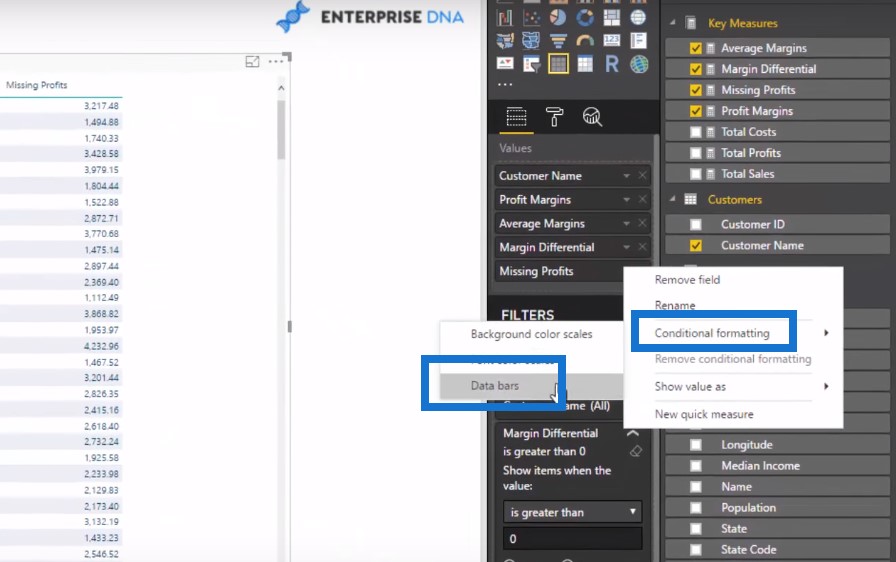
To make things more visually appealing, I can turn the Missing Profits column into data bars.


One other cool thing we can do is to actually compare what we already have to our profits in general to gauge how much we’re missing out on.

Over our entire data set of margin differentials, the negatives are the ones below average. Now, we also have to remember that we have a visual filter on. If we didn’t, these columns would even out because we have both the positive and negative.
Interestingly enough, we’re almost missing out on just under 10% of profits for these particular clients. This is a pretty significant number of profit leakage, and with this insight, we can come up with strategies to push these customers higher.
***** Related Links *****
Calculating Percent Profit Margins Using DAX In Power BI
Create Compelling Power BI Insights Fast For Financial Analysis
Discover Where Your Profit Growth Comes From: A Power BI Tutorial
Conclusion
If we are selling products or goods below average margins, obviously there’s some profit we’re missing out on.
I love how this just shows the real world application potential when using Power BI. You can utilize Power BI in so many effective ways to find valuable insights for your business.
For many more business analytics and profit leakage examples for Power BI, check out this course module within Enterprise DNA Online. There’s so much to review and learn from here.
Take care and all the best,
Sam


