
As many of you know by now, I am huge on showcasing how you can apply Advanced DAX Formula to discover insights that historically have been difficult to find and also showcase easily. Well, this is another example of that and a great way to segment or group results rather than just showing results by themselves without any context. You may watch the full video of this tutorial at the bottom of this blog.
In this example I drill into results on a range of customers. Instead of just showing a generic sales result, I want to see if a customer was in the top ranked results and then I want to see how that changes over time. This is pretty powerful stuff.
We want to work out how much revenue or profit every year could be attributed to our top 10 or top 50 clients. This technique is exactly how you would do that. Being able to show how this changes over time is also a quality insight. Being able to showcase if this increases or decreases in any meaningful way can provide insight into the sustainability of your sales. Many actions around marketing or operational could be derived from insights like this.

Creating Dynamic Groups in Power BI
In this tutorial, we will be combining a number of techniques in Power BI and DAX to do some pretty advanced analysis. We already have information about our sales over time and we know who our customers are. But let’s say you wanted to understand how much of our sales are coming from our Top 5 clients, Top 5 to 20, and then the rest of our clients.
Sometimes, you will need to create these dynamic groups so that you can see if there is a trend happening over time. Not only do you want to evaluate these groupings, but you actually want to evaluate them over time.
This is very difficult to do, especially if you’re working from Excel. You will have to write some pretty advanced formula and use advanced logic like RANKX in Power BI. But if you understand DAX really well, you can write a formula that does not take you long to write at all and then it becomes a pattern that you can use over and over. Let’s go through the steps of how you can achieve this.
Creating Groups Based On Ranking
The first thing we need to do is go to our data model and create groups of our customers based on their sales ranking. In this example, we will be ranking the sales of our Top 5, Top 5 to 20, and the rest of our customers.
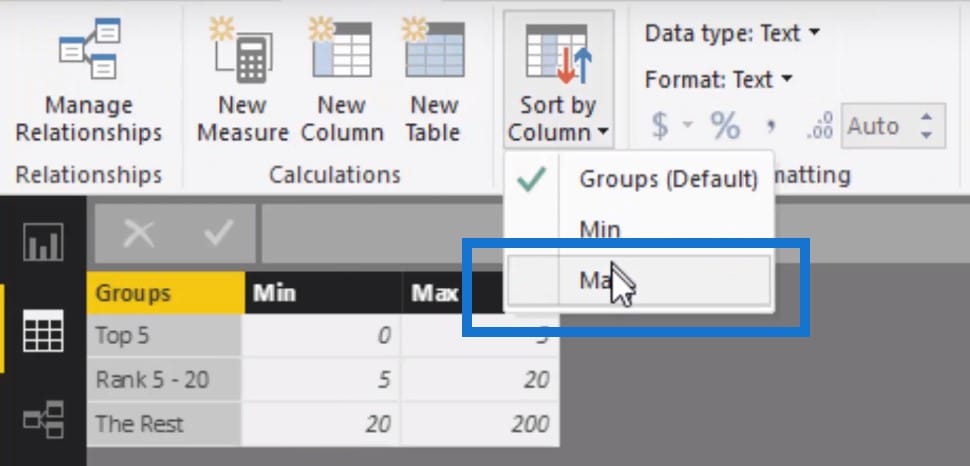
We are going to create a table and call it Customer Groups and then put in these dimensions: the first one is called Top 5, the next one is called Rank 5 – 20, and the last one is The Rest.
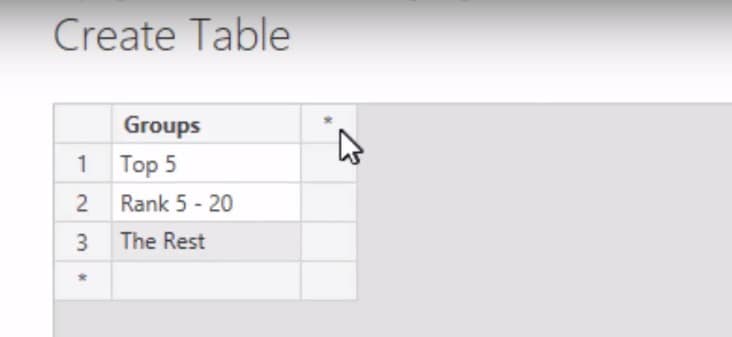
The next step is to create a range so we will put up the MIN and MAX columns. We will then fill out the range for these three groups and click Load to finish setting up our table.


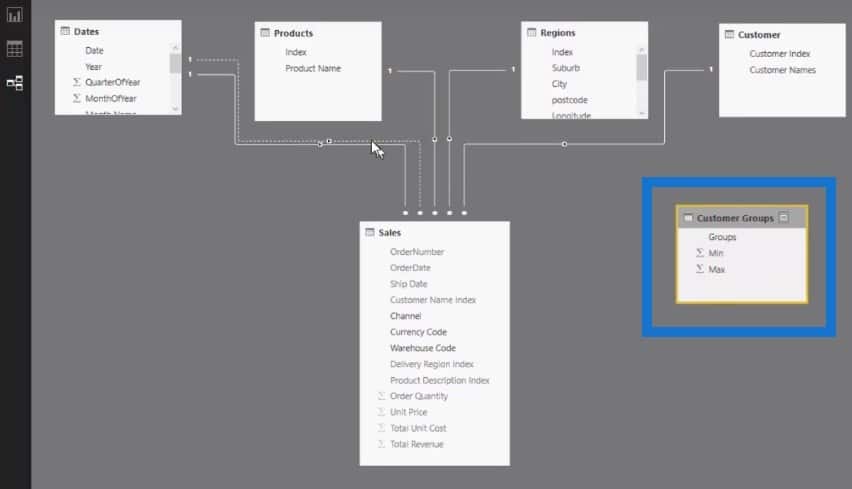
Let’s go back to our data model to find the table we just created. This is a supporting table that has no relationship to the rest of the data model and is not connected to any other table. We are just going to use this table to push some logic in our calculation to produce the results we need in our measure.
Determining The Total Sales
Let’s jump back to our front end in the report section and then write a new measure. We already have Total Sales, which is a simple sum of our total revenue. This is the simple, straightforward formula we used to get Total Sales:
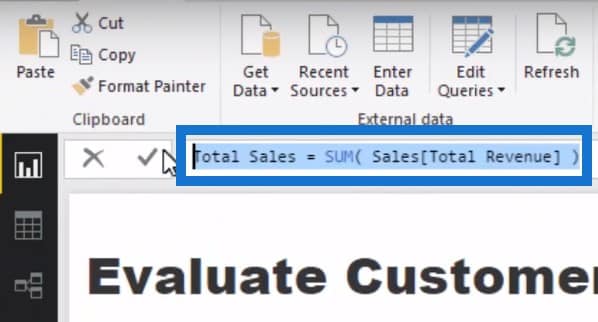
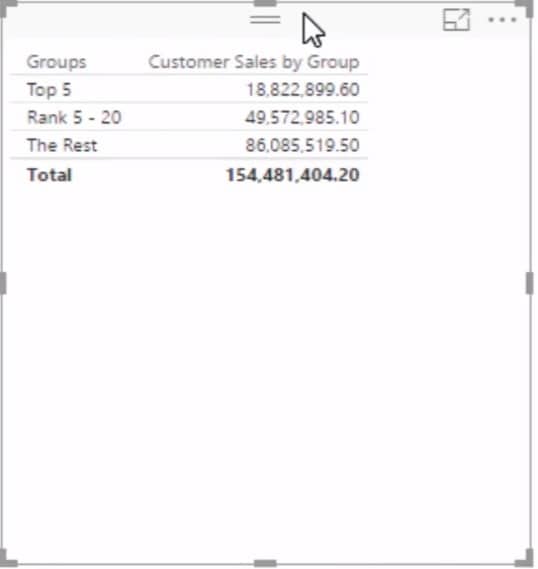
The result of our Total Sales is $154,481,404.20. This result has been filtered for the years 2014, 2015, and 2016.

This is our Total Sales throughout the time that is currently filtered. But what we want to see is the Total Sales based on customers that were our Top 5, Top 5 to 20, and all the rest. We need to write some pretty advanced DAX formula to achieve this.
Determining The Total Sales of Each Group
We are going to create a new measure and name it as Customer Sales by Group. As always, we start with CALCULATE because nothing happens without the CALCULATE function. Then we add the Total Sales because that is what we are summing up.
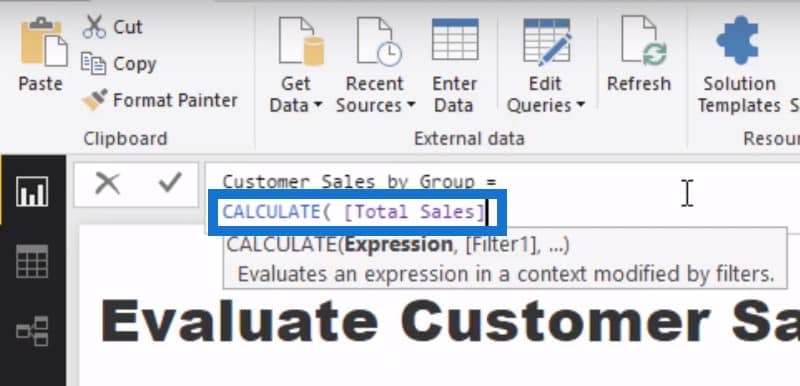
Then we will jump in to another line and use the FILTER function. We need to create a table to filter over. In this case, it is relatively obvious we need to filter over a table of Customer Names.
We need to iterate through every single customer and evaluate what their ranking is, and then see if their ranking is above or below the MIN and MAX that we just created.
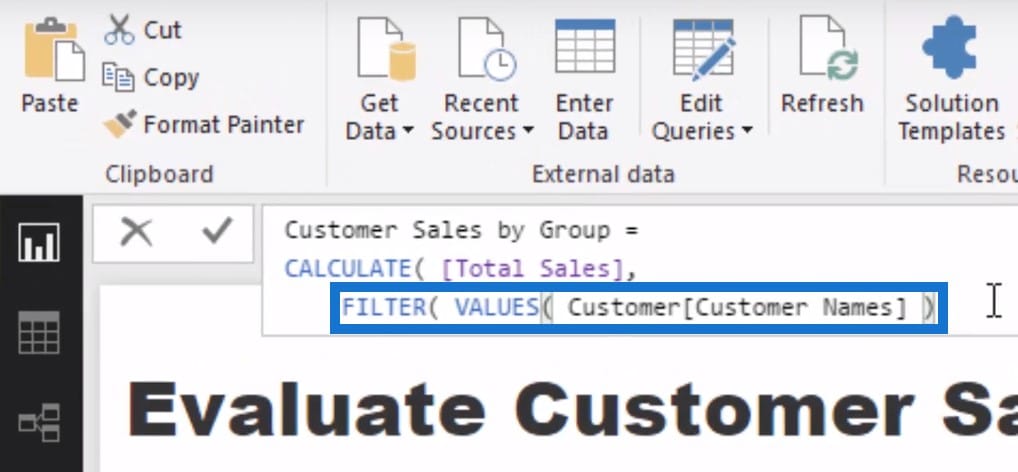
The next step is to use the COUNTROWS function and the FILTER function again. Then choose Customer Groups, which is the table we just created.
Using Advanced Logic With RANKX In Power BI
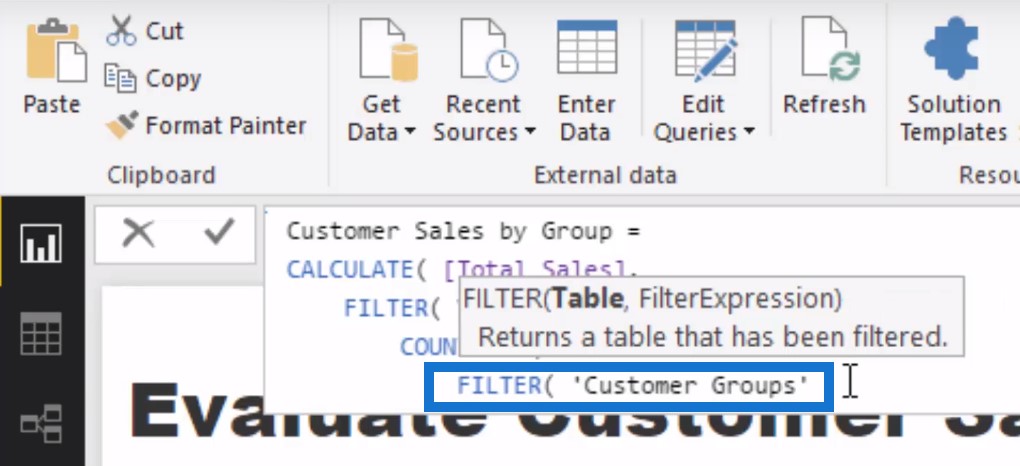
Then we are going to iterate through this table using the relatively advanced logic RANKX in Power BI. We are calculating our Total Sales at the top but our Customer Groups table is actually the ranking. We need to get the ranking of each of these individual customers and then see if they are within any of the groups that are in the Customer Groups table.
To get the ranking, we need to use the RANKX function and all the Customer Names. We will then rank them by Total Sales, and then choose DESC to rank them as 1 for the highest and 200 for the lowest. We will then close it off with greater than the MIN for the highest ranked customers.

Then we will jump in to another row because we are working with two pieces of logic here. We will use RANKX and the similar logic we used above but then with less than or equal to MAX. Then we are going to close off the COUNTROWS. We want to make sure the COUNTROWS logic is working, so we’ll also write greater than zero, then click Enter.

Checking The Results Of The RANKX In Power BI
We’re done writing the calculation, so let’s see what it is actually doing. We’ll drag the measure we have created into the table and see if we actually get a result.
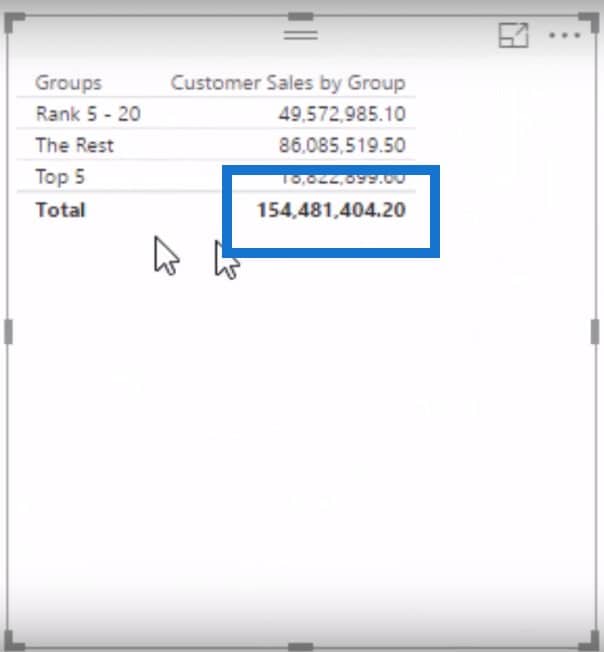
The first thing we need to check is the total. Is the total exactly the same as the Total Sales we came up with earlier? Yes it is.
Now let us work through what each calculation is doing. To achieve this particular result, we calculated the Total Sales then created a table of every single customer by referencing the Customer Name column. Within this iteration, we evaluated each customer if their rank is greater than the MIN and less than or equal to the MAX.
This is quite advanced DAX because this group did not exist in the data at all. But now we are calculating the sales for our Top 5, Top 5 to 20, and the rest.

Sorting The Table And Visualising The Data
Now that the writing part is done, we’ll sort the table which is currently sorted by alphabetical order. We’ll just click on the Modeling tab and click Sort by Column. We’ll just sort by MAX so that we are looking at the groups in an organised way.
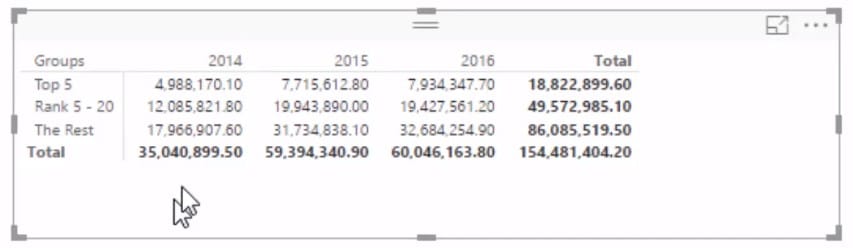
We can make this data even better. Because it is dynamic, we can place another context in this calculation using Years to see the sales per group within a particular year.
By doing so, we’ll be able to see trends. So we’ll just grab the year, put it in our table, and turn this into a matrix. We can now see the breakdown of sales per group for 2014, 2015, and 2016.
We can now create a visualisation out of these numbers. We can grab our customers’ names and groups, then drag them over the canvas. We can now visualise our Top 5, Top 5 – 20, and the Rest.

***** Related Links *****
Deep Dive Into RANKX – DAX Formula Concepts In Power BI
Using Dynamic Visuals On Ranking Based Parameters In Power BI
Detailed Ranking Example Using DAX in Power BI
Conclusion
This result would not have been possible any other way if you do not understand how to write the code that we did earlier. If this doesn’t make complete sense the first time round, review it a few times and try to bring it into a model you’re currently working on. You’ll be amazed at the applications of this technique across a range of scenarios.
Also, if you are just starting out with DAX, you may want to look at my Mastering DAX Calculations online course which comprehensively goes into everything you need to learn for implementing DAX in your own Power BI models.
Good luck with this technique – for any comments and thoughts just let me know below.


