In this tutorial, we dive into the power of Power BI analytics. I’m going to go through something quite practical for a retailer who sells goods at a high frequency. You may watch the full video of this tutorial at the bottom of this blog.
When you are a business that sells a lot of goods – say an online retailer – if you can analyse how much you would benefit from increasing your average order size, you then have a piece of analysis that can very effectively be turned into a plan of attack that will make a big difference to your bottom line.
From this insight, you could run promotions or marketing events that are focused on the clients where you feel you’re going to get the highest return.
With this example, I cover a few different DAX techniques. There’s a lot to take away from it, especially from a technical point of view. You can learn how to run iterating functions over your underlying data tables to discover this particular insight, but also see the potential for many more insights just like it.
Running Scenario Analysis On Order Size
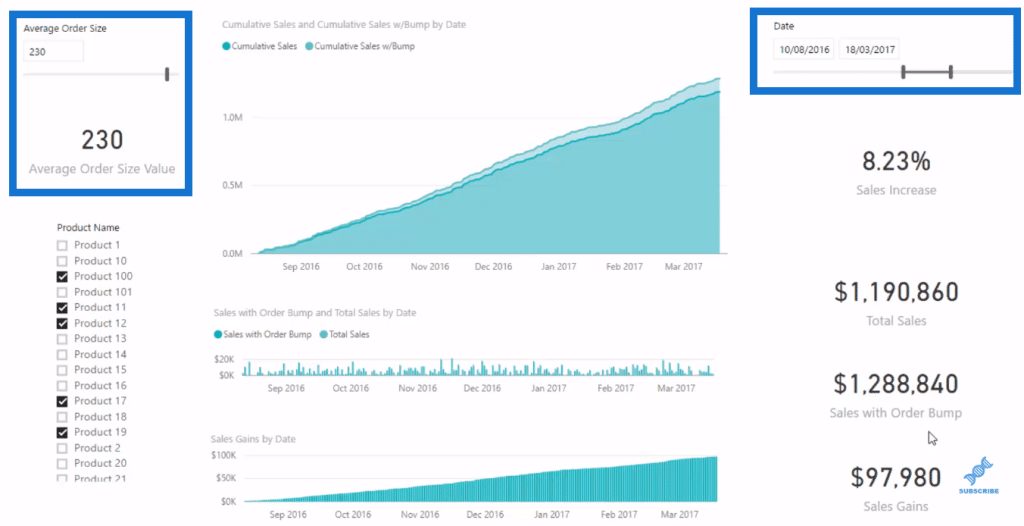
Here I’ve utilised the WHAT IF parameter feature up to create a dynamic scenario analysis on the order size. This is an amazing way to use Power BI analytics.
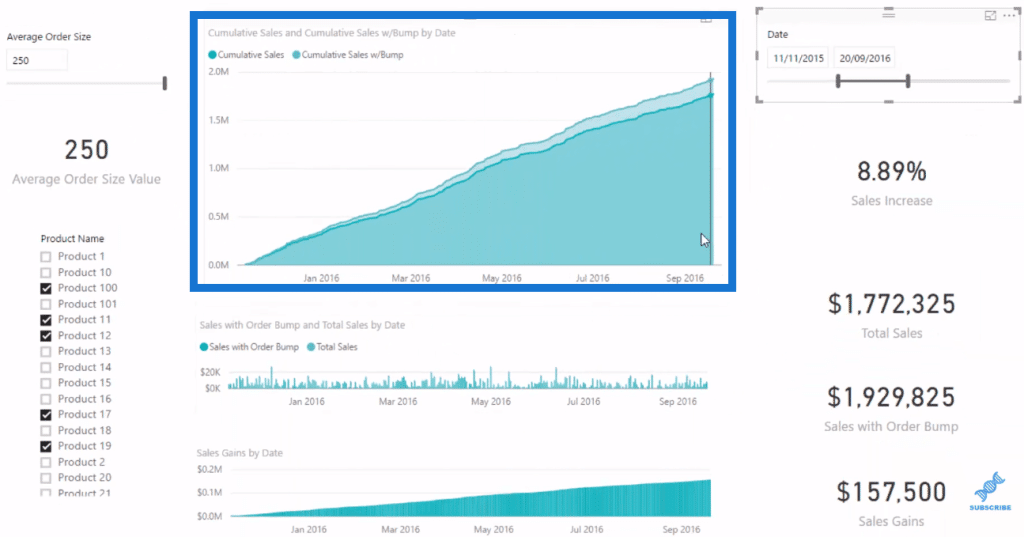
In this case, we want to see what’s going to happen to our sales through time if we increase our average order size. We have the option here to choose how much we want to increase. We can have $80 or $230, all the way up to $250 as our maximum. We can also have a look at how that affects over time.

From this, we can plan well if we want to run a promotion or do some advertising. We can make an analysis on the impact of our order size to our sales, if say, we can get our average order size up based on some up-sells or some cross-selling with our sales team trained to recommend these products.
The key thing is to have a good understanding of iterating functions because it’s essentially what you need to use to incorporate this average order size value.
Using Iterating Functions
Iterating functions generally have an X on the end. There’s a few others that don’t have, but mainly the ones you really need to understand early on is SUMX, AVERAGEX, and many more. These functions iterate through every single row of a table.
In this case, we have specified the Sales table. What we’re doing here is that for every single row in the Sales table, we look at what quantity we sold and multiply it by whatever price that product was.

In other words, we’re calculating a sale for every transaction to every row of our data. Now if we want to place some scenarios over if we can increase our average orders, then we need to somehow incorporate a variable into this row by row calculation.
So we need to multiply quantity by the current price and by our increase in order size. In this case, we need to grab this variable that was created from the new parameter and feed it into the iterating function here.

That’s how we come to our Sales with Order Bump calculation.

So for instance, we increase our average order by $250 by doing some up-sells or cross-sells, then this is what the impact would be cumulatively.

We then grab this new calculation and I put it into our Cumulative Totals pattern, wherein we utilise DATESBETWEEN.

We compared it cumulatively to our Sales with no order bump, and that’s how we get the difference. Then, we branch out into Sales Gains.

Key Points
I recommend you start you start with the initial scenario, then you branch it out onto these different cumulative total pattern. This way you can then visualize things in a slightly different way.
You can start off by feeding in the variable, but then work out what your visualization is and implement the DAX formula that actually gets you there.
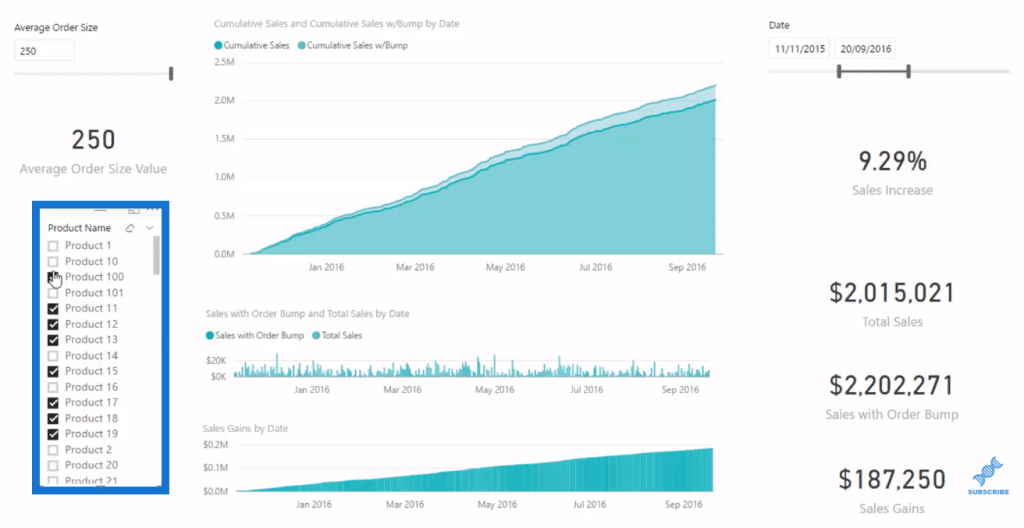
After which, you can utilise the power of the data model, as we did in the example. We are just adding more products because at the moment, we’re only increasing the order value of these particular products. As we add the products, we can see how it is going to impact us over any time frame.

All of these other things, such as the Dates column, the Product Name, etc., are just bringing in dimensions from the rest of our data model. We simply incorporate them into our report and create some compelling insights.
***** Related Links *****
Develop Advanced Scenario Analysis Models Using DAX In Power BI
How To Start Using ‘What If’ Parameters Inside Power BI
Complex ‘What If’ Analysis Example In Power BI Using DAX
Conclusion
This analysis is really practical and commercial, which is why I like it so much. It can add a lot of value to organizations that sell at a high frequency, fast.
You’ll be able to answer the question, if I increased my average order size, what is it going to do to my profitability? What is that going to do compared to if our average order size actually decreased?
Check it out and try and work these techniques into your own models.
All the best!
Sam


