
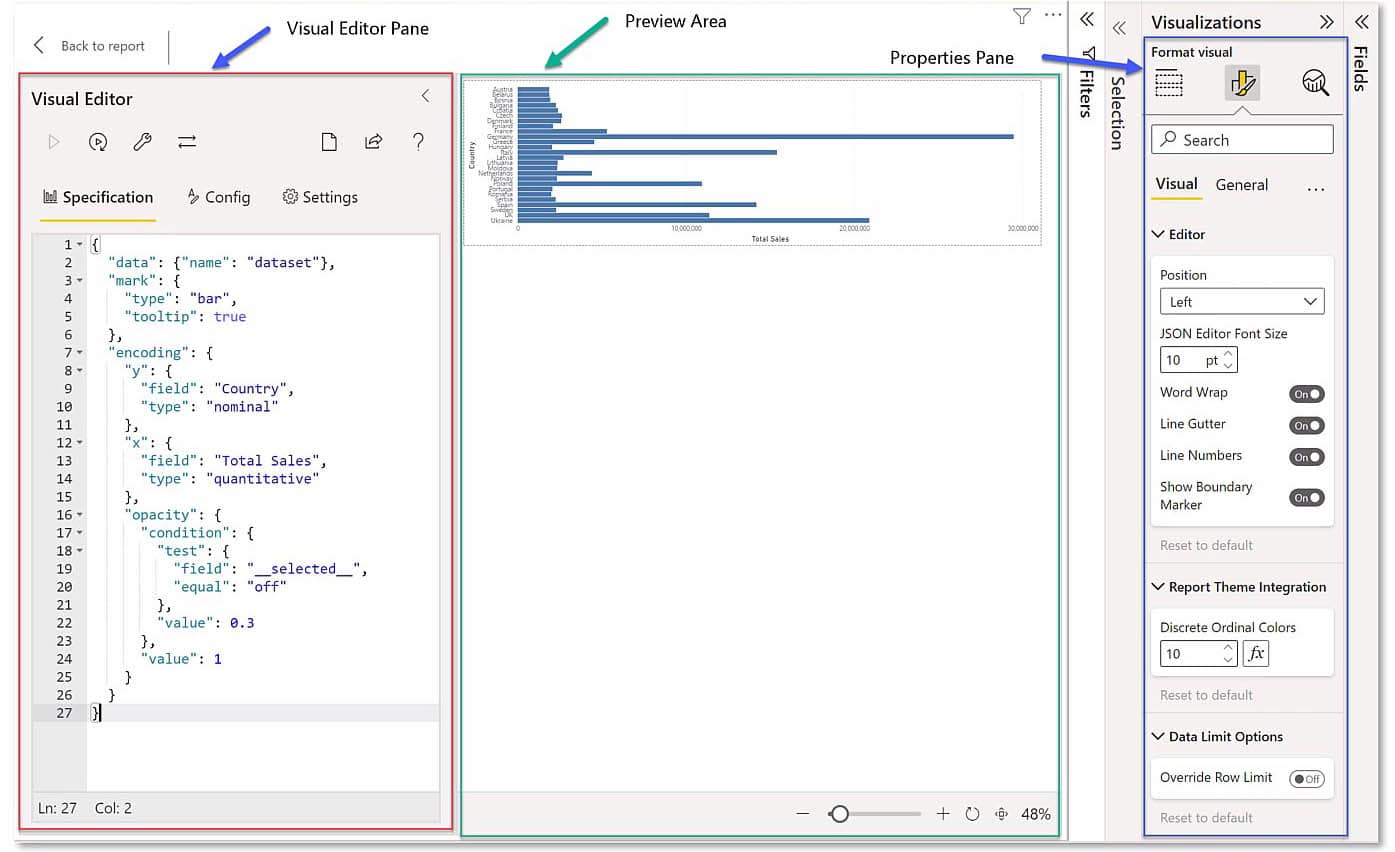
In this tutorial, we’ll try to understand the basics of Deneb Power BI declarative visualization by discussing the 3 major sections of the Deneb interface. These are the Visual Editor Pane, Preview Area, and Properties Pane.
Deneb is a tool that you can use to create visualizations with the use of declarative JSON codes in Power BI.
Deneb has similar ways of creating visuals in Power BI using R and Python. With this tutorial, you’ll be able to familiarize yourself with using Deneb for creating visualizations in Power BI.

The 3 Major Sections Of Deneb Interface In Power BI
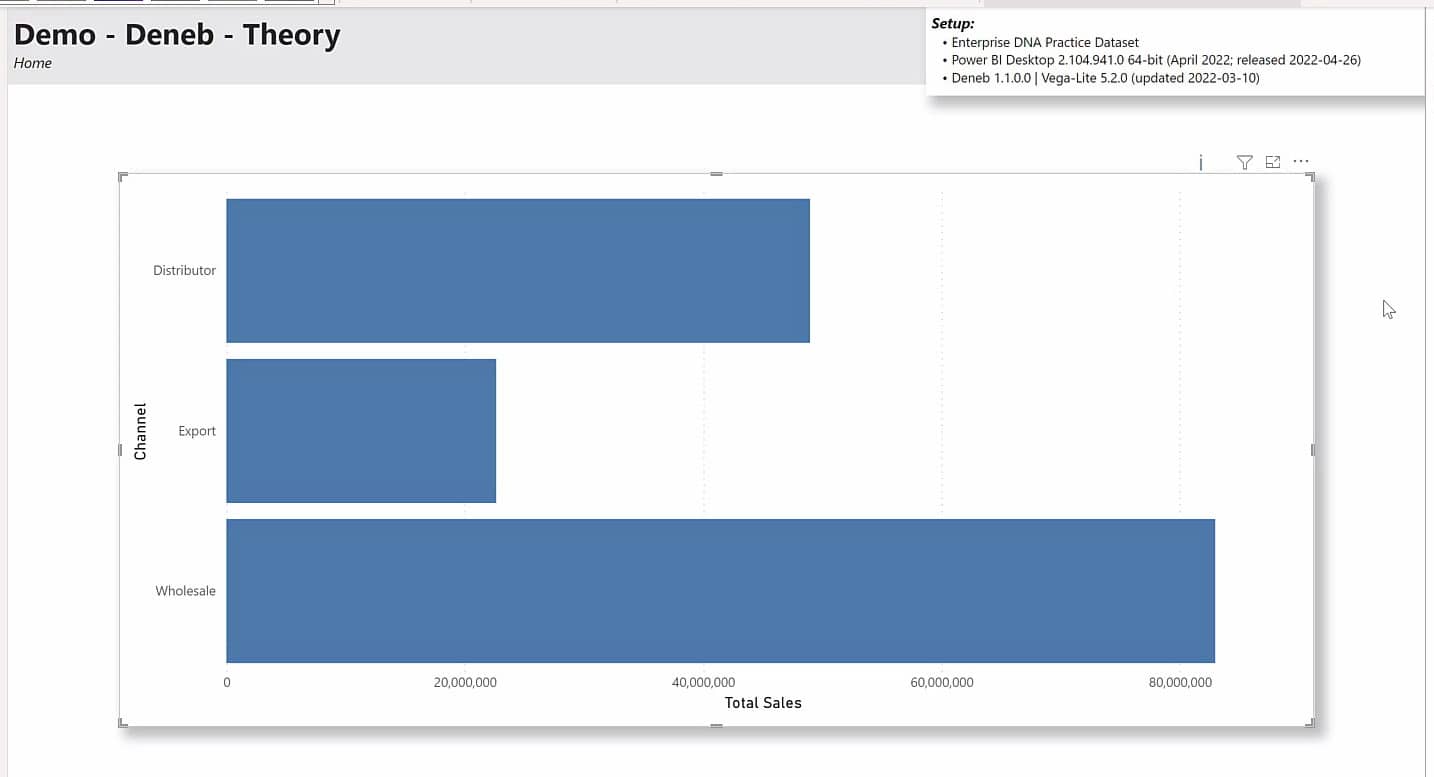
For this example, we’re going to use the Country versus Total Sales bar chart to demonstrate the major sections of the Deneb interface.

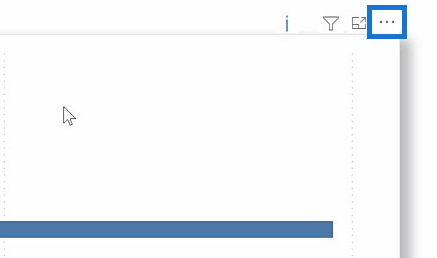
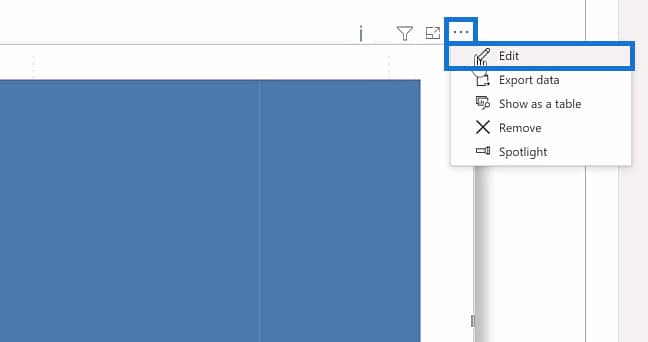
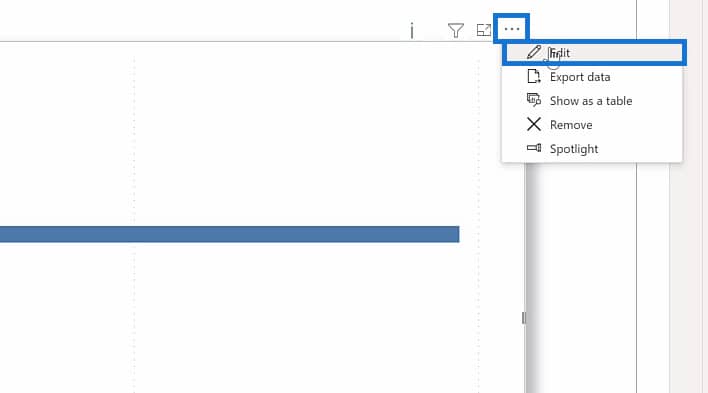
In order for us to see the 3 major sections of the Deneb interface, we must click on the ellipses icon from the upper right corner of the bar chart.
After that, click the Edit option.
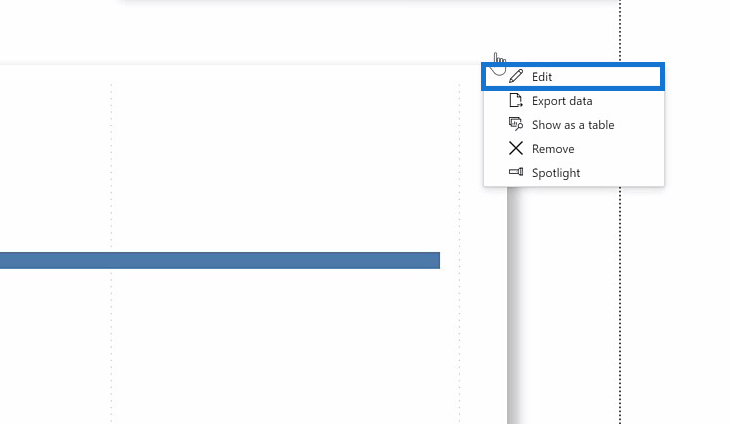
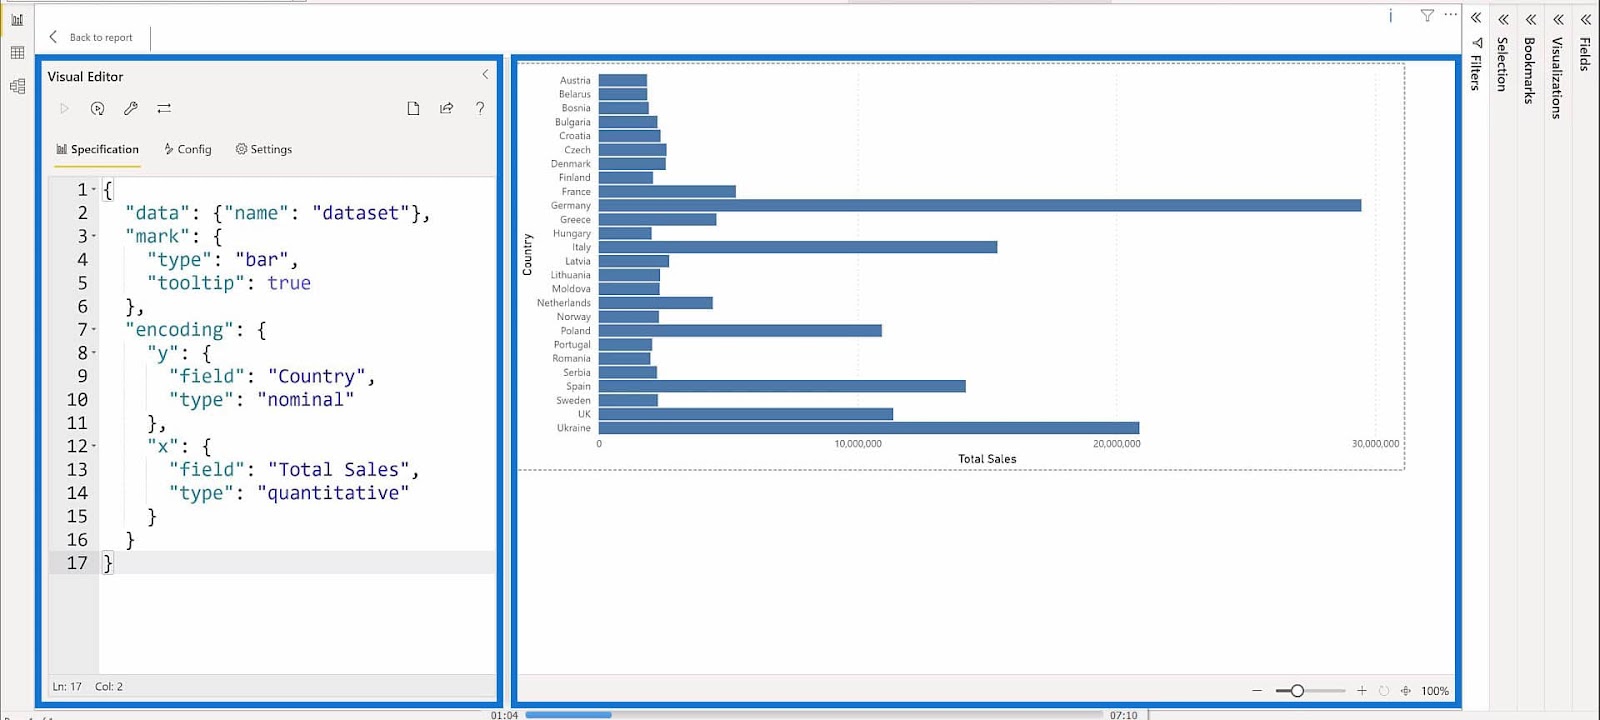
Once we click the Edit option, we should see the Visual Editor pane and the Preview Area.
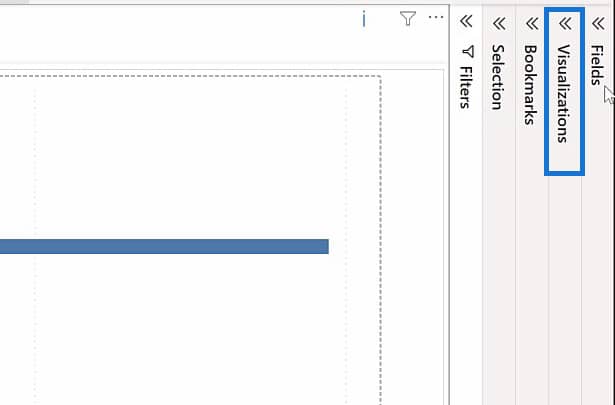
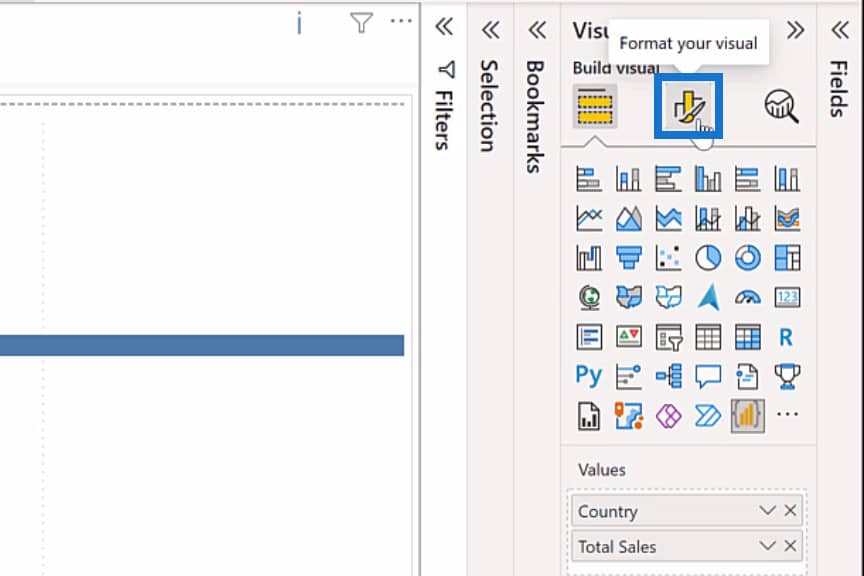
For us to see the Properties Pane, we need to expand the “Visualizations” on the right side of the Preview Area by clicking on it.
Under Visualizations, click on the Format your visual option.
Then right-click on the Editor.


Lastly, select the Expand all categories option.
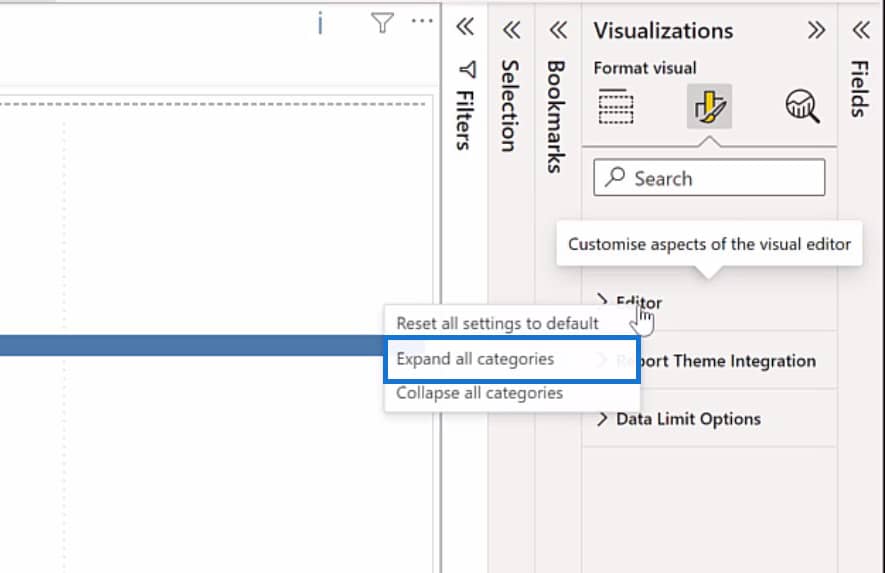
After performing these steps, we should see the Properties Pane.
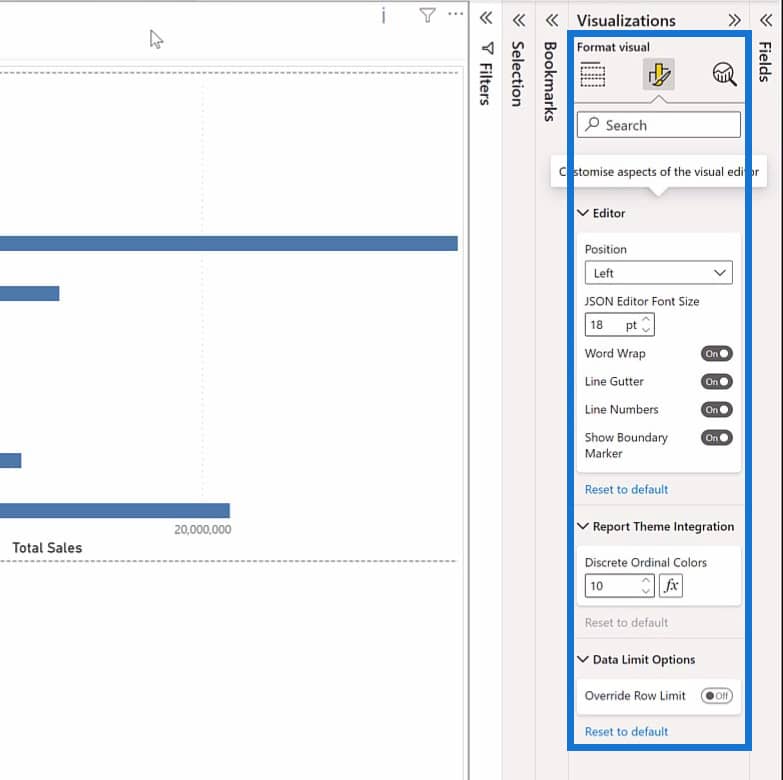
Overall, this is how your interface should look like after bringing up the Properties Pane.
Useful Features In The Deneb Visual Editor Pane
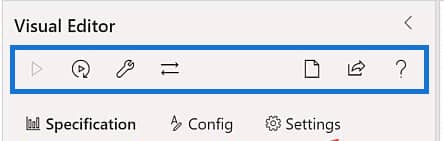
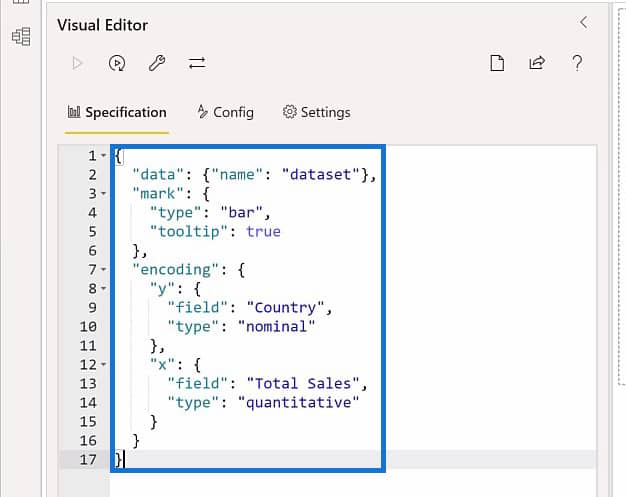
In the Visual Editor pane, we’ll see a set of icons—play, auto-apply, format, mapping, new, template, and help.
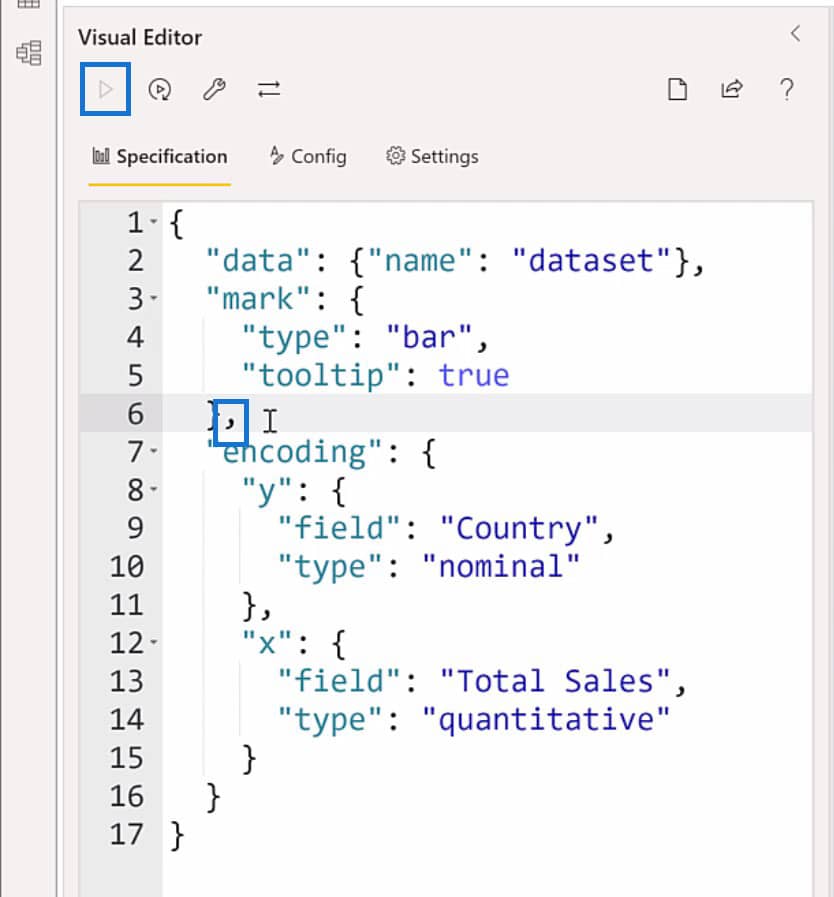
The play icon is used to apply the changes we’ve made in our JSON code. There are times that this icon is grayed out unless you make changes in your code. For example, I’ll delete the comma in our JSON code.
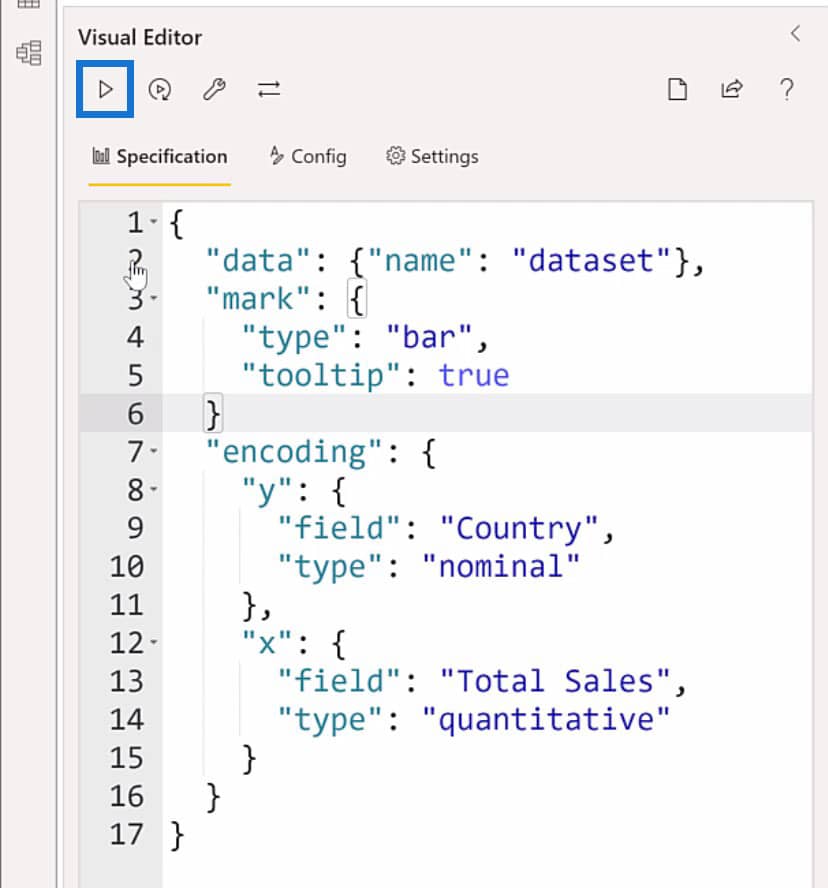
Notice in the screenshot below that the “play” icon is now active after deleting the comma in the code.
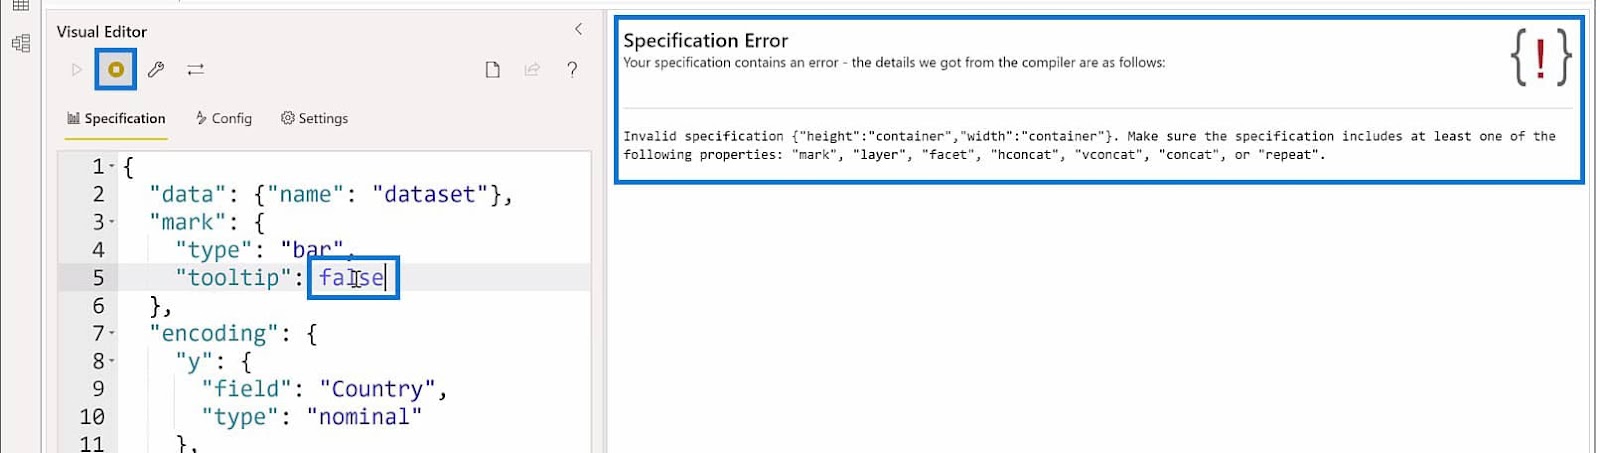
The Auto-apply icon is used to automatically apply the changes as you enter JSON codes. You can toggle this on and off based on your preference.
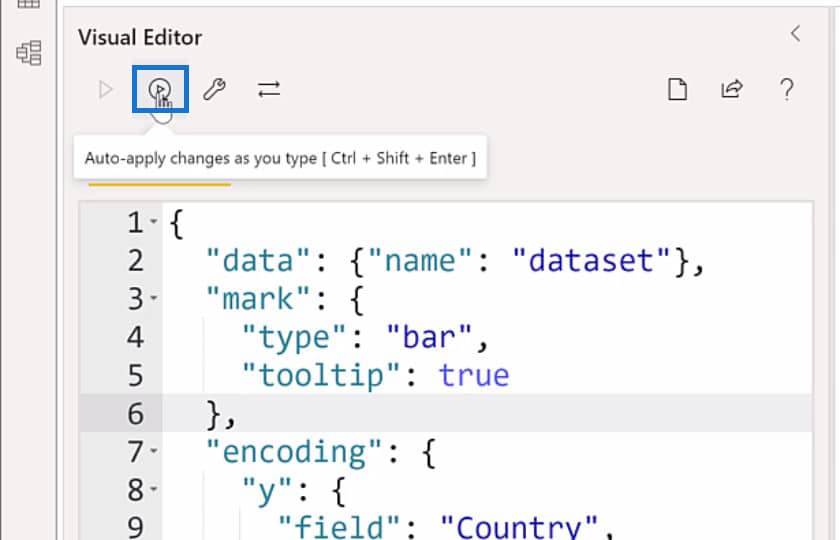
This is what the Auto-apply icon looks like when toggled on. In the Preview Area, you’ll see that by changing the tooltip value from true to false, an error appears because the change is not yet finalized.
The Repair and Format JSON icon, on the other hand, works on repairing your JSON code with the proper format. It will fix the code whenever you have missing commas, angled brackets, colons, and others.
To demonstrate how it works, I’ll add some extra space on the code and click on the Repair and Format JSON icon.

Upon clicking the Repair And Format JSON icon, it should rectify and remove the extra spaces that I’ve added in the code.

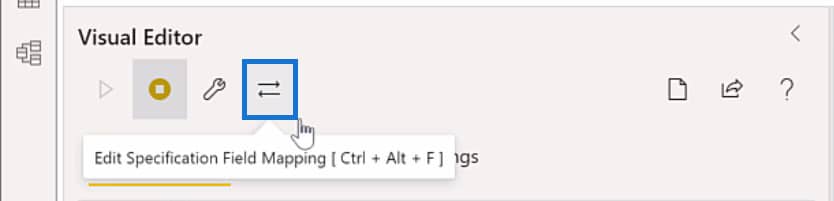
The Edit Specification Field Mapping icon is used to make changes in the mapping of Power BI fields.
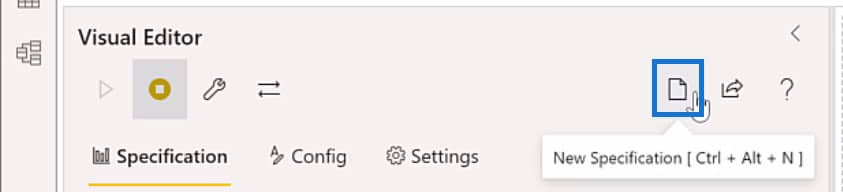
Utilizing the New Specification icon will replace the current specification and configuration that you’re working on. This is merely for creating a new specification.
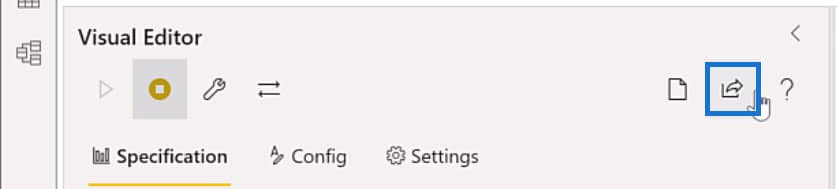
The Generate JSON Template icon is usually used to create a JSON template for exporting or saving your work or for reuse.
Lastly, you can use the Help icon to open the documentation regarding Deneb Power BI.

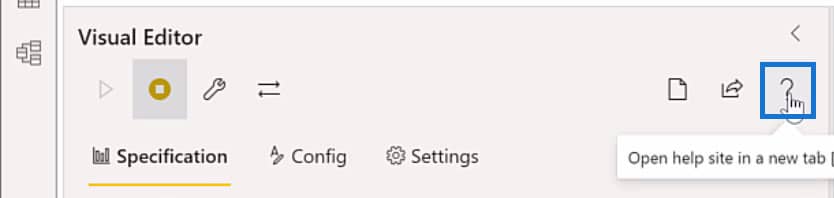
If you click on this icon, a dialog box will appear that tells you to open the documentation to a new browser. Just click OK when you see this.
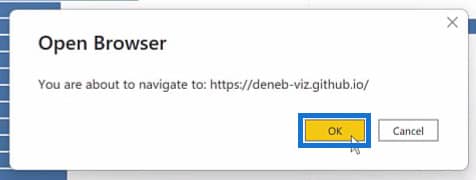
Then you’ll be taken to the Deneb page for the documentation that you need.

Modifying The Settings For Field Mapping
Let’s now modify the settings for field mapping in Power BI. First, let’s duplicate the Home page. To do this, right-click on the Home tab in the lower left corner. Then select Duplicate Page.
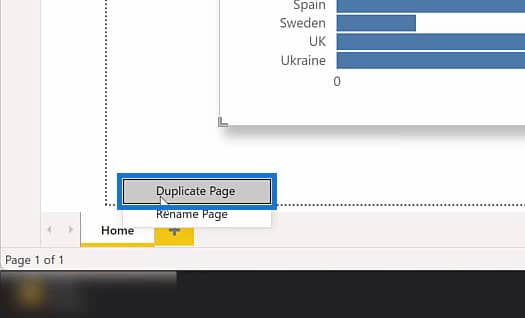
As a result, you will have a copy of the Home page.

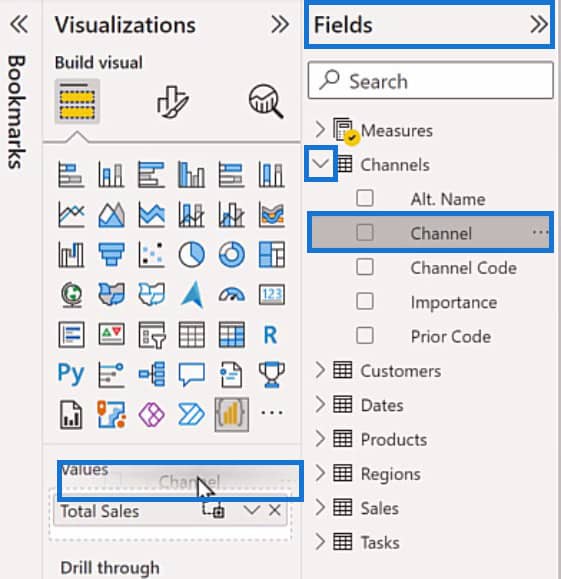
After that, let’s change the available fields for our visualization. Click on the bar chart and you should see the Values in the Properties Pane.
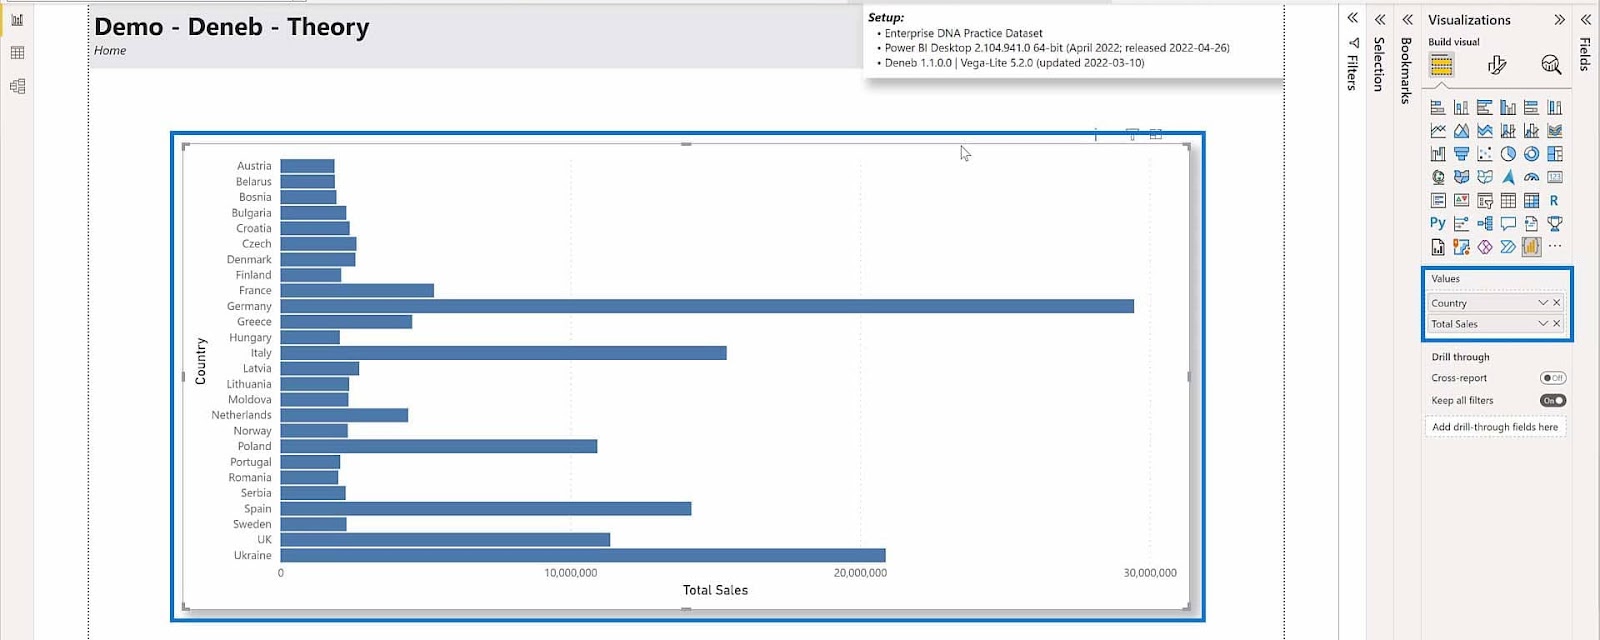
In the Properties Pane, deselect the Country field under Values by clicking on the X icon.
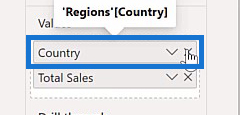
Let’s expand the Fields pane, click on the dropdown for Channels, then click and drag the Channel field to the Values.
Next, click on the ellipses icon in the upper left corner of the bar chart and select the Edit option.
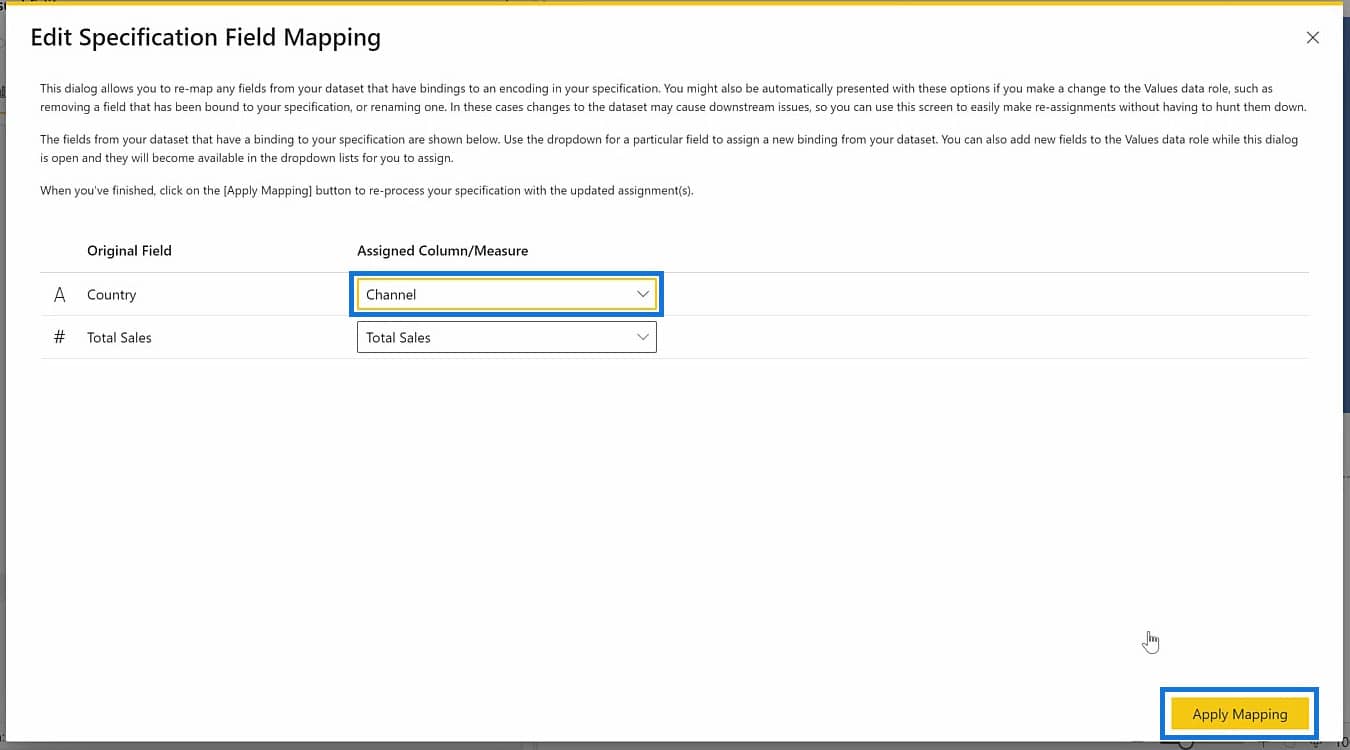
Since we’ve made changes to the fields, a mapping is required for us to update the fields that we need to map on the visualization. In this case, we need to assign the Channel field to replace the Country field. Click on Apply Mapping once you’re done assigning the new field.
After applying the mapping, click on the Back to report button for the full preview of the changes we made to the visualization.

Doing the process of updating the fields for your visualization will save you time rather than changing it manually in the JSON code.
The Deneb Preview Area And Its Zoom Features
The Preview Area is where we can see the visualization as we edit the JSON code. You can adjust the zoom level of the Preview Area by utilizing the zoom features on the lower right section of this pane.
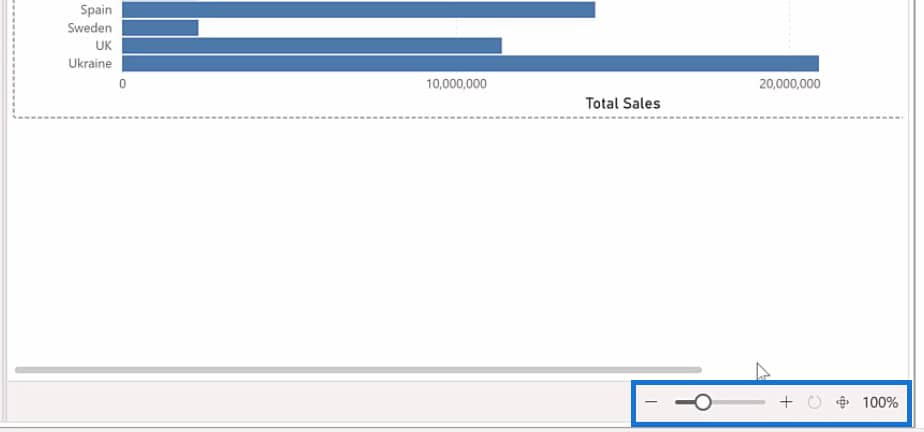
To see the zoom features, you need to enter the Edit mode of the bar chart in the Preview Area.
You should see the zoom features after you choose the Edit option.
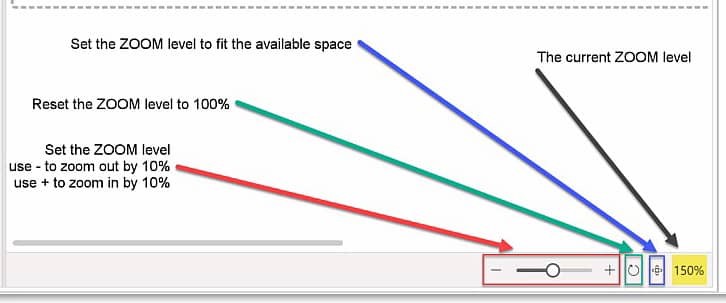
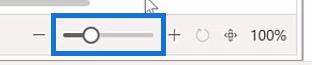
The minus (-) and plus (+) symbols will decrease or increase the zoom level by 10%.

Utilize the zoom slider if you want to gradually increase or decrease the zoom level of the Preview Area.
The circular arrow is used to set the zoom level to 100%.

The icon next to the circular arrow is used to fit the preview of the visualization to the available space in the Preview Area.
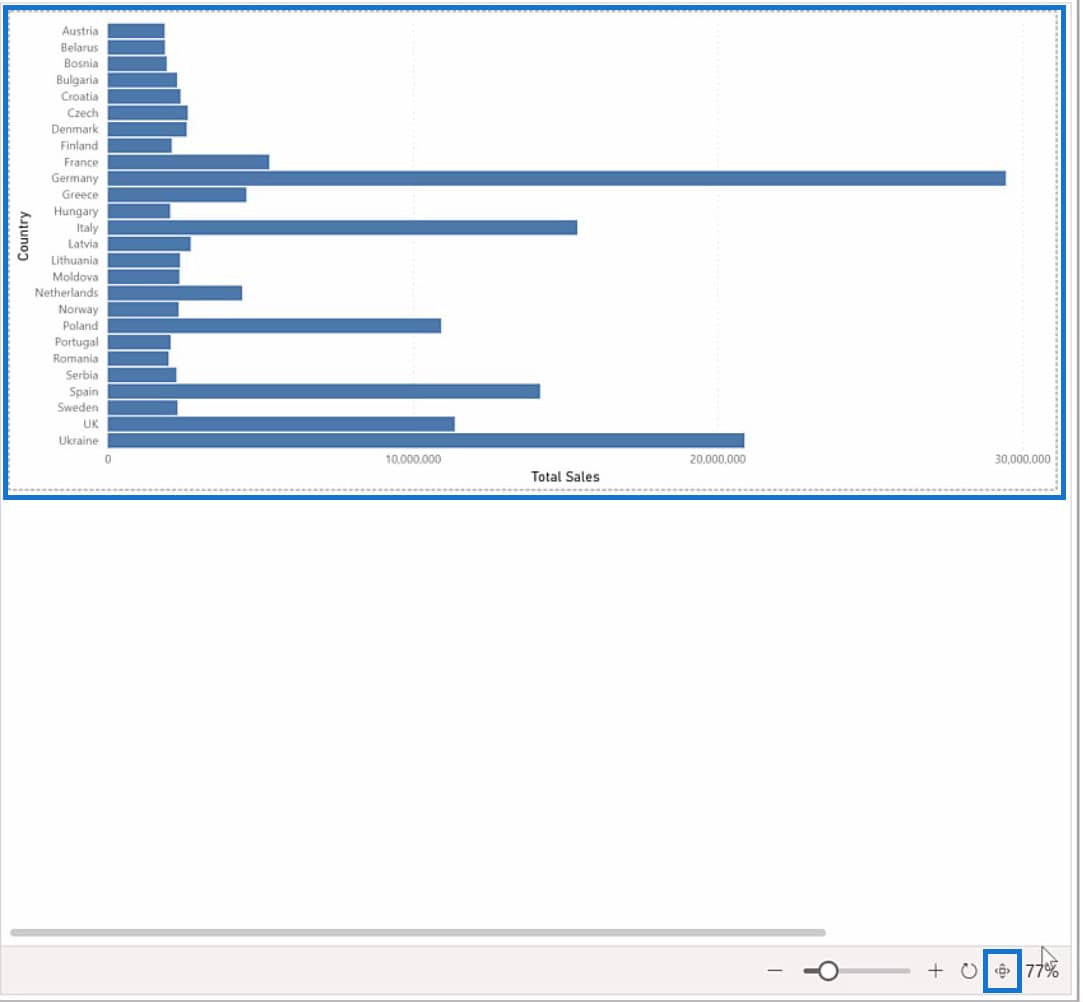
Lastly, the number with a percentage (%) symbol tells you the current zoom level that you’re using.

Using The Properties Pane In Deneb Power BI
We’re now down to the last section of the Deneb Power BI interface which is the Properties Pane. In the Properties Pane, you can set the font size of the code editor, enable or disable features like word wrap, line gutter, and line numbers, and show boundary markers. Finally, you can change the number of Power BI theme colors to use.


To increase or decrease the font size of the text in the code editor, just click the arrows present in the font size input box.
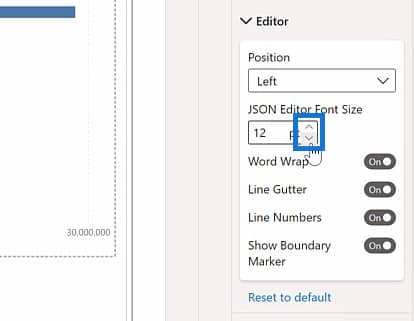
For the word wrap, line gutter, line numbers, and show boundary markers, you can just leave them all On. These features serve as guides in your code editor and the Preview Area. You may try them out yourself and decide which feature works best for you.

There’s also a Report Theme Integration feature that allows you to change the number of Power BI theme colors to use.
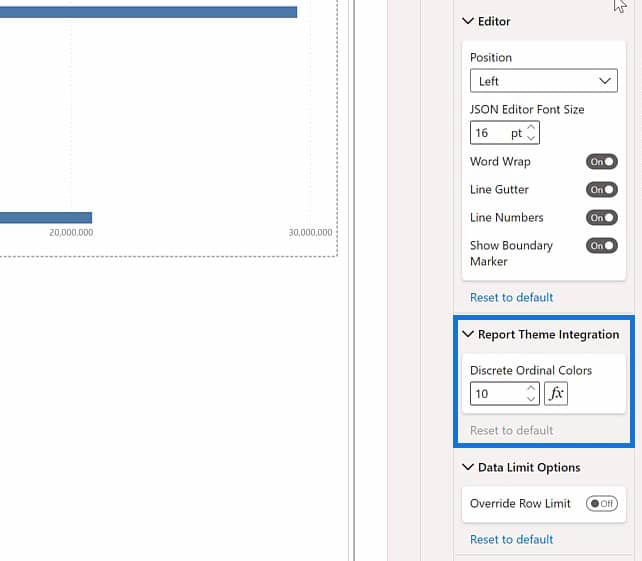
You may check the Deneb website for complete documentation about this feature.

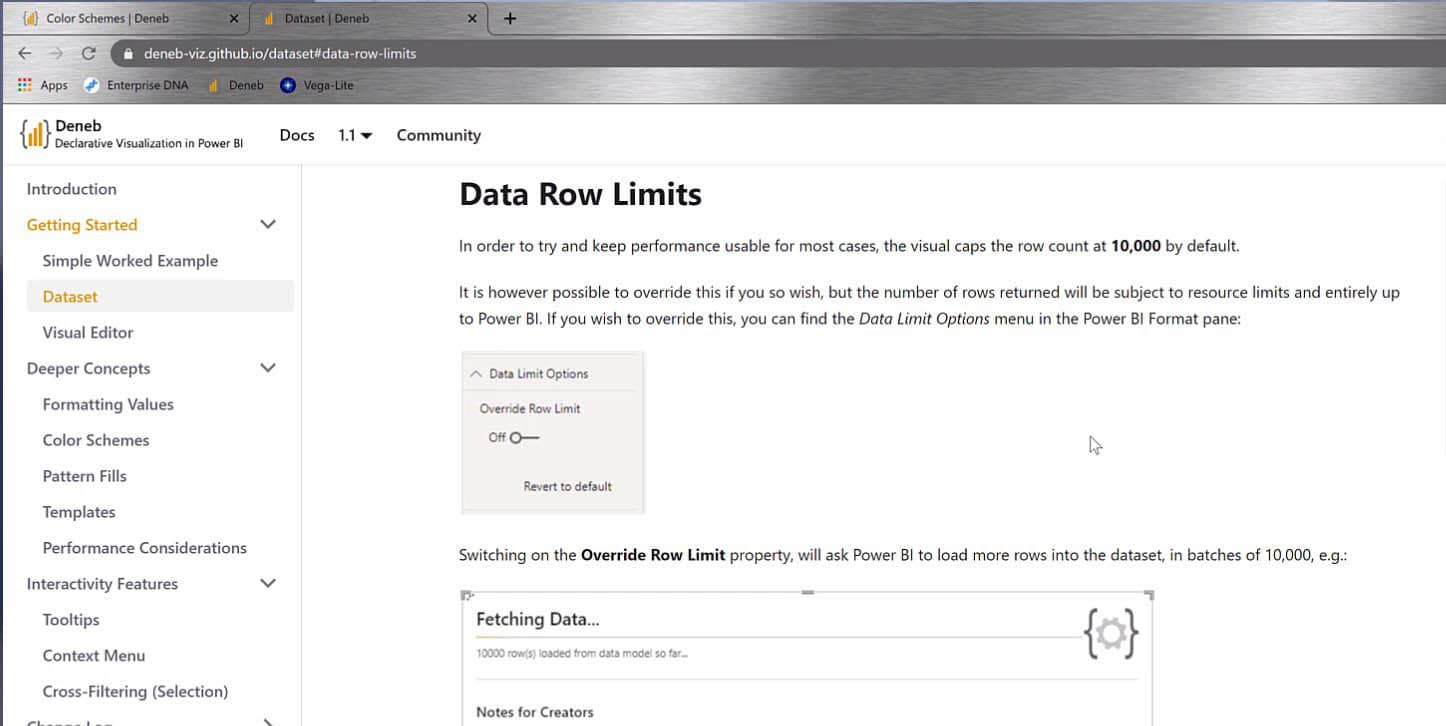
Lastly, you can override the default row limit in the Deneb Power BI visualization.

For more details regarding this feature, check the documentation on the Deneb website.
Take note that the Properties Pane is particular to a visualization. It can also vary between different PBIX files or between different Deneb visualizations in the same PBIX file. A PBIX file is a document that we create in Power BI, which includes data models, visualizations, reports, and others.
***** Related Links *****
Custom Theming In Power BI
Different Bar Charts In Power BI To Elevate Your Reports
Power BI Desktop Update: The Charticulator Visual
Conclusion
To sum up, you’ve learned about the 3 main sections in the Deneb Power BI interface and how each of them works. These are the Visual Editor Pane, Preview Area, and Properties Pane. You’ve also learned about the useful features in the Visual Editor pane which include the play, auto-apply, repair and format JSON, field formatting, new specification, generate JSON template, and help.
On top of that, you were able to modify the settings for field mapping using the Properties Pane and utilize the different features inside it. This includes changing the font size of the JSON code editor, word wrap, line gutters, and line numbers, and showing boundary markers. Keep exploring the other tabs that were not covered in this tutorial to get the most out of Deneb Power BI visualization.
If you enjoyed the custom visual for Power BI content covered in this particular tutorial, please don’t forget to subscribe to the Enterprise DNA TV channel.
We have a huge amount of content coming out all the time from myself and a range of content creators, all dedicated to improving the way that you use Power BI and the Power Platform.
Greg
[youtube https://www.youtube.com/watch?v=hFKRZvjwAvI&t=1s?rel=0&w=784&h=441]


