Build DAX measures using measures. This is what I call measure branching. This technique is one of the most important development strategies that you need to learn.
Measure branching in Power BI is about creating advanced measures within a measure itself.
I always recommend that you start with simple DAX measures first so you can branch out into more advanced calculations afterwards. Quite often, these advanced calculations are not present in the raw data.
For instance, my Sales table here consisted of common columns like Order Quantity, Unit Price, Total Unit Cost and Total Revenue.
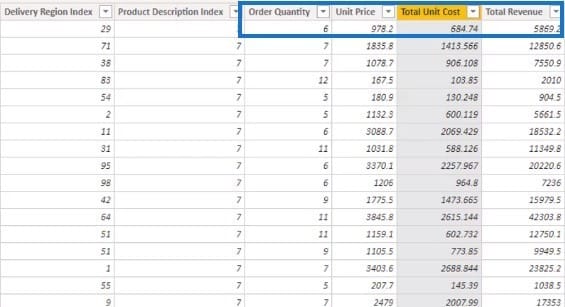
These columns are the core data needed to create core DAX measures. But you can achieve even greater insights if you use measure branching.
In the next sections, I’ll give you examples of how to apply measure branching in your DAX calculations.
Calculating Profits Using DAX Measures
In this example, I’ll try to work out my total profits using measures. Since I already have the data for total sales and total costs, this would be easy.
To do that, I’ll click New Measure and name the new measure as Total Profits.
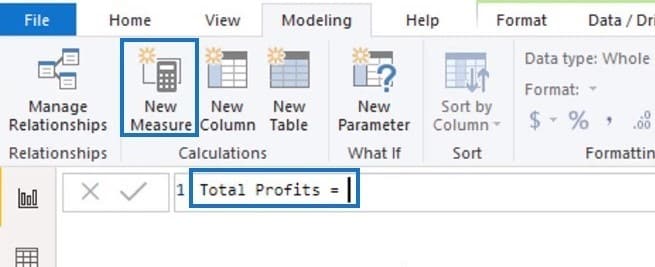
I don’t have to create this column with a calculated column because I can easily use measure branching. I can reference my measures inside the measure itself. After that, I can branch out into a separate measure again.
With the help of IntelliSense, Power BI automatically shows you a list of measures as soon as you start typing. I’ll just select the applicable measure, and then press Tab.
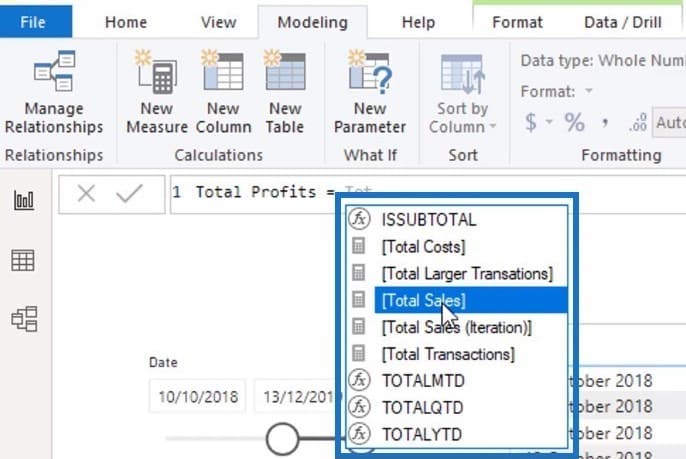
In the formula, I just have to find the difference between the Total Costs and Total Sales.
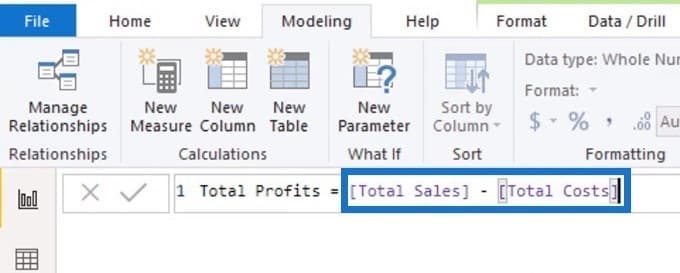
I used a virtual calculation and referenced two measures within the measure itself. That’s how I got the results for Total Profits.
More DAX Measures Using Measure Branching
In this other example, I’ll show you how to calculate Profit Margins using the DIVIDE function.
In the formula below, I referenced the Total Profits and Total Sales measures within the measure.
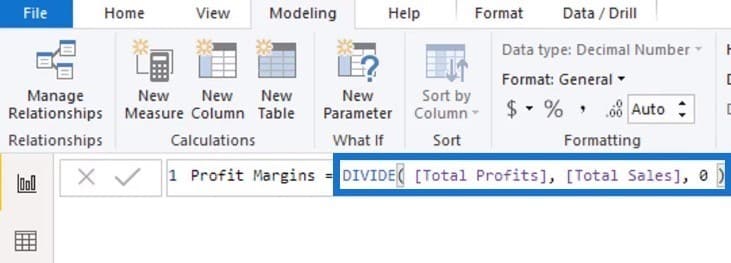
This is one of the great things about running DAX calculations using a measure. You’re not restricted to one branch. You can branch out your DAX measures multiple times because DAX will remember all the things that you referenced.
Instead of writing complex formulas, you can develop your own calculations using various measures. Just start with something simple, and then slowly integrate additional measures on top of one another.
You don’t have to make your Power BI experience difficult. You just have to learn about measure branching so that you no longer need to use long and complicated formulas.
In this next example, I’ll show you how to work on the difference between your maximum and average sales.
To do that, I’ll create a new measure for Max vs Average Sales. Using the formula, I simply have to find the difference between the Average Sales and Max Sales.
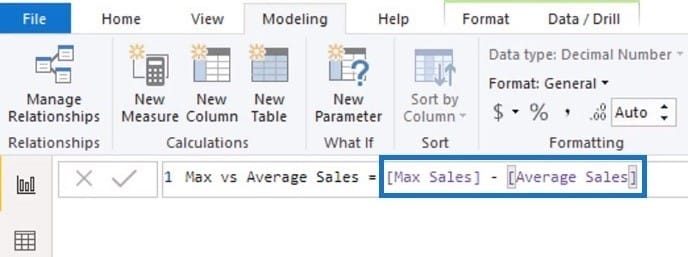
This is a simple example that shows how you can branch out from one measure to another within the same calculation. Finally, you can see the results below.

***** Related Links *****
Measure Branching: Power BI Development Strategy
Use Power BI Measure Branching To Check If Your Margins Expand As Revenue Grows
Implementing DAX Measure Groups Into Your Reports
Conclusion
The best part about measure branching is the level of flexibility that it offers. There are so many ways that you can use simple calculations to branch out into other measures.
If you want to build intuitive reports, it’s important you know how to use measure branching in your model.
Additionally, you can add time intelligence calculations with different years using the CALCULATE function. Once you learn about this technique, you can absolutely create high-quality analysis.
In the next tutorial, I’ll go over how the CALCULATE function works and why it’s so crucial in Power BI.
Sam


