
For today’s blog, I want to discuss a not-unusual situation with many of my consulting assignments for the Canadian government, where my clients require all publications to be bilingual or available in both official languages, English and French. I’ll show you how I do a multilingual Power BI report for this tutorial. You can watch the full video of this tutorial at the bottom of this blog.
Although some extra infrastructure and development were needed, this could easily be accomplished with SSRS reports. But there are some limitations if you’re trying to do the same thing with Power BI.
I want to showcase a partially manual workaround I’ve been using recently, and I’m interested in how others have dealt with the same problem, so please feel free to leave your experiences in the comments section below.

The Two Areas Of A Multilingual Power BI Report
With any multilingual report development effort, there are two main areas that require translated values: the report data and the report labels.
For the data, if one is charged with producing multilingual reports, one can hopefully access a data source that already contains the translations of data text values. As for the labels, a separate translation effort is often needed.
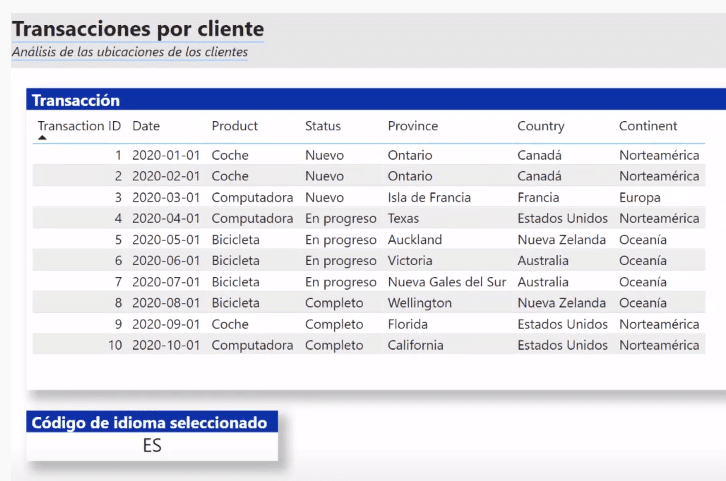
The example I’ll be showcasing today uses a multilingual approach with solutions for presenting reports in English, French, or Spanish. I’ve created a small sample data set, but please take all translations with a grain of salt.
I’m not saying that any of these are the appropriate translations, but rather they are the result of basic online translation tools. The translations here are meant only to help illustrate the technique and are presented for purely educational purposes.
Data Requirements Of A Multilingual Power BI Report
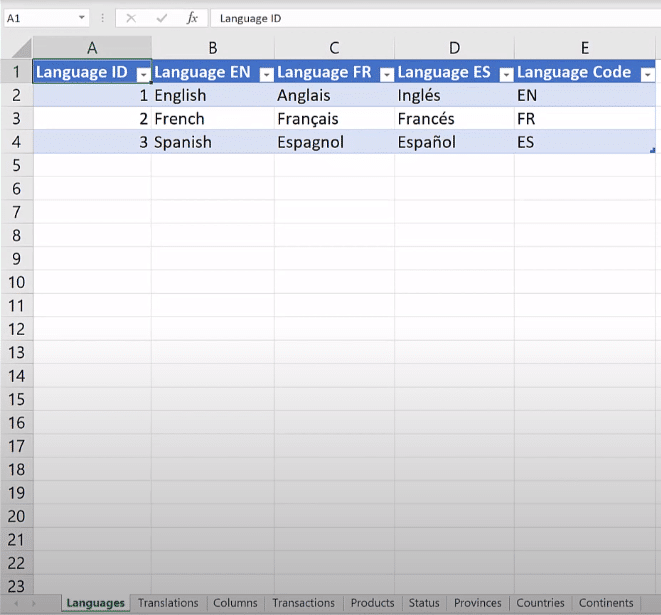
We’ll have a repository of the data and translations to present, and an Excel workbook with a tab for each data type.

First, we need a table for the languages we’re going to support…
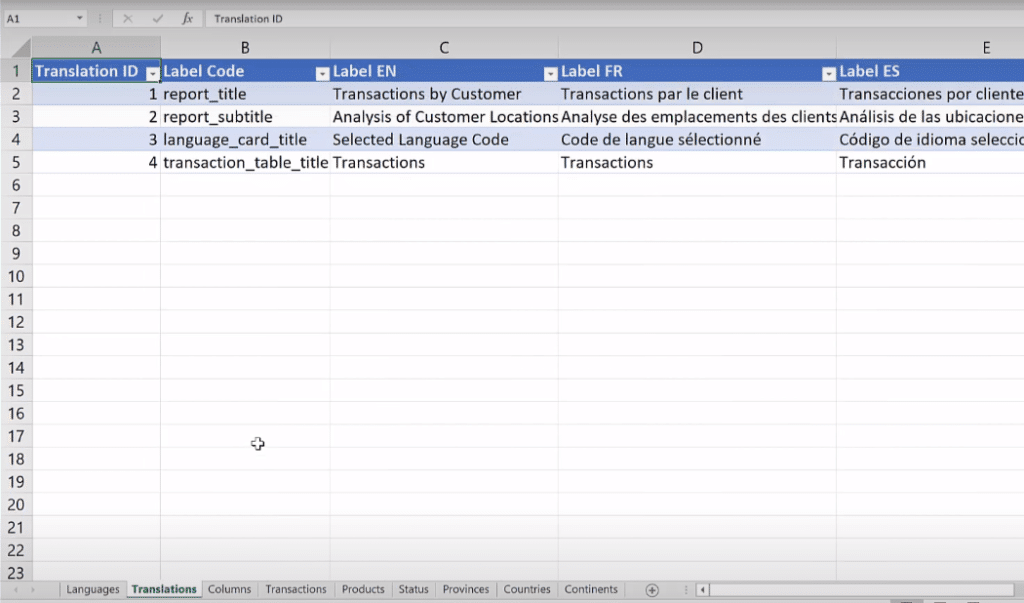
… and another tab for the translations for the labels that will be used in the report.
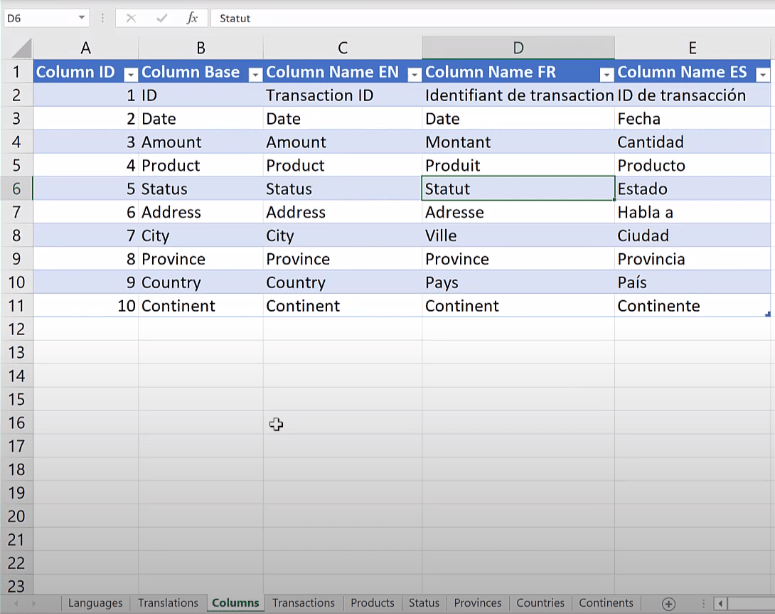
Next, we’ll need translations for the columns that we’re going to use in our visuals.
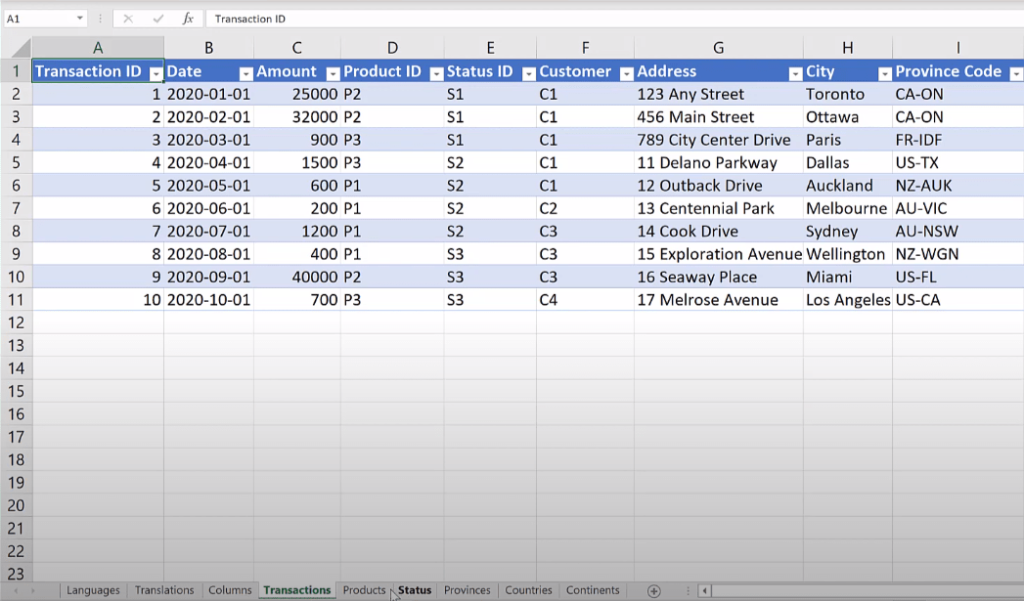
And finally, we’ll need a data source in which all of our fact table rows don’t have the dimension information, but rather, the keys to the dimensions.
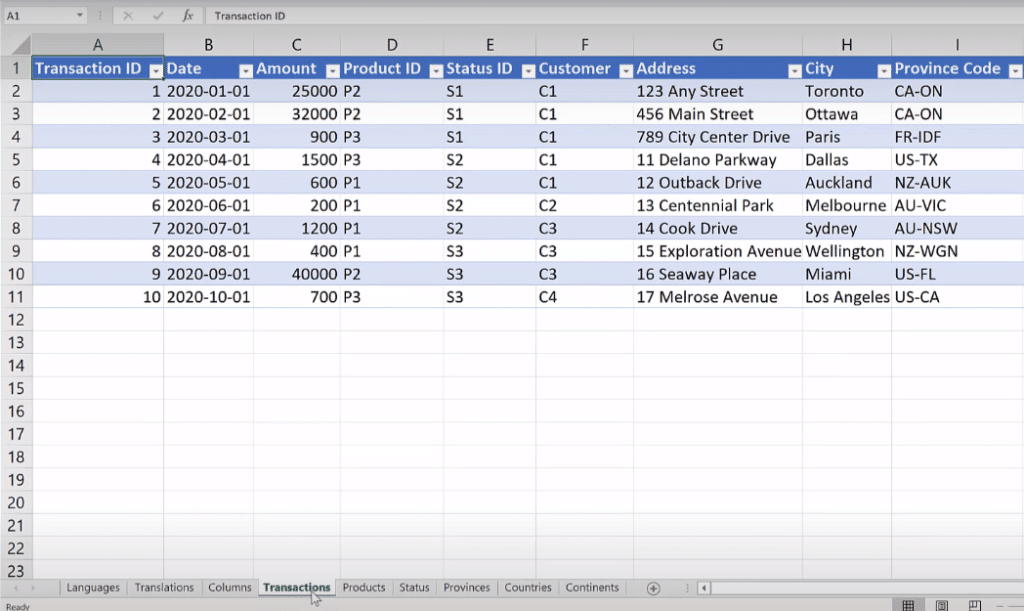
And then we need a set of dimensions with translations for all of the string values in each of the languages we’re going to support.
Loading The Data To Power BI
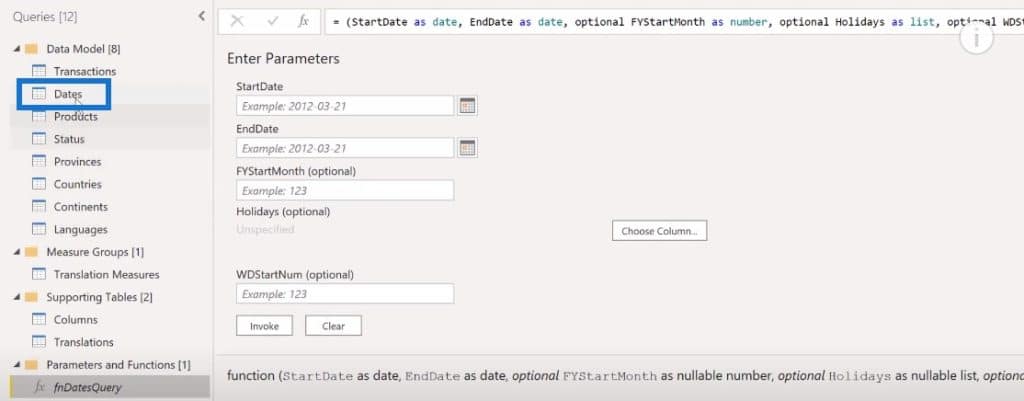
That’s it for the data. Let’s now load and model our data in Power BI. We’ll open the power query, and we can see that we have a table for each of the tabs that were in the Excel spreadsheet from earlier.
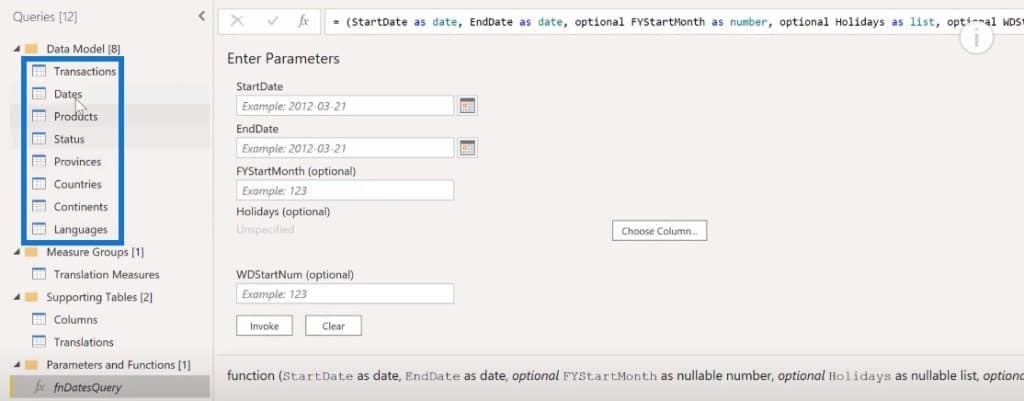
I’ve also loaded the extended date table from the Enterprise DNA forum.
Data Modeling
Let’s go to the modeling view and look at the simple data model we have. In here, we see a standard waterfall layout with dimensions on top, fact table in the middle, measure tables on the right,and supporting tables on the lower part.
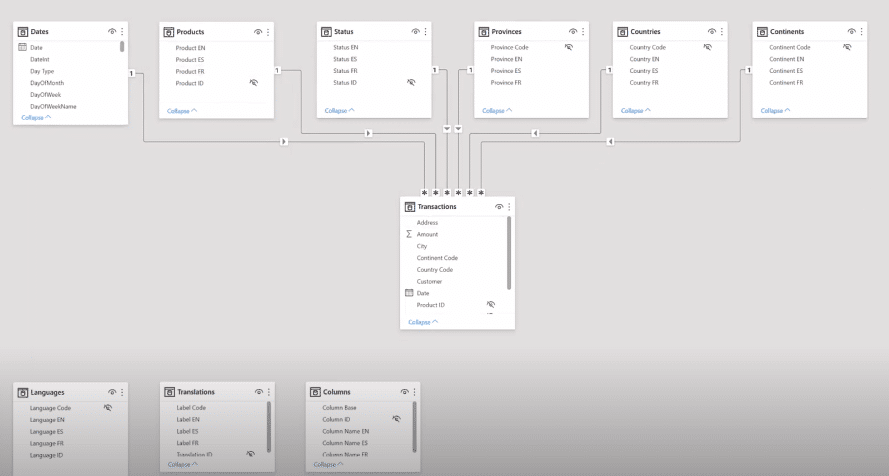
Then we’ll need a set of translation measures, one for each label we’re going to display in our report. These measures will take into account the language selected in our language slicer and then return the appropriate value for the selected language.
Here’s an example. This is by no means an optimized DAX; but rather, a measure written for clarity.
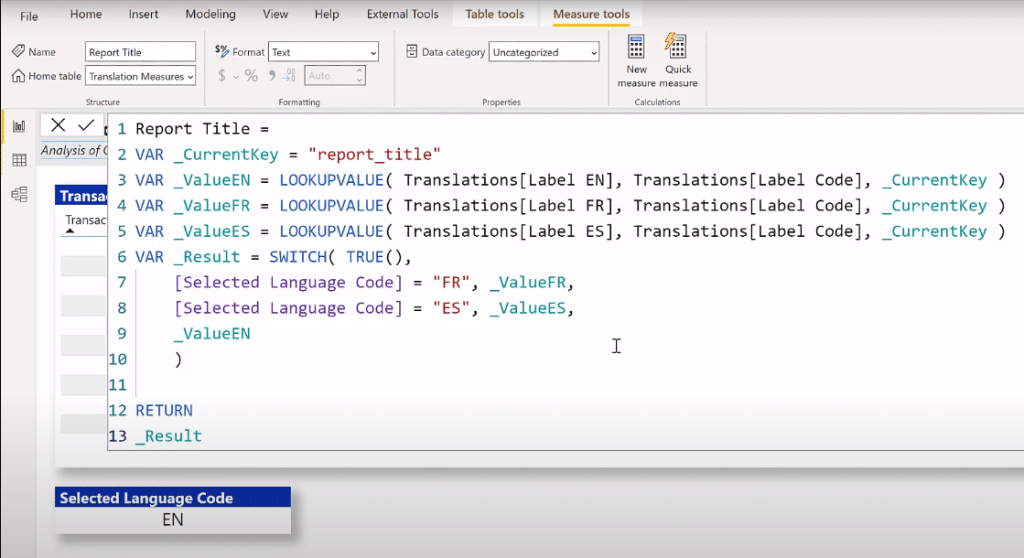
This measure does three things. First, it sets the name of the label that we’re going to be calculating. It looks up all three values for the label, and then it uses a simple SWITCH TRUE logic to return the appropriate label volume.
Creating A Single-Select Slicer For The Language Codes
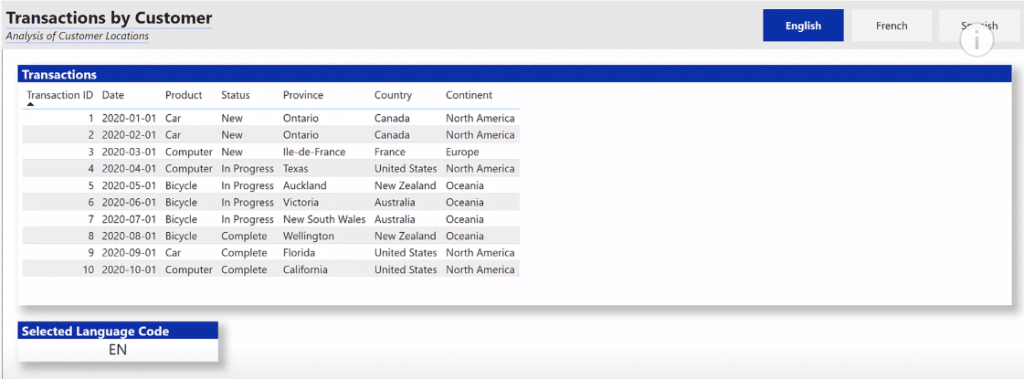
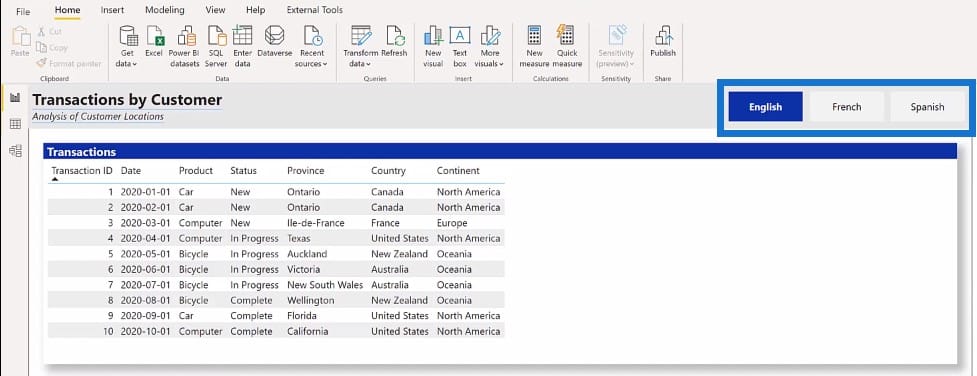
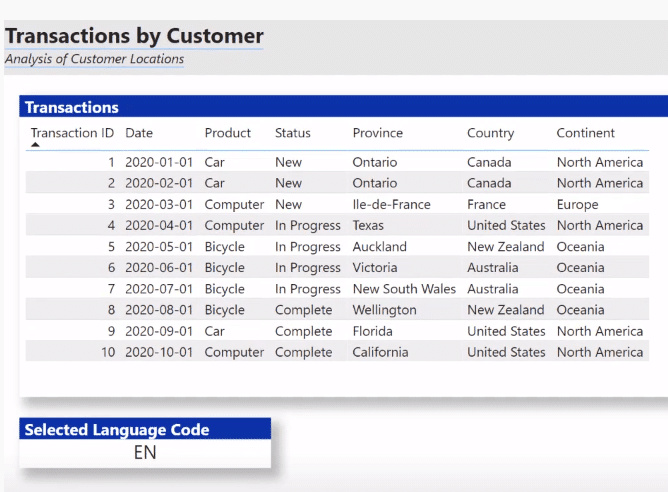
Let’s take a look at our base page setup, which is the English page. The first thing we’ll need to do is to add a single select slicer to the page for the available language codes.
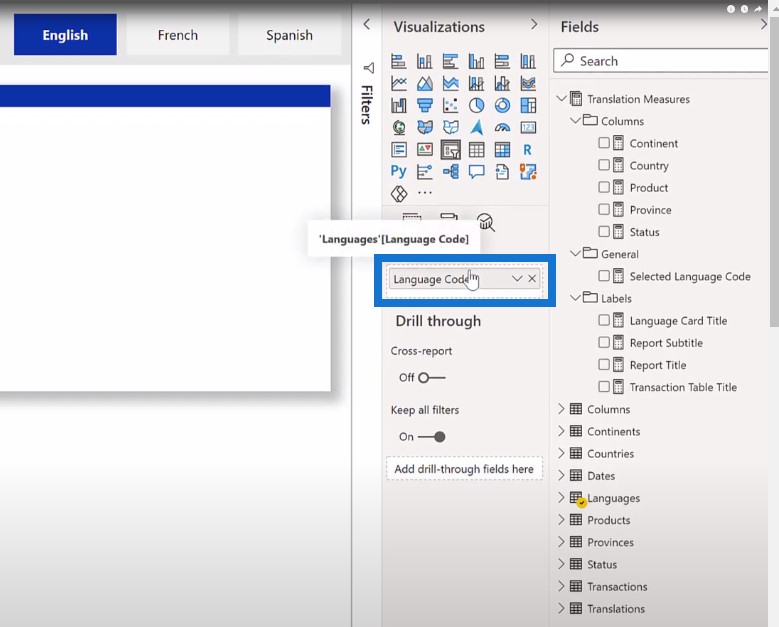
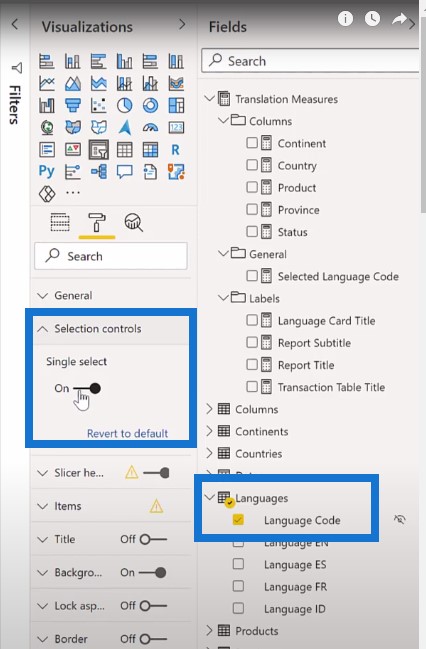
You can see how the language code comes from the Languages table, and how it has been set for a single select.
Adding The Navigation Buttons
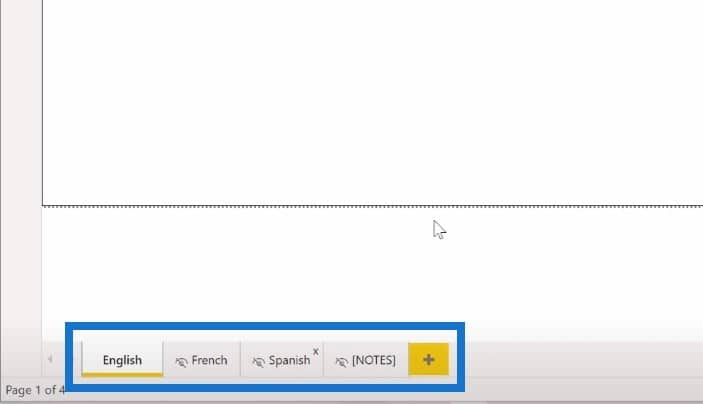
The next thing we’ll do is add three navigation buttons in the top right-hand corner of the report.
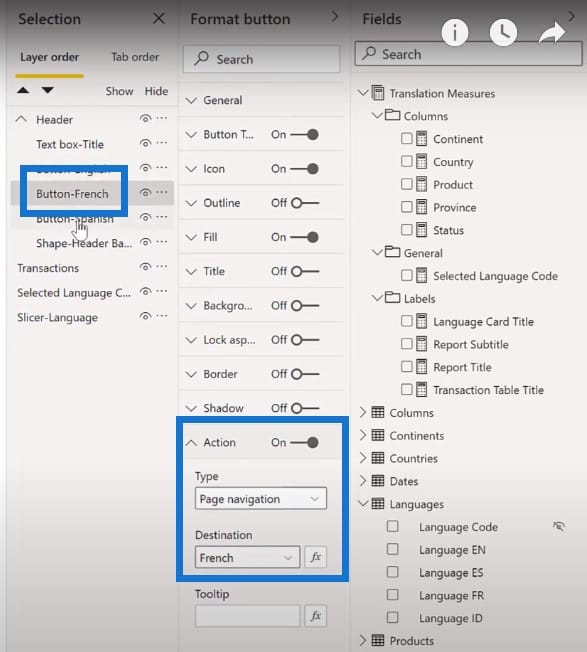
Let’s open the selection pane, then open the header group, and click on the button for French. We can see that this button has an Action Type of Page navigation and its Destination as the French page.

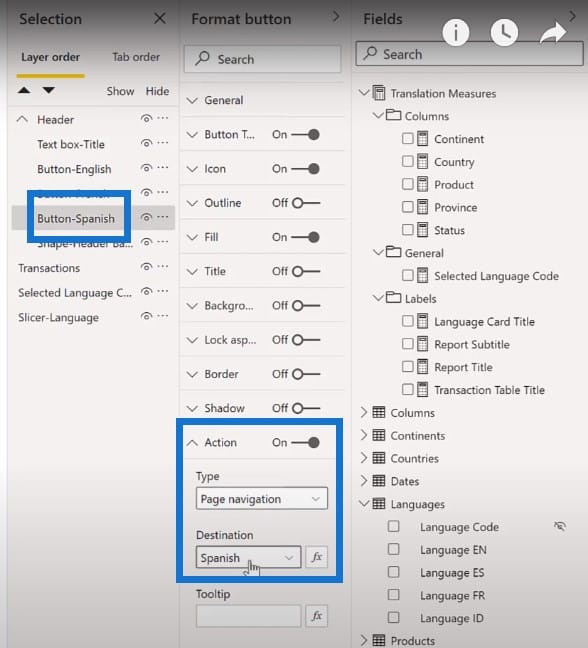
The same goes for Spanish. The Action Type is Page navigation and its destination is the Spanish page.
Adding The Title Box
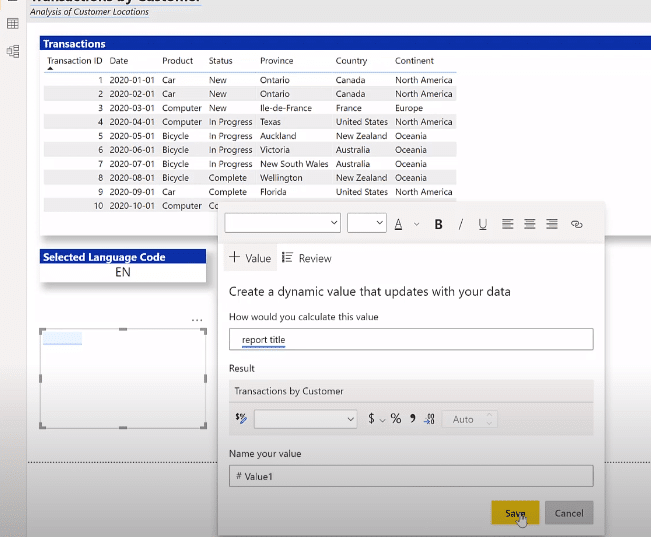
The next thing we’ll do is add a title text box. Just click on the Text box from the Home tab and add a value for the report title.
Then for the second value, we’ll add the subtitle.
We can now see the values have changed as we switch from one language to another.
Adding A Card Visual
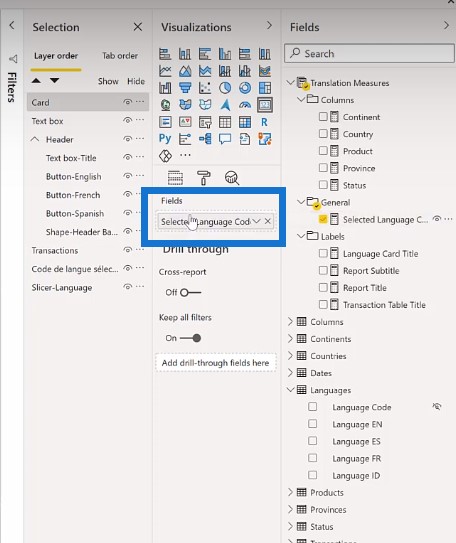
Then we’re going to add a card visual in here.
With this card, we’re going to add the selected language code into it.
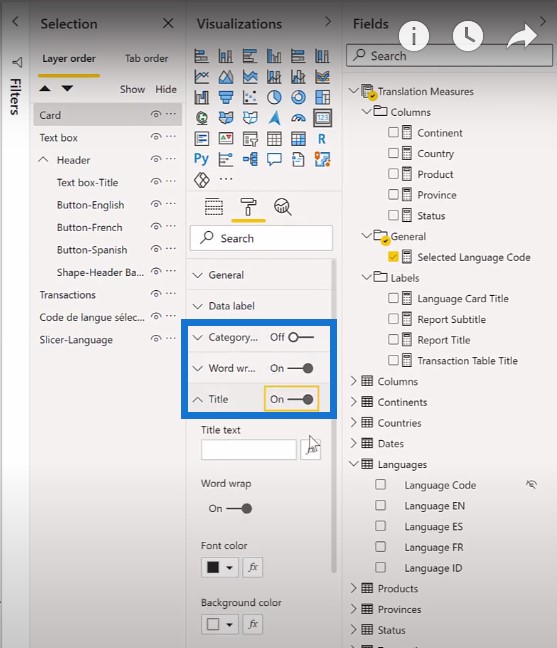
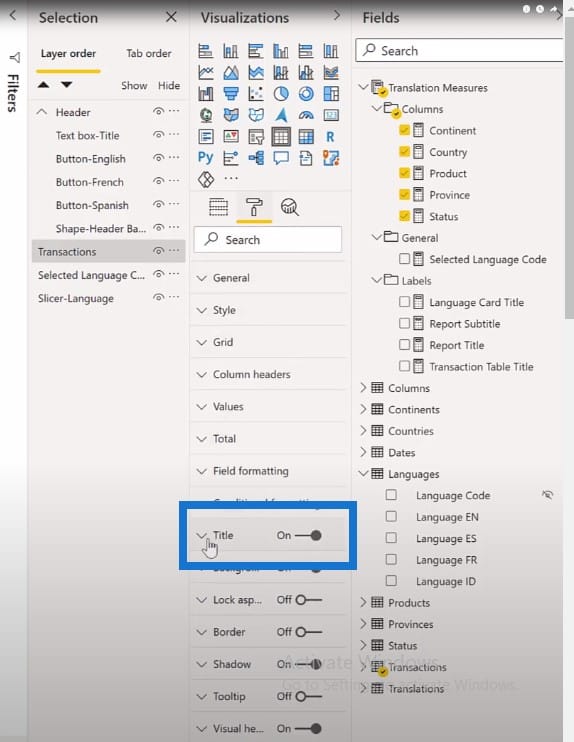
Then turn Category off, and turn the Title on.
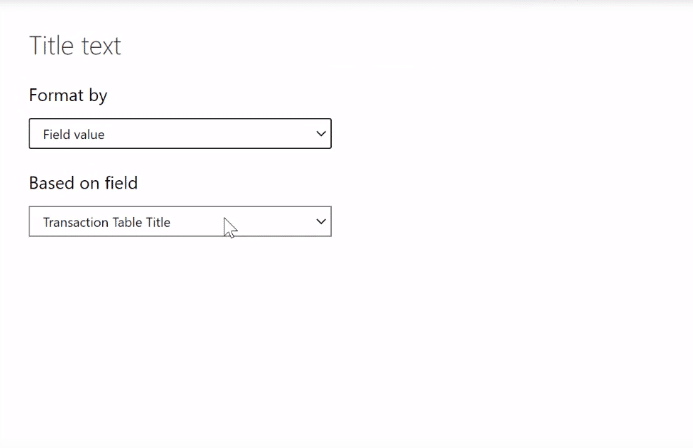
For the Title text, we’ll use the option to select based on one of my Translation Measures and have a label for the Language Card Title.
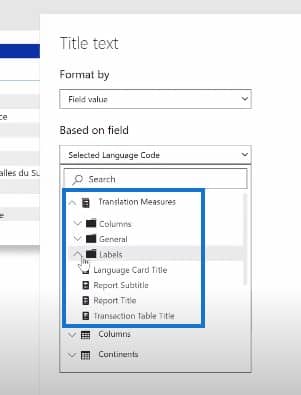
We can see again that the value changes depending on the language selected on the slicer.
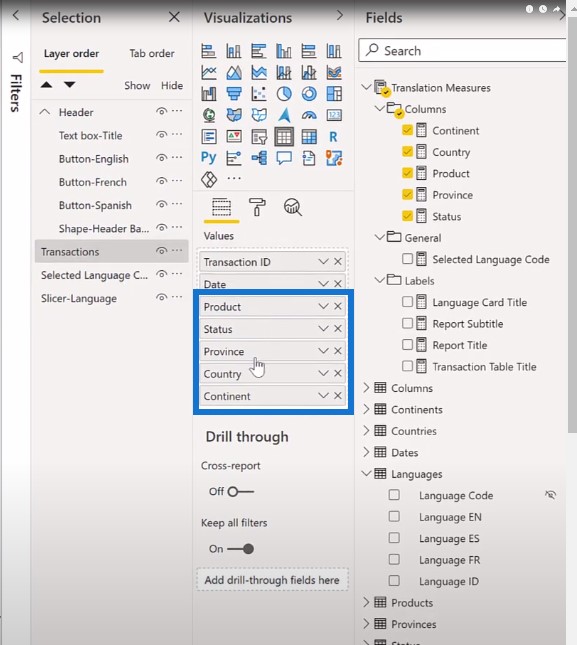
Finally, we’ll add a table for the transactions. I’ve already added the Transaction ID and Date columns.
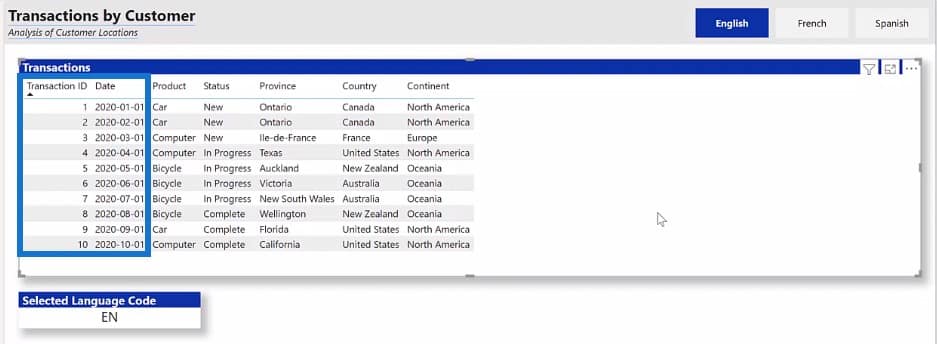
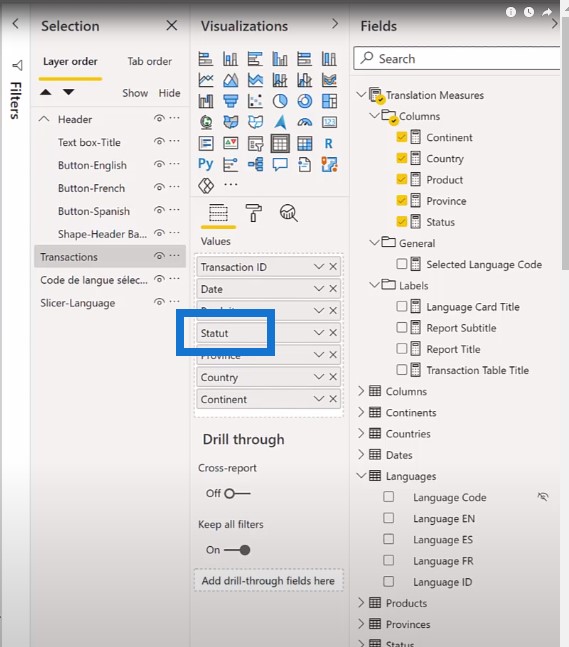
We’ll also add the translation measures for Product, Status, Province, Country, and Continent.
We’ve also used the Transaction Table Title here.
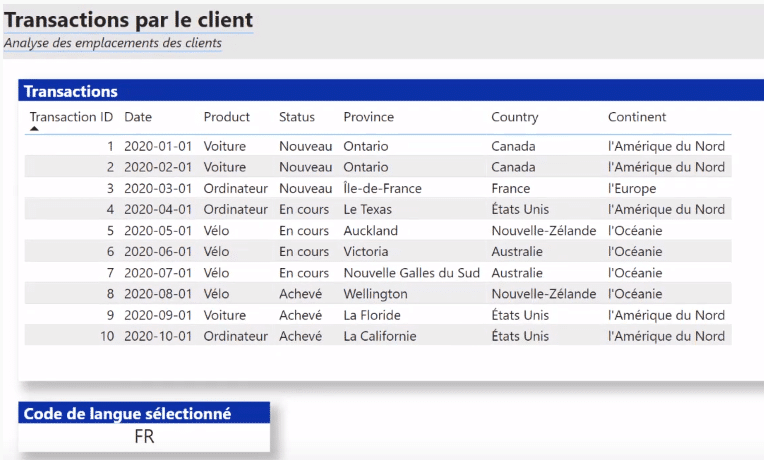
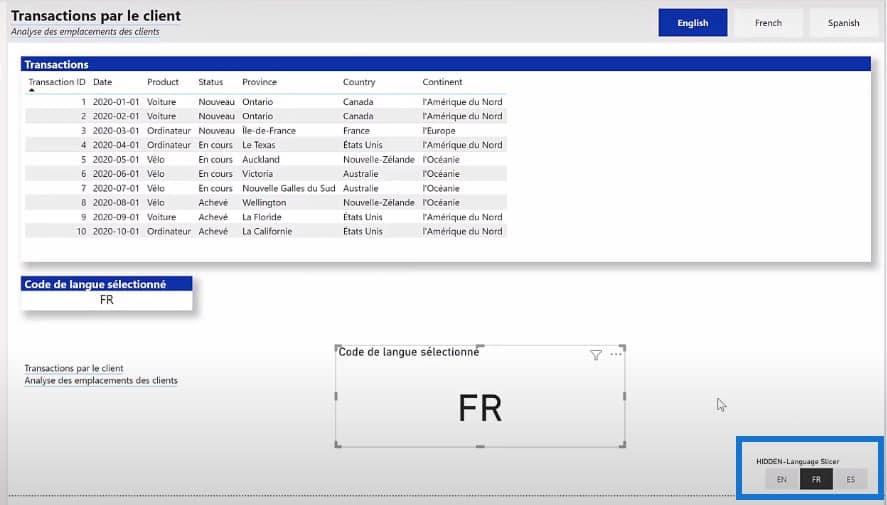
After we’ve handled the data changes and created our base page for English, we’ll duplicate it for French and rename it as French2.
We’ll then change the language slicer and be able to see that the data changes appropriately. This means that the solution remains dynamic up to this point.
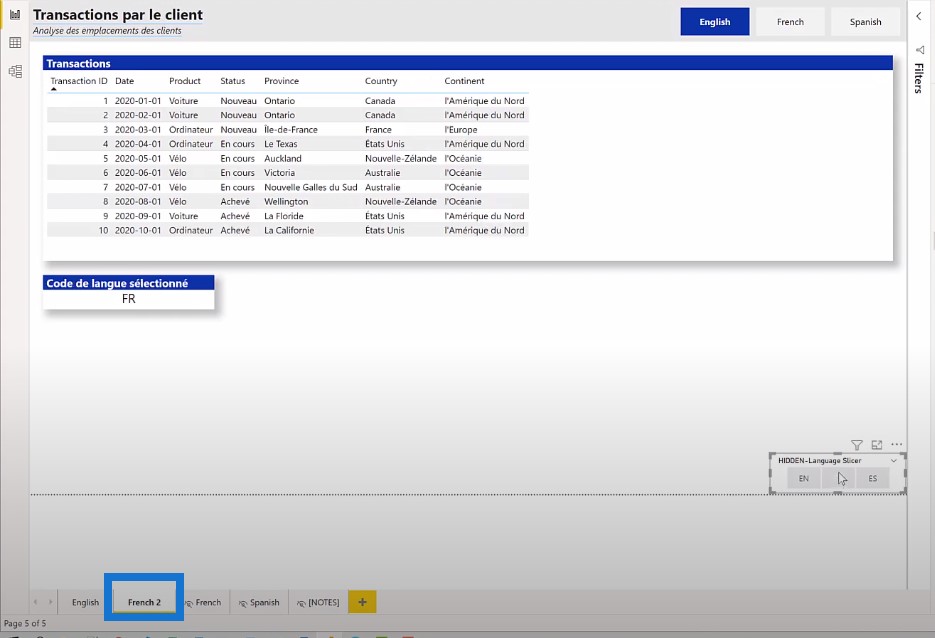
But you may have noticed how the column names in the transaction table are still in English. This is where we need to do some manual work by individually changing the column names and editing the text in the field pane.
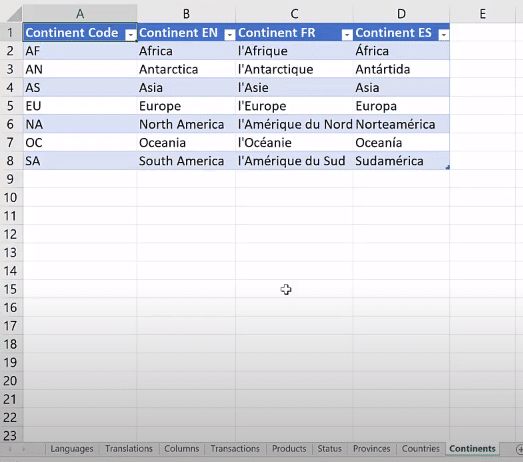
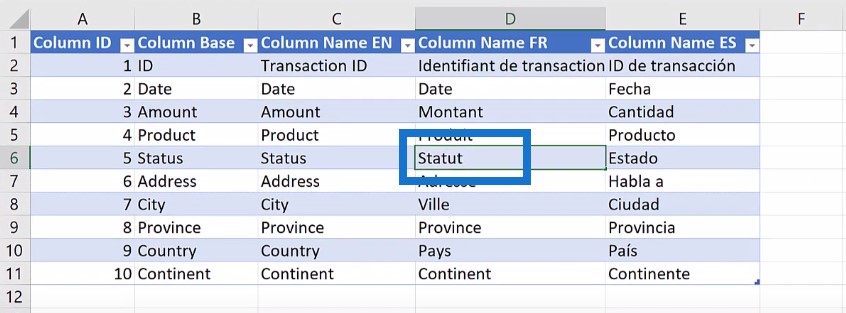
If we go back to our translation spreadsheet, remember that we have a tab for columns and we have the translations for the various column names.
We’ll grab the French text corresponding to the English column and then edit the name appropriately. First, we’ll do the product column by selecting and copying that value…
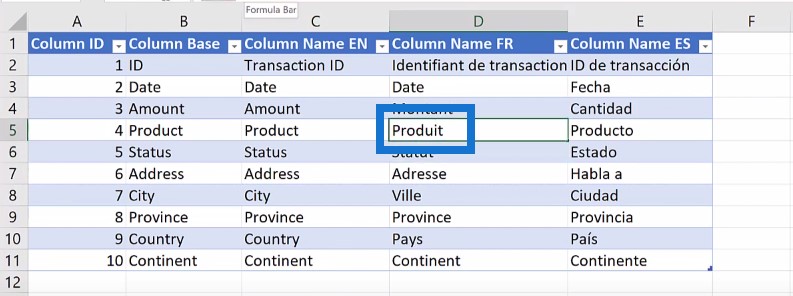
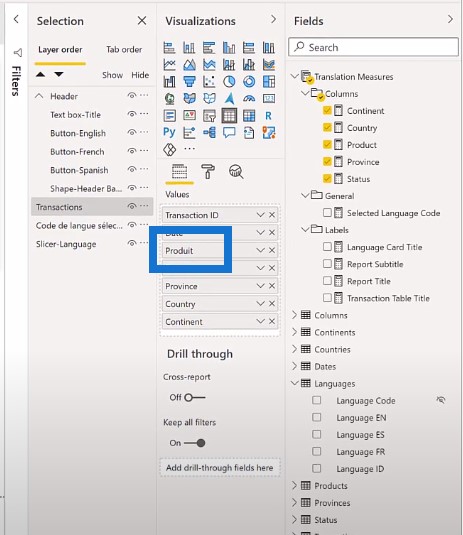
… Then go back to Power BI and paste the value to change the product column from Product to Produit.
We’ll do the same thing for Status. We’ll go back to the spreadsheet and copy the French word for status to the clipboard…
… then paste it in the Fields pane.

The entire process is a copy and paste operation, and we’ll repeat this for the remaining columns, and for the Spanish page as well.
Publishing A Multilingual Power BI Report
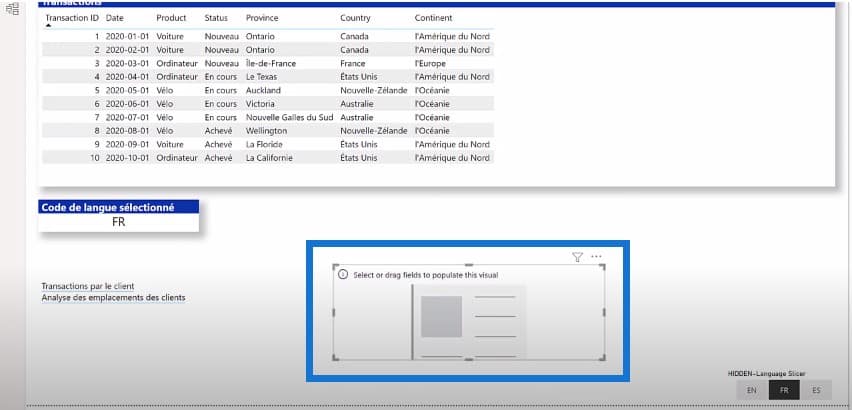
To finalize the setup of the PBX, let’s make sure we only have one visible page in English, while the French and the Spanish pages are hidden.
Now we’ll go ahead and deploy the report to our multilingual workspace in the Power BI service.
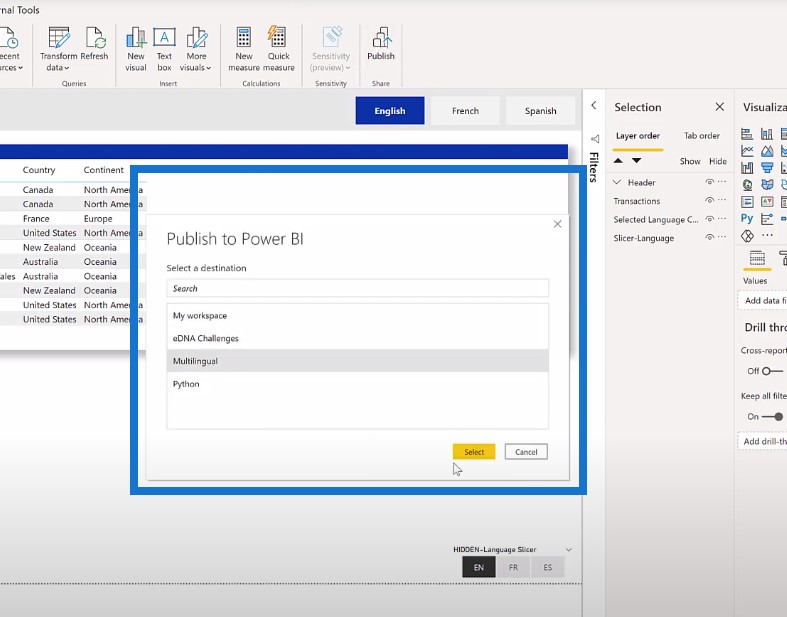
Once we’re done, we’ll go to the Power BI service and open the report we just deployed.
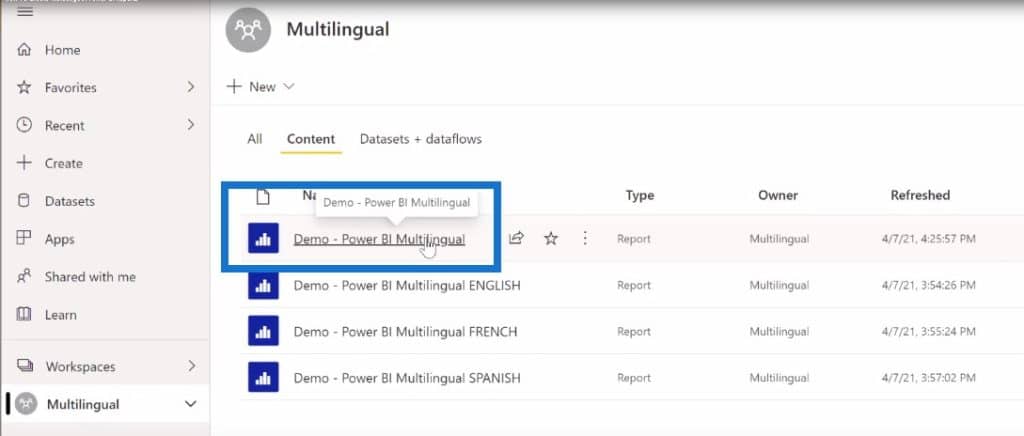
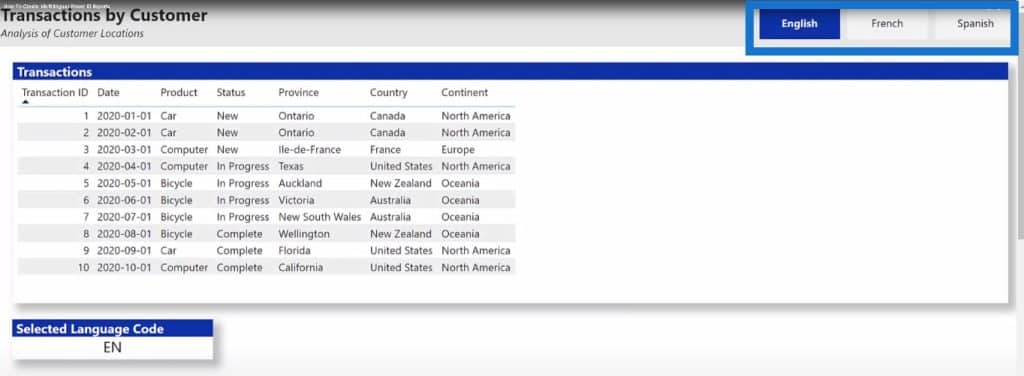
We have our navigation buttons up on the upper right corner. If I click on French or Spanish, the report is presented appropriately in the language selected.
Modifying The Report For A Single Language
So what we have here is a single report that the user can choose to view in their preferred language. But there may also be cases where the user doesn’t want to do that and would rather open a language-specific report directly.
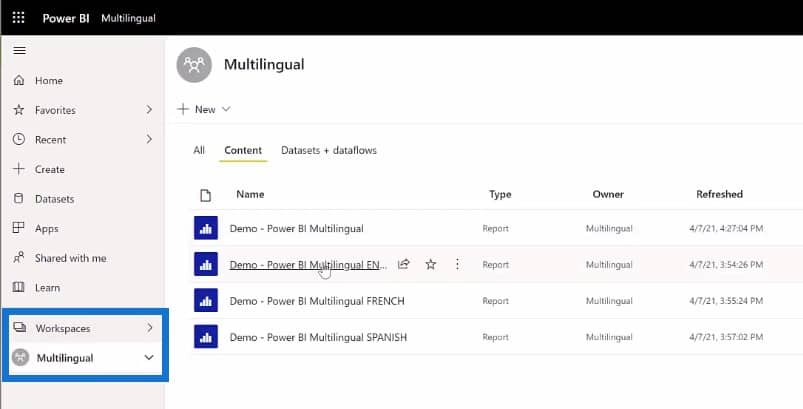
In that case, we can leverage the single report we already have, and save three copies of it, one for English, one in French, and one in Spanish. We can then open each report in turn and delete the navigation buttons. We’ll also need to modify each report to ensure that we only have the appropriate language visible.
We can open the report of interest directly in the Power BI service.
Pros And Cons of Each Multilingual Reporting Method
The single report solution makes use of a single report. So all the code is in one place, and there’s only one PBX to update. It uses a single dataset so the data is only loaded once. It does have a couple of limitations though. It is static and will take manual effort to update the names. If there are any future updates as well, the user has to select the language of interest after opening.
For the multiple report solution, there is less work for the end-user and they can immediately open the report of interest. On the limitation side, it makes use of multiple reports so the code is repeated and the various versions can get out of sync as well.
The multiple report solution uses a copy of the data set for each language, so it is undesirable as well from a service space point of view. Another limitation is that it is more work for the developer as the base version must be updated. The full multi report deployment process must be repeated each time there are design changes.
My personal preference is for the single report method, but in the end, the appropriate solution is a business decision and will be dictated by the client.
***** Related Links *****
Beginners’ Guide To The M Code In Power BI
How To Use Natural Language Query (Q&A) In Power BI
DAX Formula Writing Techniques In Power BI
Conclusion
I hope you’ve learned something from this workaround for presenting a multilingual Power BI report. If you enjoyed the content covered in this particular tutorial, please subscribe to the Enterprise DNA TV channel and check out the rest of our website, where there’s plenty of resources to take your Power BI skills to the next level.
Greg
[youtube https://www.youtube.com/watch?v=ZBMa_M7HalQ&t=677s?rel=0&w=784&h=441]


