In this tutorial, we’ll take a look at the important query settings available in DAX Studio for Power BI. In particular, we’ll look at the File option in DAX Studio and explore the new settings it has.
This tutorial will also include an explanation on how to configure these settings and how they affect the performance and workspace of DAX Studio.
Query Settings In Power BI: The File Tab
There are in total seven options under the File tab in DAX Studio.
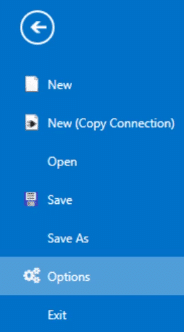
The first option is New. If you click on it, a dialogue box will appear that gives the option to choose a Data Source. A separate tutorial is available for understanding and connecting data sources.
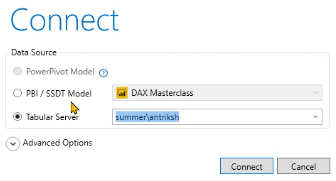
Once you’ve chosen a data source, it will create a connection with the existing data model you selected.
The second New (Copy Connection) option under the File tab allows you to create a new query that automatically uses the existing connection of your current file.
You can also choose to add this option to your access toolbar so that you can quickly access it without having to open the File tab.
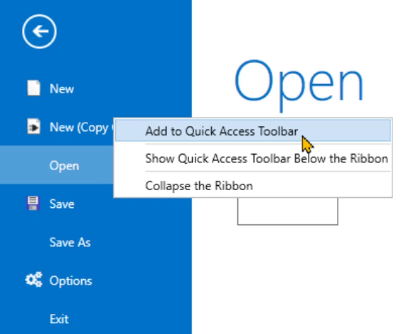
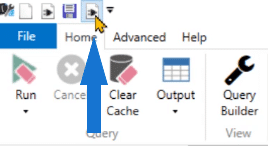
With this, you can instantaneously build connections with the existing data model.
The Save, Save As, and Exit options are self-explanatory. They have the same functions as with any other program.
The Query Options Settings In Power BI
The most interesting part of this tutorial lies with the Options setting. When you click this, you’ll see that there are three sub-options under it which are: Standard, Key Bindings, and Advanced. Each sub-option has further sub-sections.
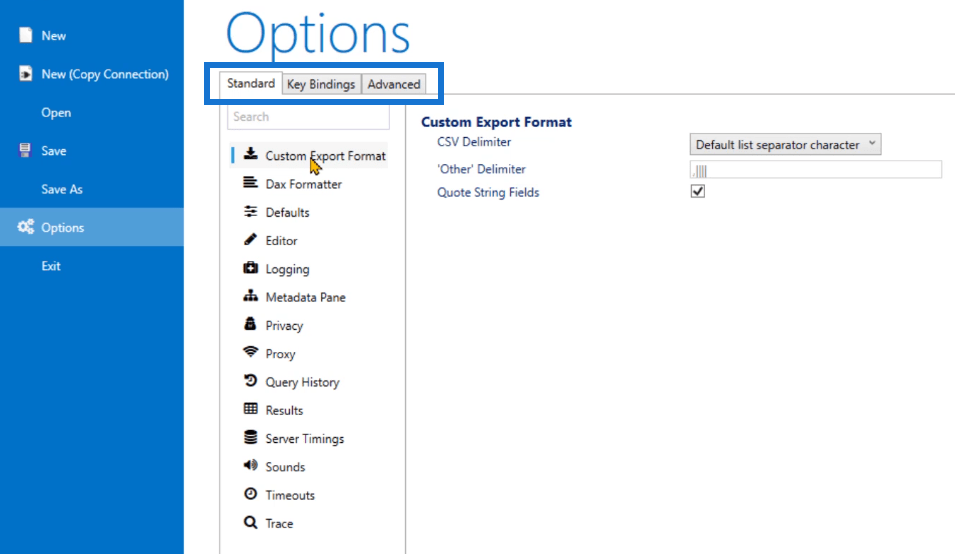
The Standard Tab
Under the Standard sub-option, there are 14 sub-sections.
The first is the Custom Export Format.
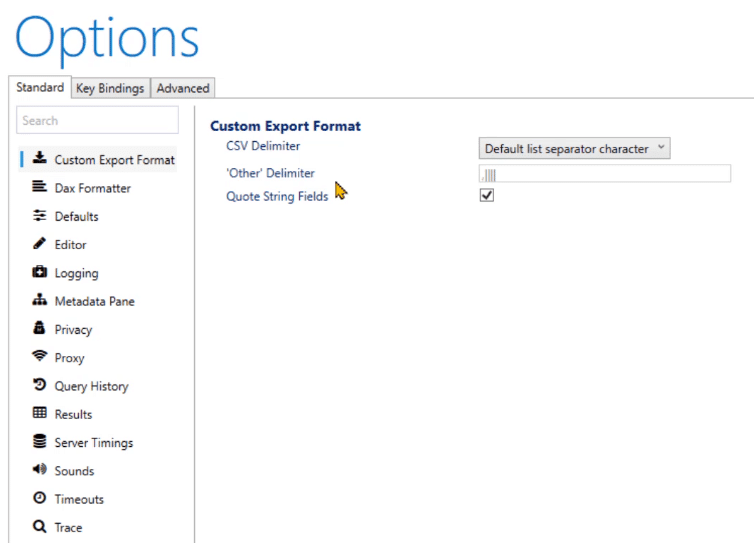
If you want to export data from your Power BI or Tabular Data Model, you can modify these settings depending on your requirements.
The next one is the DAX Formatter.
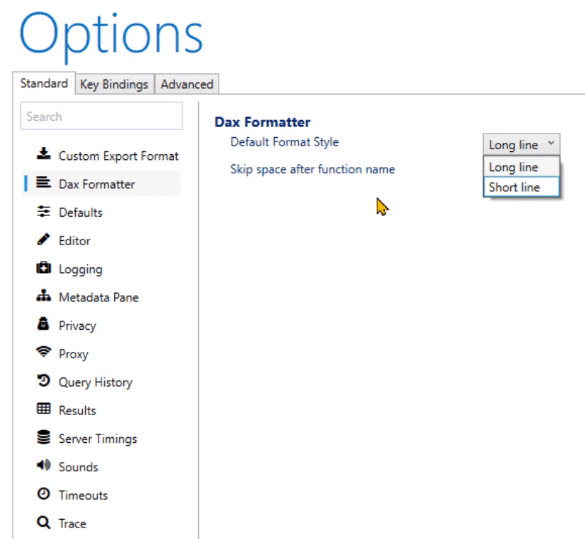
You can use this to set the default format style to either short line or long line. You can also check or uncheck the option to skip spaces after function names when writing code.
The third setting under Standard is Defaults.
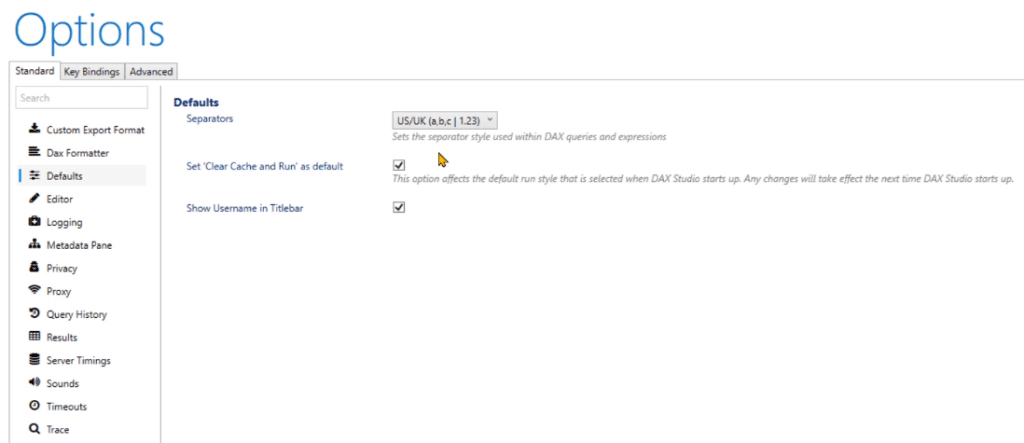
If you’re living in a country where commas aren’t used and instead use semicolons as a separator, then you can specify that as the default separator option.
Another segment under Defaults is the Clear Cache then Run. When you press the Run button, two things can happen: the program will either instantly run the query or clear the cache prior to running. This will depend on what option you’ve set as the default.
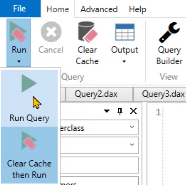
There’s also an option to either show or hide your username in the title. If this is enabled, your username will be displayed alongside the program title.

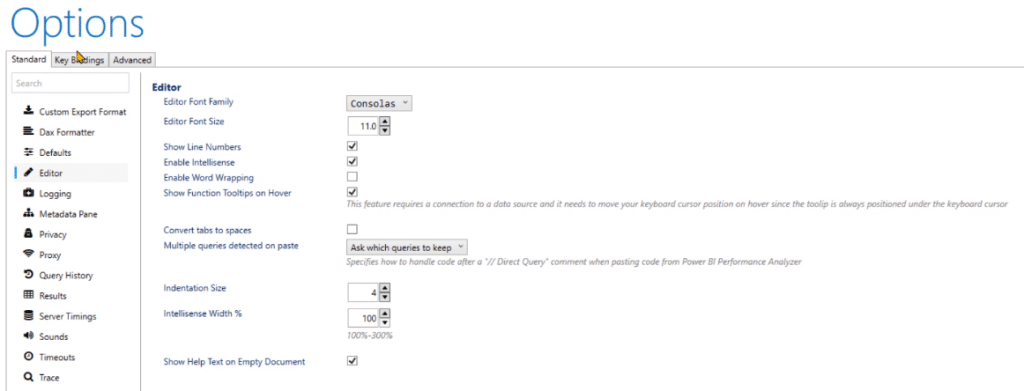
The next one is the Editor. This allows you to configure the settings of the editing area in DAX Studio.
The editing area is where you input your code.
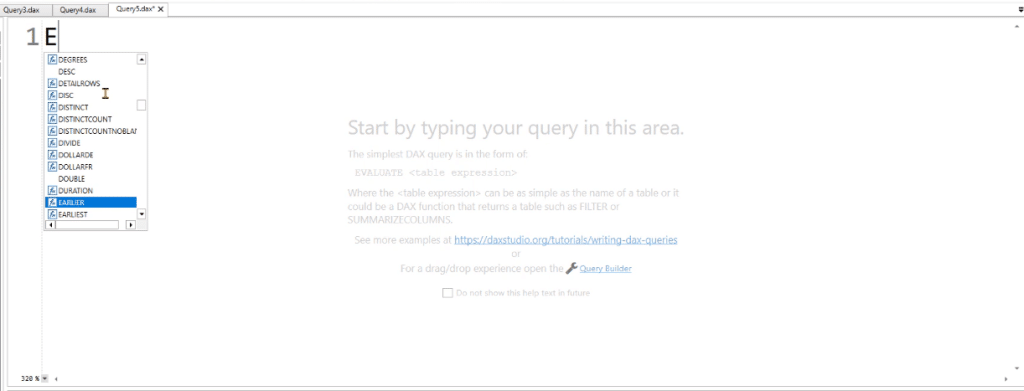
With the Editor option, you can modify the font size, word wrapping, and Intellisense width, among many others.
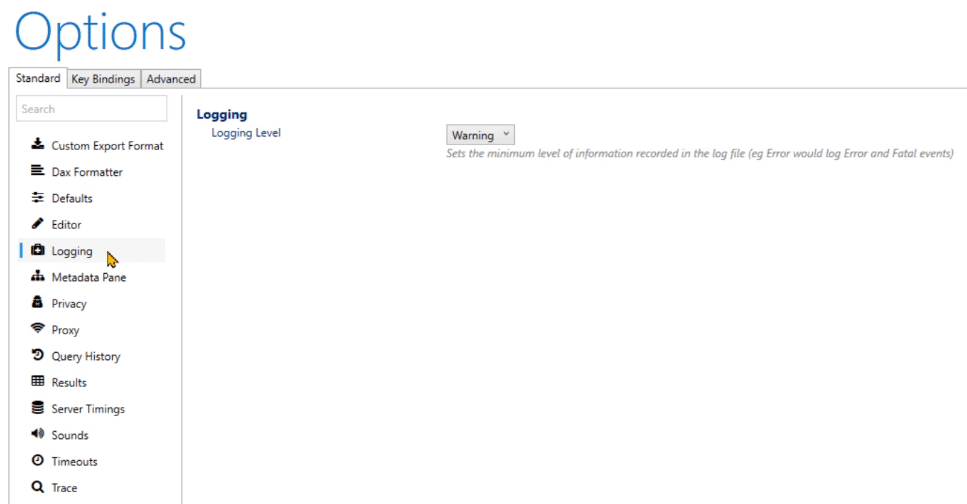
The Logging option is not relevant for users. It’s there as support to DAX developers.
Critical Query Settings In Power BI: The Metadata Pane
Next is the Metadata Pane.
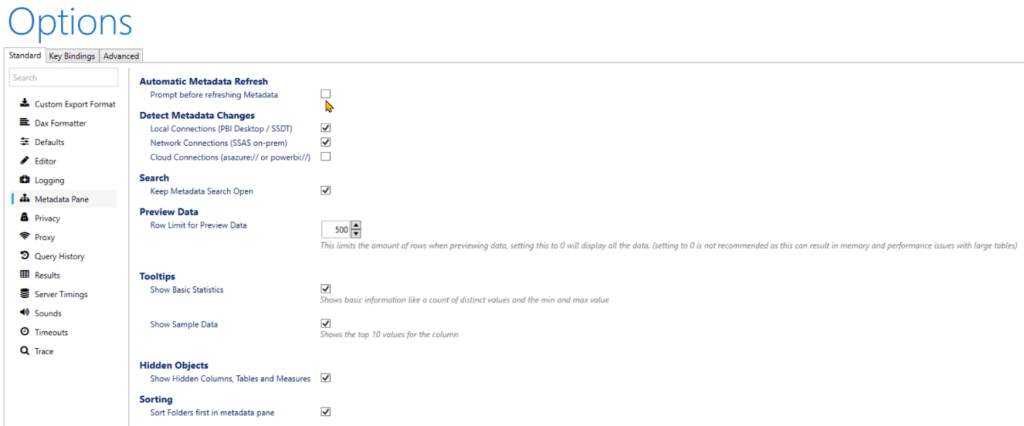
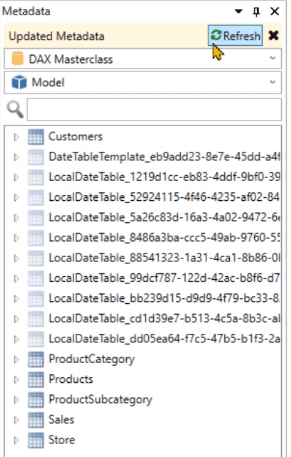
The first option in the Metadata Pane is Automatic Metadata Refresh. If the checkbox is not selected, the metadata in your model will automatically refresh. Otherwise, a Refresh button will appear on your Metadata every time changes are made.
For the Detect Metadata Changes option, you can check or uncheck the boxes depending on your requirements.
The Preview Data option allows you to put a limit on the number of visible rows in the output pane whenever you execute a DAX query. This helps reduce the amount of memory consumed every time you run a query.
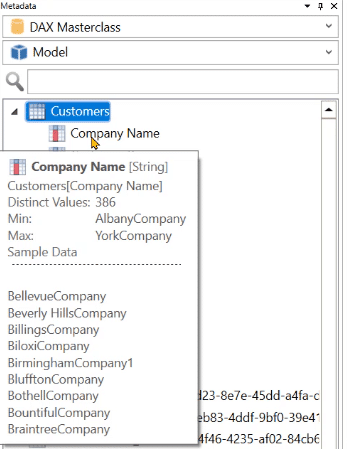
Tooltips allow you to toggle between showing or hiding basic statistics and sample data. For example, if you go to a table and hover over a column, you’re able to retrieve some basic information depending on what you selected.
The Hidden Objects option allows you to show/hide all the objects inside your Tabular Object Model. Tables that have translucent icons can either be shown or hidden in your Metadata depending on the default option you chose.
Other Settings Under The Standard Tab
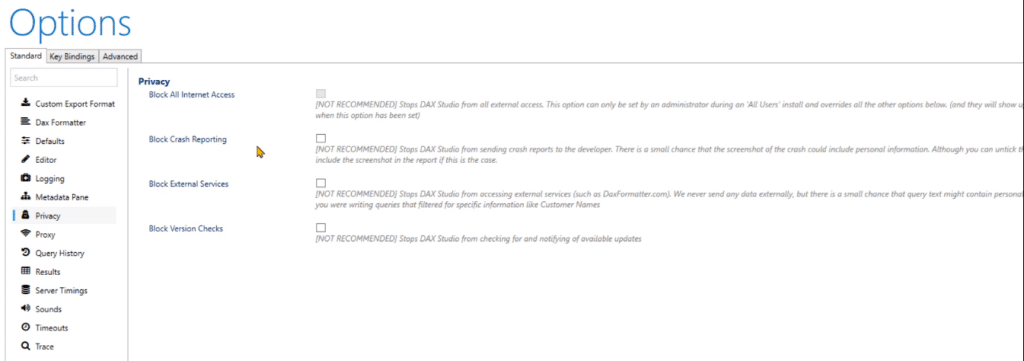
Next under the Standard tab is the Privacy section. There are four settings that you can customize to fit your needs.
The next one is the Query History section.
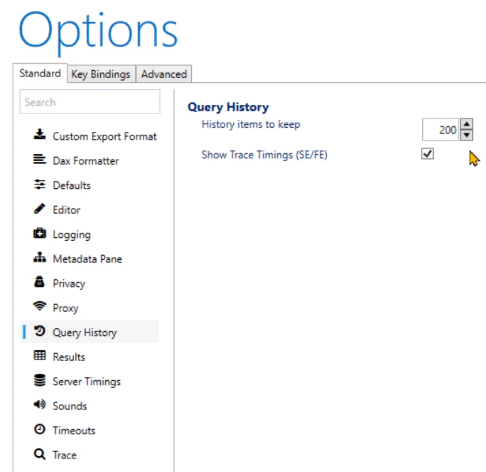
This allows you to increase the number of queries kept in the history bin. There’s also an option to either show/hide the Trace Timing, which includes the Storage Engine and the Formula Engine.
Next is the Results bin.
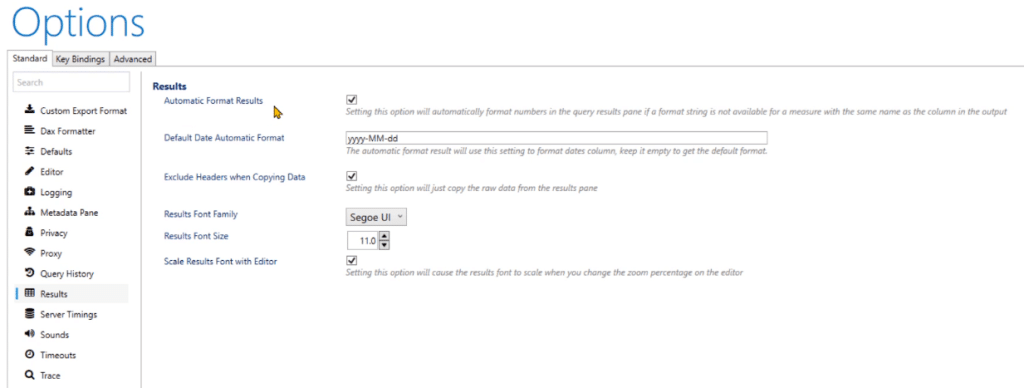
When checked, the Automatic Format Results setting will match the formatting of measures between the Tabular Model and DAX Studio. There are also other settings that you can toggle with.
Next, let’s go to the Server Timings section.
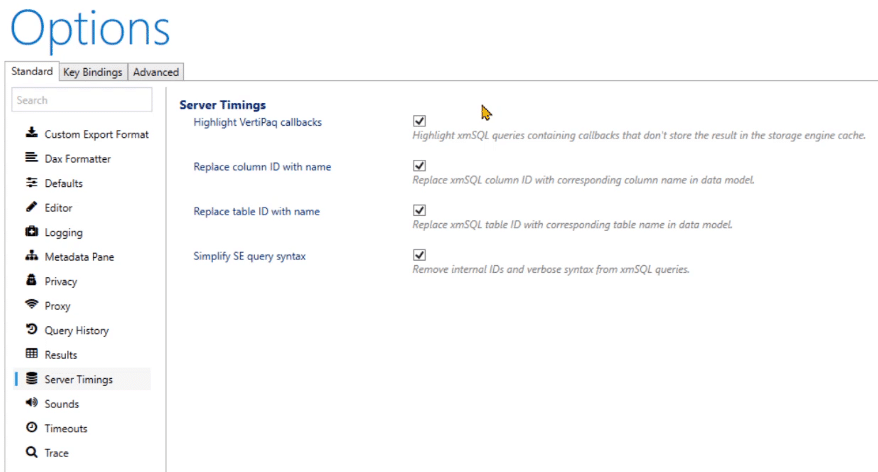
This setting is important when identifying the code and storage engine queries.
The Sounds section is not important when building codes in DAX Studio.
So, let’s go to the Timeouts section.
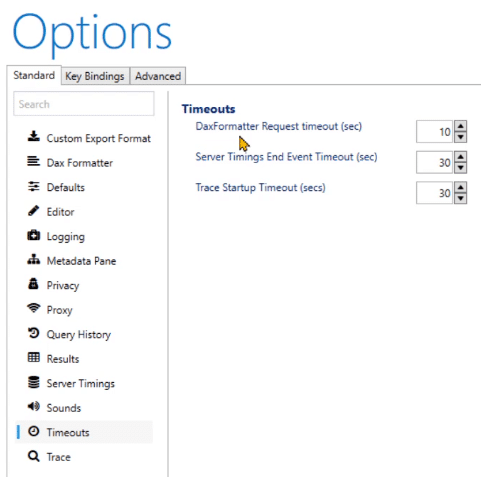
There are three timeouts that you can customize. The DAX Formatter Request timeout accounts for delays in data transfer. For example, if you’re formatting your DAX code but then network latency takes more than 10 seconds, your request will timeout and the DAX code won’t be formatted. This concept is also true for the Server Timings End Event timeout and the Trace Startup Timeout.
You can increase or decrease the time for each timeout depending on your requirements.
The last sub-section under the Standard tab is Trace.

If you’re using an older version of the SQL Server Analysis Services, it’s best to keep the Legacy DirectQuery Trace open.
The Key Bindings Tab
The second sub-option under the Options settings is the Key Bindings.
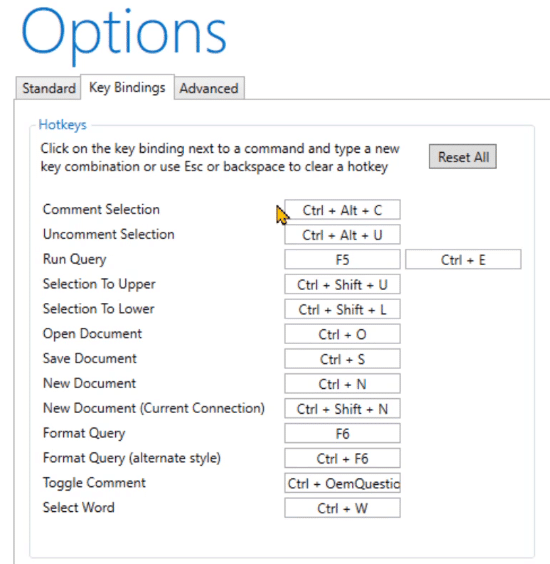
Key Bindings allows you to bind the keys of your keyboard to the shortcuts available in DAX Studio. This setting is also foolproof as it shows a warning message to remind you that existing shortcuts cannot have duplicates.
The Advanced Tab
The Advanced tab contains three sections: Publish Functions, Preview Features, and VertiPaq Analyzer.

For the Published Function setting, this is more geared towards the developer and not the users. When a new version of the DAX engine is released, this setting helps to keep track of all the new and available functions that come with it.
If you try and click either of the two buttons, it will prompt a request to the dax.guide website and will then automatically refresh its database.
The next one is the Preview Features setting which contains two options: show Debug Commas and show XMLA Commands.
If you uncheck the Show Debug Commas setting, a button will appear in the DAX Studio toolbar labeled Swap Delimiters.

But if you check it, the button will then be labeled Debug Commas.

The last setting under the Advanced tab is the VertiPaq Analyzer.
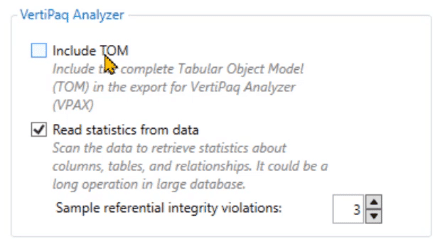
Check the box if you want to include the complete definition of the Tabular Object Model in VertiPaq.
***** Related Links *****
SharePoint Site Library Settings | An Overview
Connect DAX Studio To Power BI And SSAS
How To Install DAX Studio & Tabular Editor In Power BI
Conclusion
Before you start building codes in Power Query and DAX Studio, make sure to properly configure the settings in the Options tab according to your requirements.
This quick overview of the File tab, and specifically, the Options settings in DAX Studio will help you understand what to modify to ensure that you have a seamless experience while coding and building your reports.
If you have further questions about the Options settings, just drop a comment below or you can check out the forum discussions in the Enterprise DNA website.
All the best,
Enterprise DNA Experts


