
I’m going to show you how to extract records from merged delimited data within multiple columns. This turns your data into a format that’s more suitable for analysis.
There are a number of ways to do this. But for this tutorial, I’m going to focus on a solution suggested by Ankit, who’s part of our Enterprise DNA community. You may watch the full video of this tutorial at the bottom of this blog.

Using Text.Split
For this solution, I’m going to use Power Query to extract records from delimited data.
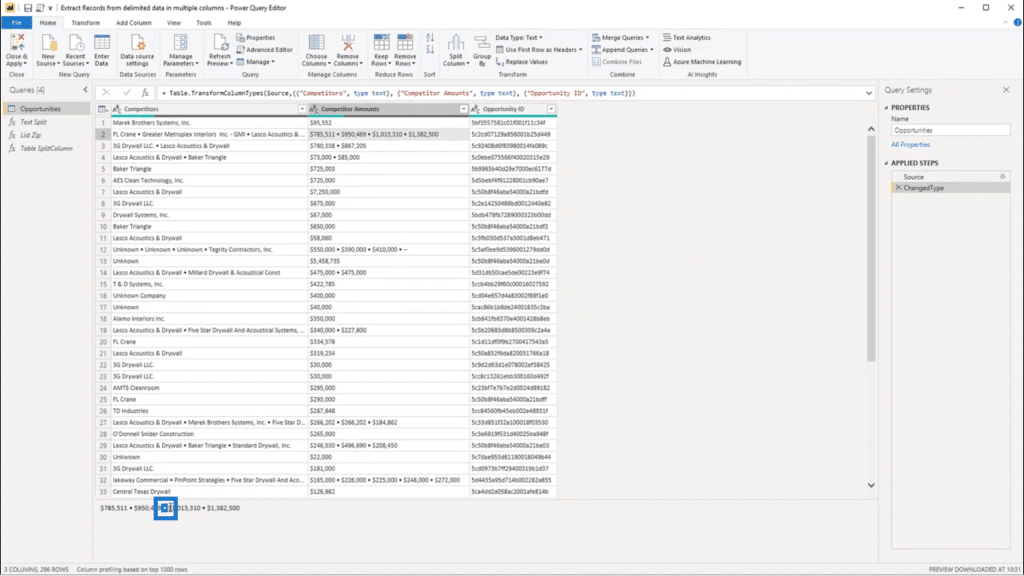
Below is the Opportunities table within Power Query.
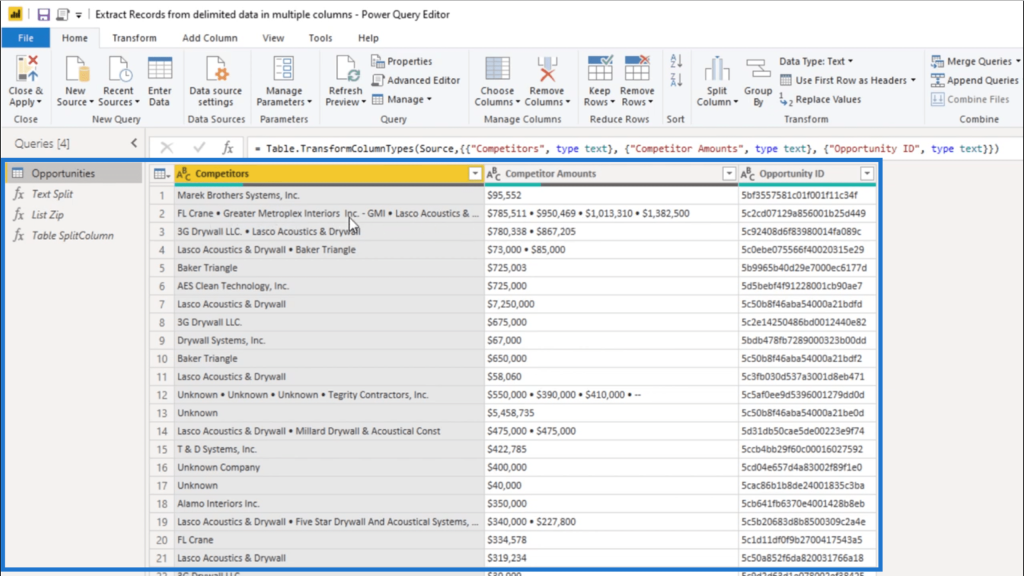
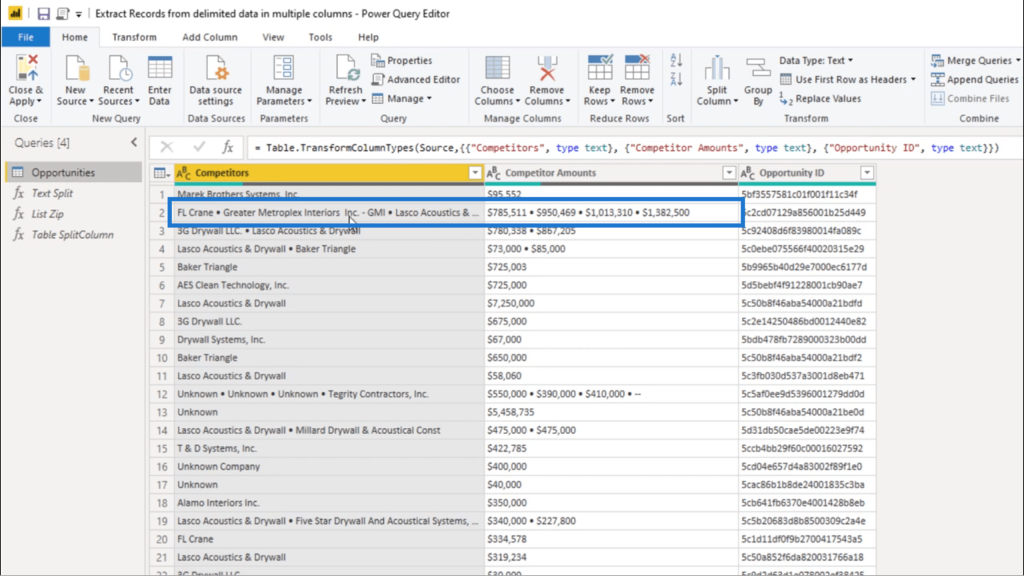
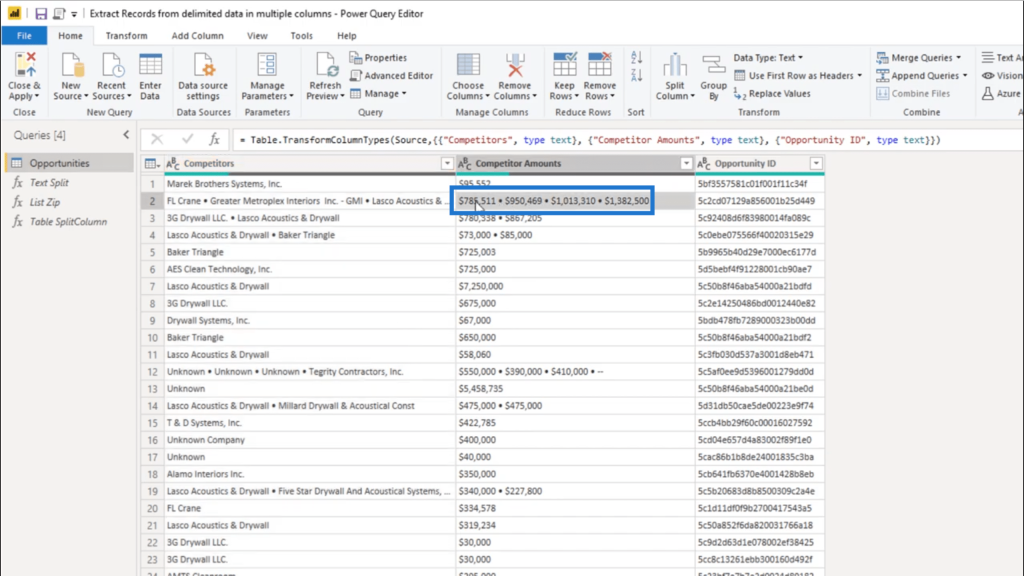
As you can see, there are multiple values concatenated into a single record. In the 2nd row, for example, there are 4 different values presented. These 4 values are merged together under the Competitors and Competitor Amounts columns.
The first thing I’m going to do is use Text.Split.
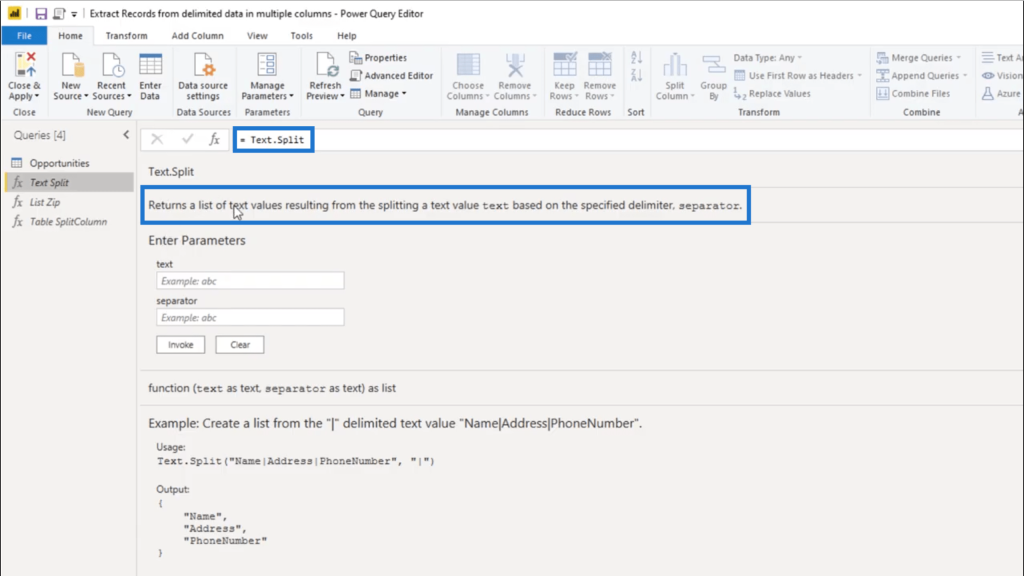
Text.Split returns a list after splitting a text value based on a specific delimiter.
To start using Text.Split, I’m going to copy the delimiter used in this table.
You’ll notice that once I click on that entry in the table, the record value shows up at the bottom. I’ll just copy the delimiter from there.

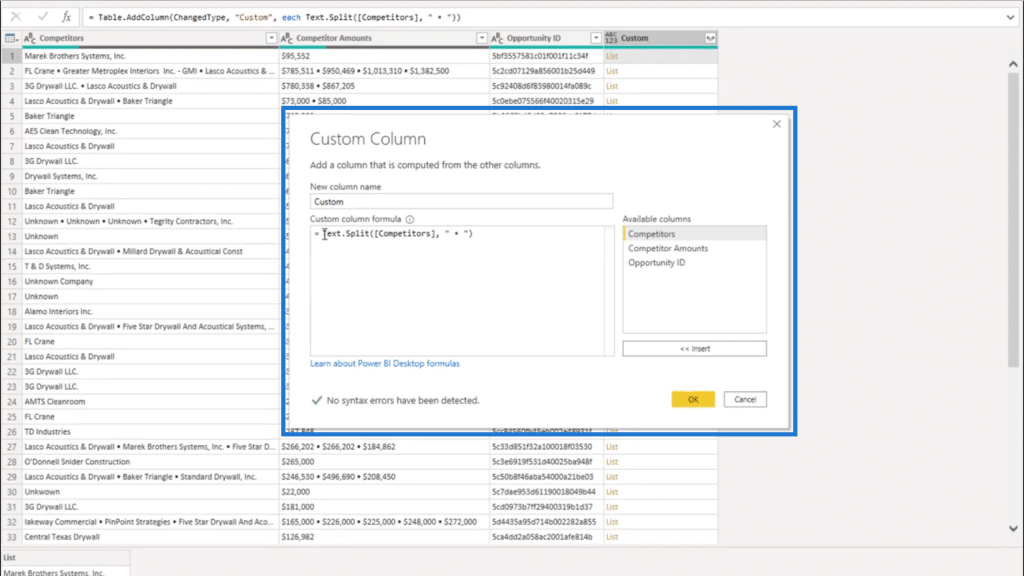
Once I’ve done that, I’m going to add a custom column.
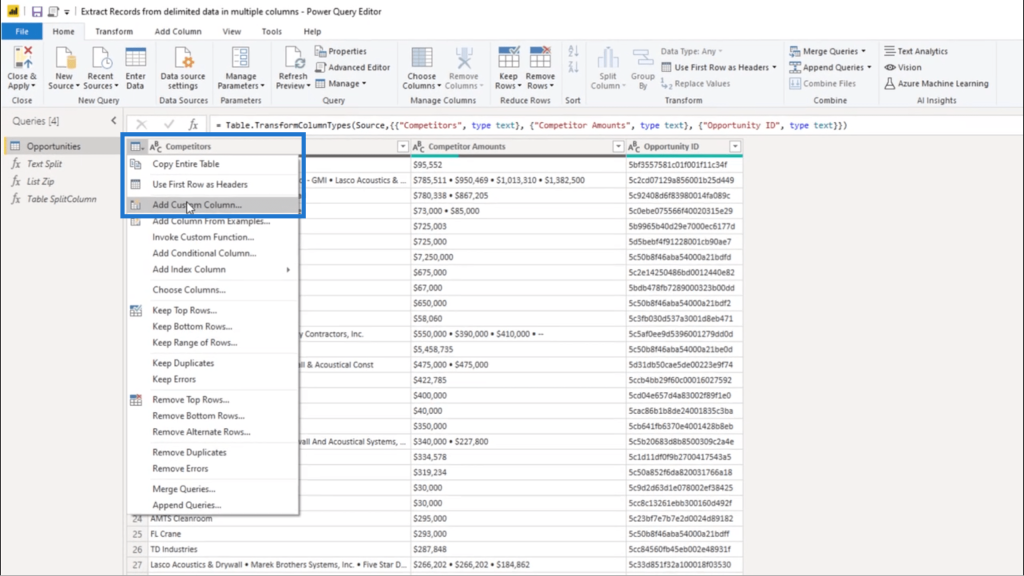
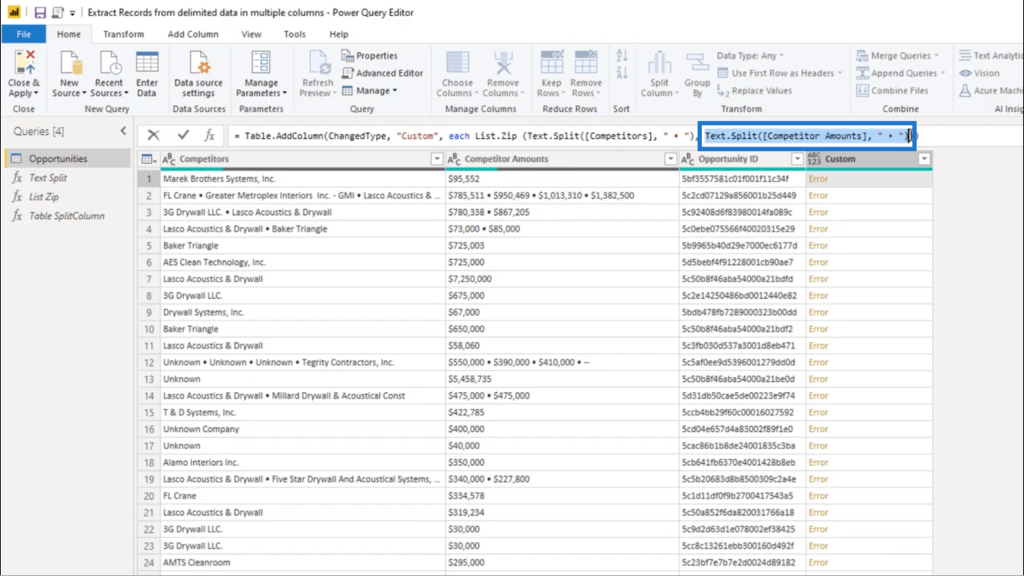
I don’t have to change the name just yet. I just need to do a Text.Split under Custom Column Formula.
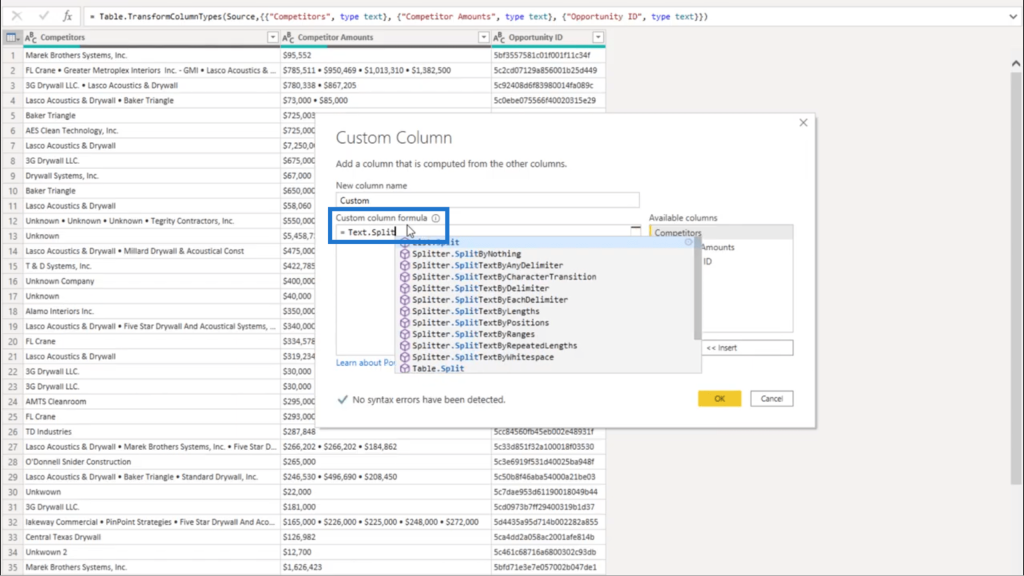
This formula needs a text value. So I’ll just choose the Competitors column on the right pane and it’s automatically added to the formula.
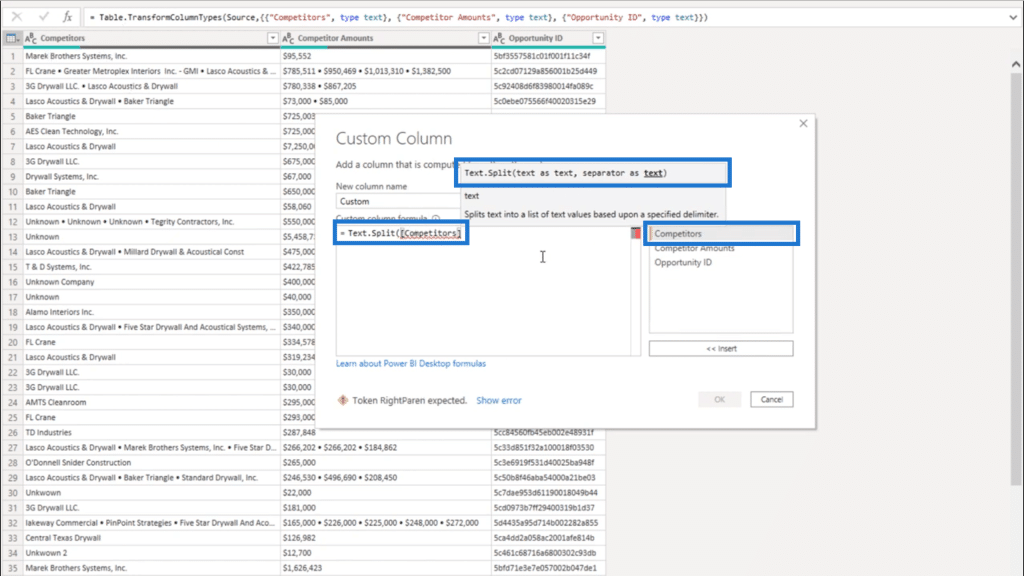
I also need a separator given as a text. So inside a pair of quotation marks, I’m going to paste the delimiter I copied earlier. Then, I’ll add the closing parenthesis.
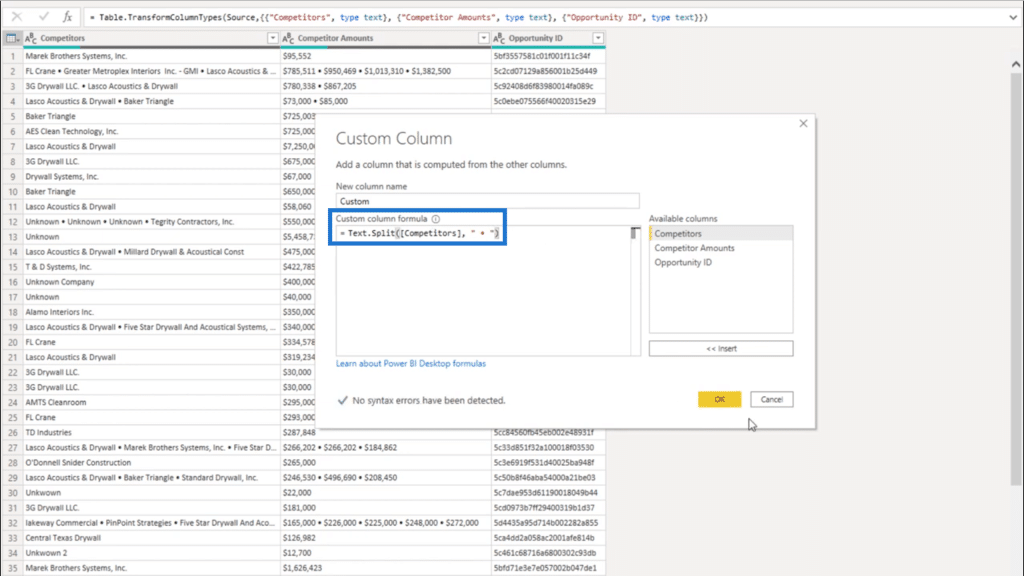
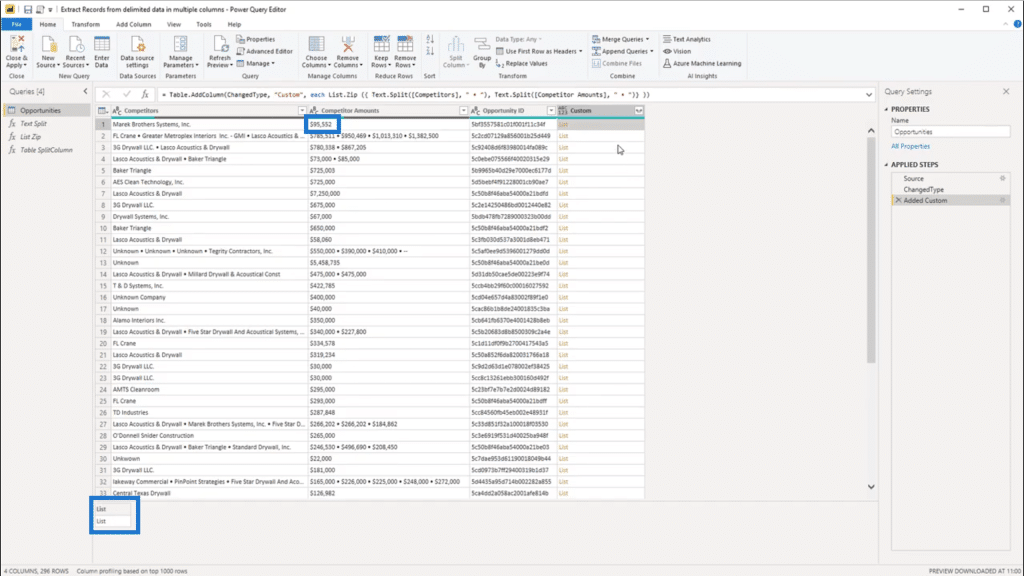
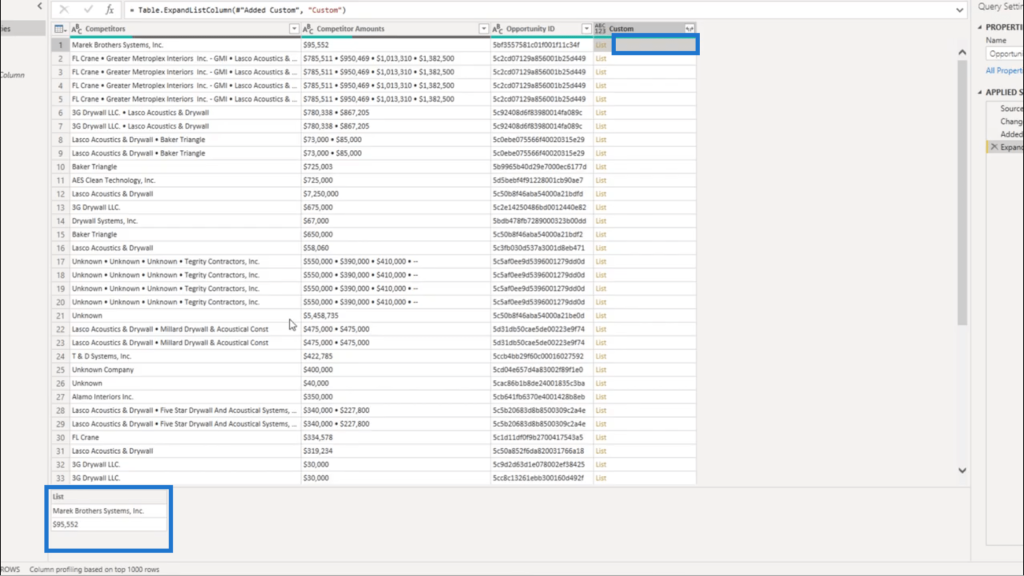
Once I press OK, I’ll end up with a list object.
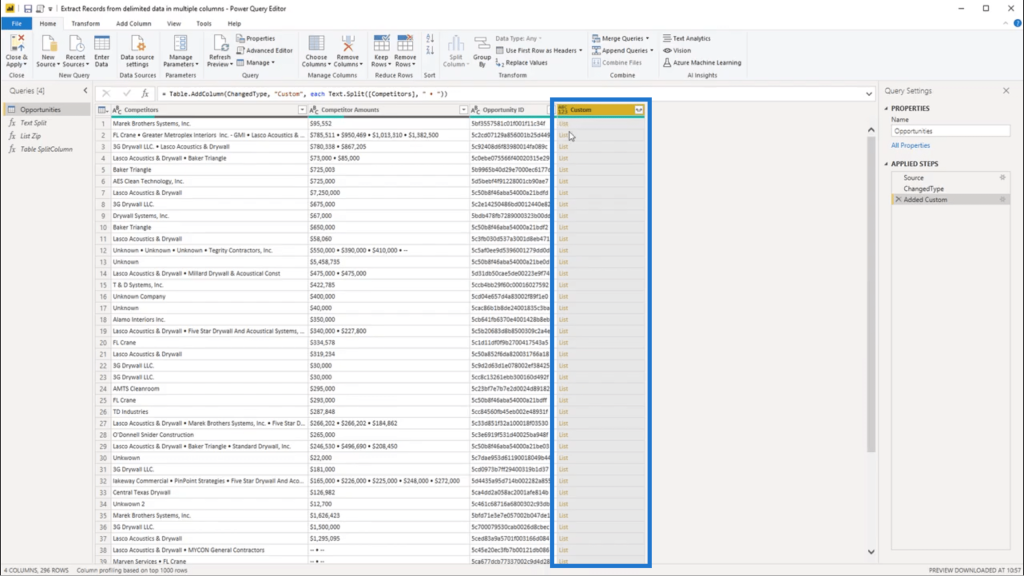
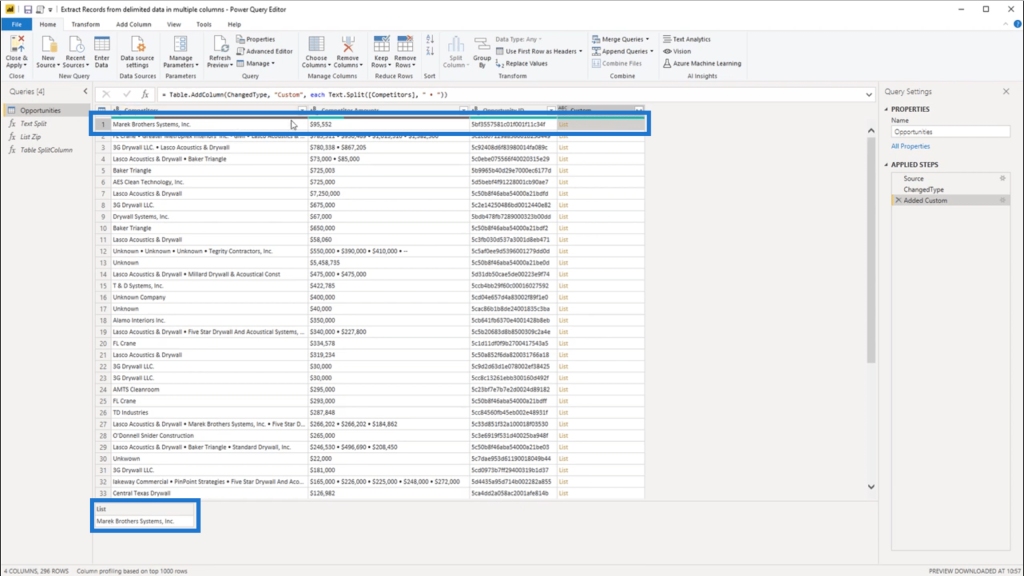
Looking at the first list, the Competitors and Amounts columns both show only one entry. So if I click on the empty space beside the list object under the Custom column, it also shows a single value at the bottom.
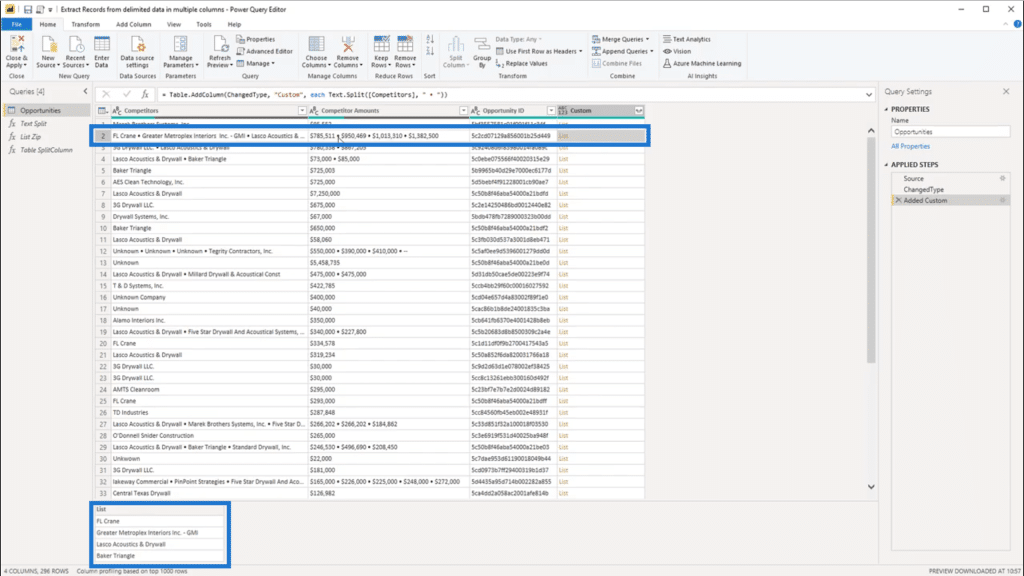
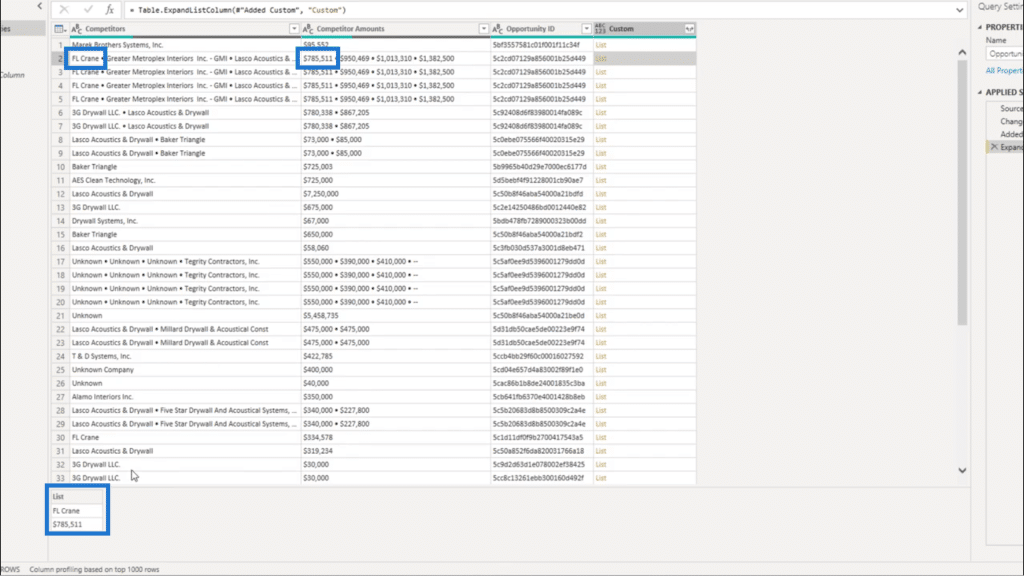
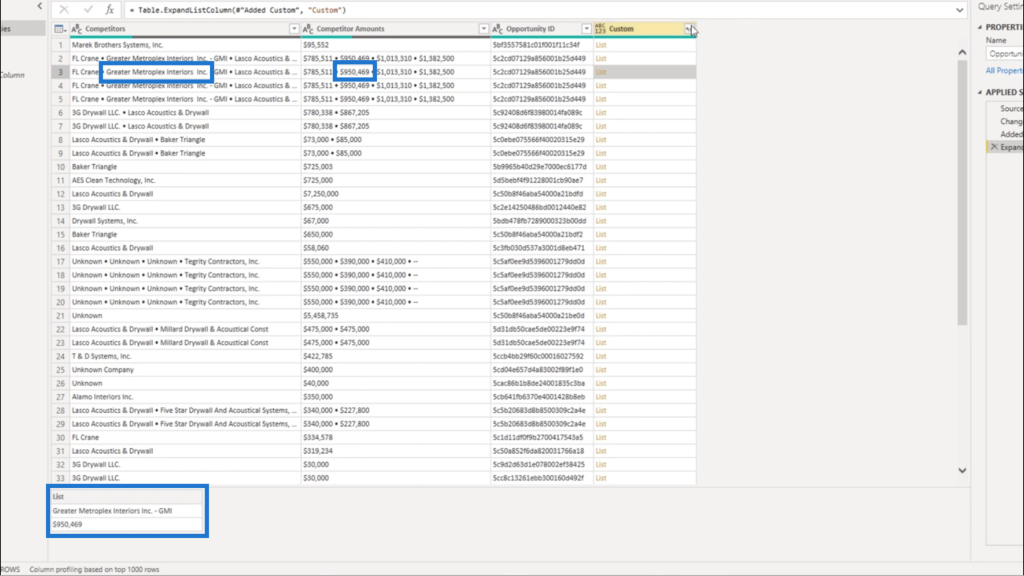
For the second record, I have a list that contains four values. This corresponds to the 4 values also shown in the Competitors column and Amounts column.
Using List.Zip
Now that I’ve split the list, the next step is to add the corresponding value from the Competitor Amounts column. I’m going to the List.Zip to do that.
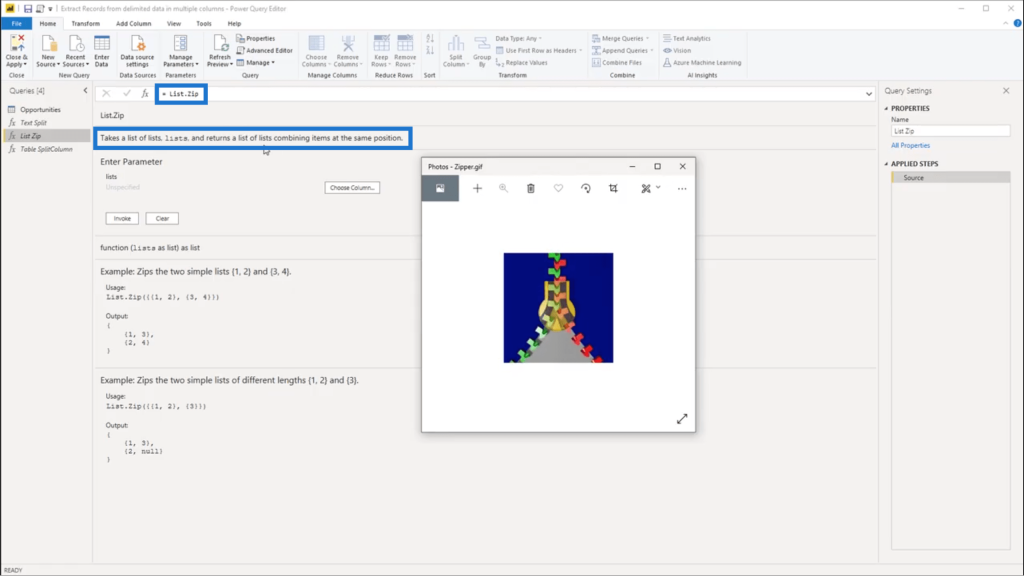
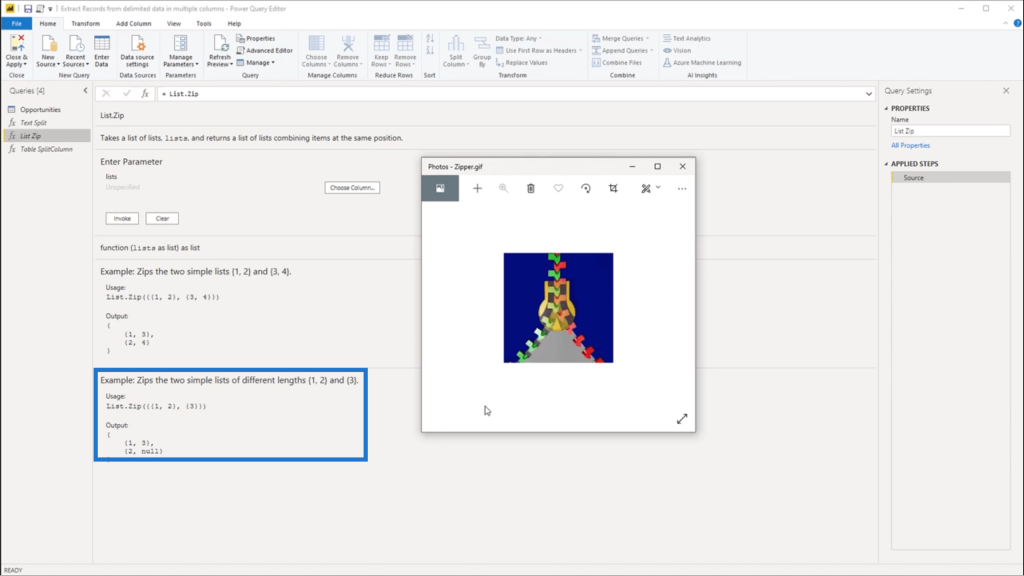
Think of List.Zip as an actual zipper. It takes a list of lists and combines the items.
Looking at the example below, just think of the first list (1 and 2) as the green track on the zipper.
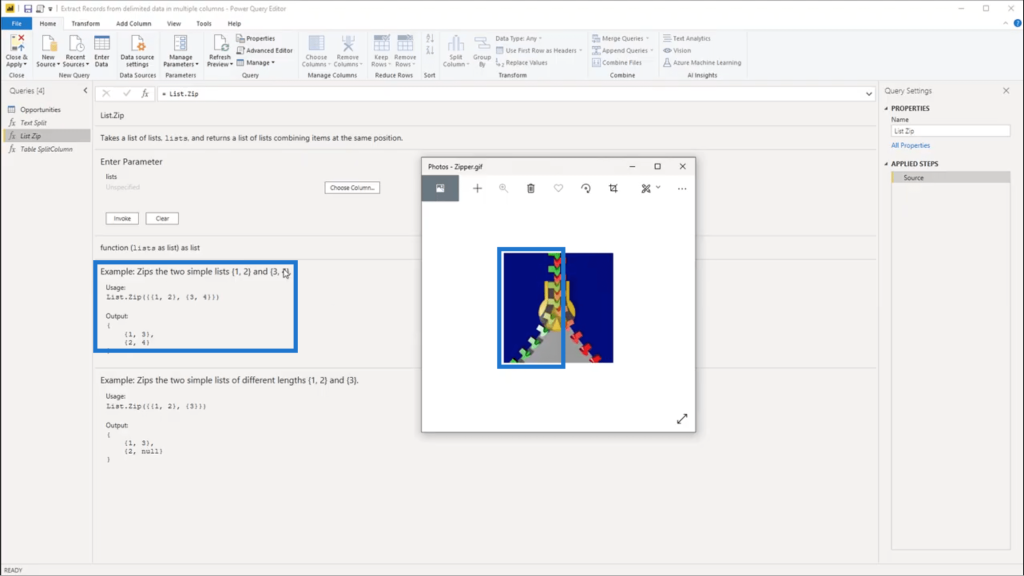
Then, think of 3 and 4 as the red track.
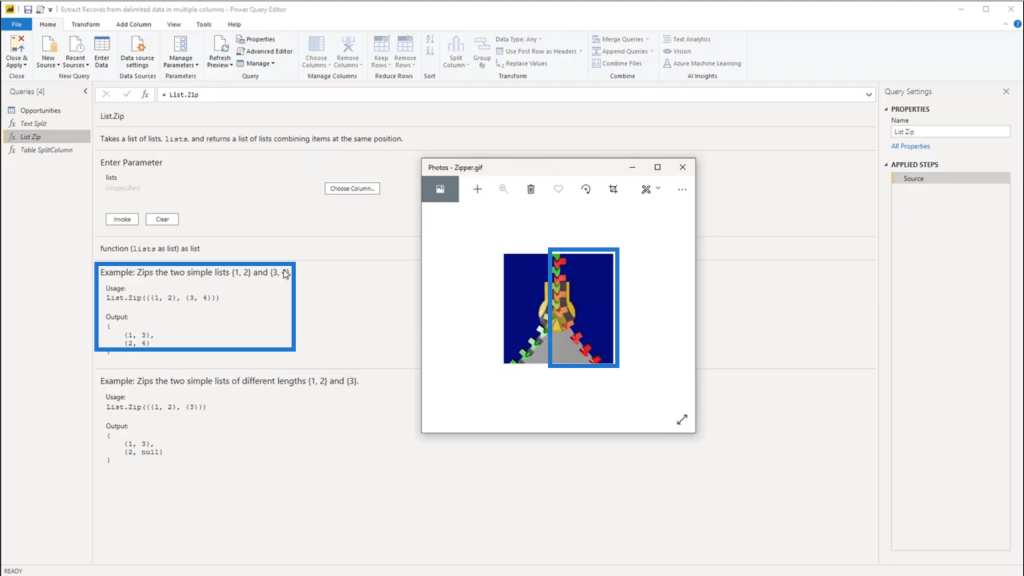
When List.Zip is applied, they come together in the middle. So 1 from the 1st group is combined with 3 from the 2nd group. The same thing happens for 2 and 4. This can be seen on the output, where there are two new groups that have been formed.
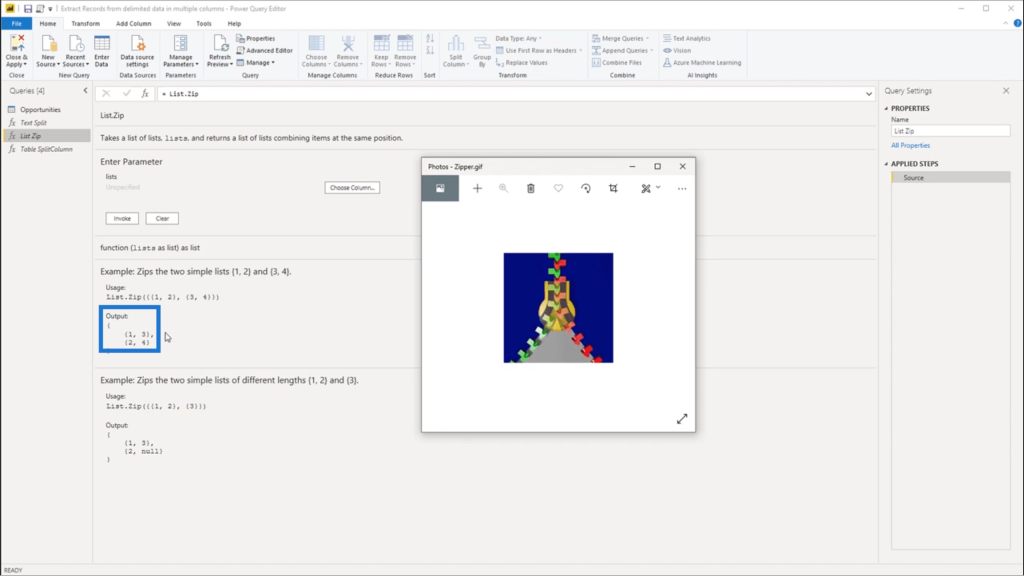
There may be times when the lists involved have different lengths. This means that if the lists are combined, the missing data will be returned. To create exact pairs despite the lack of data, a null value is added.
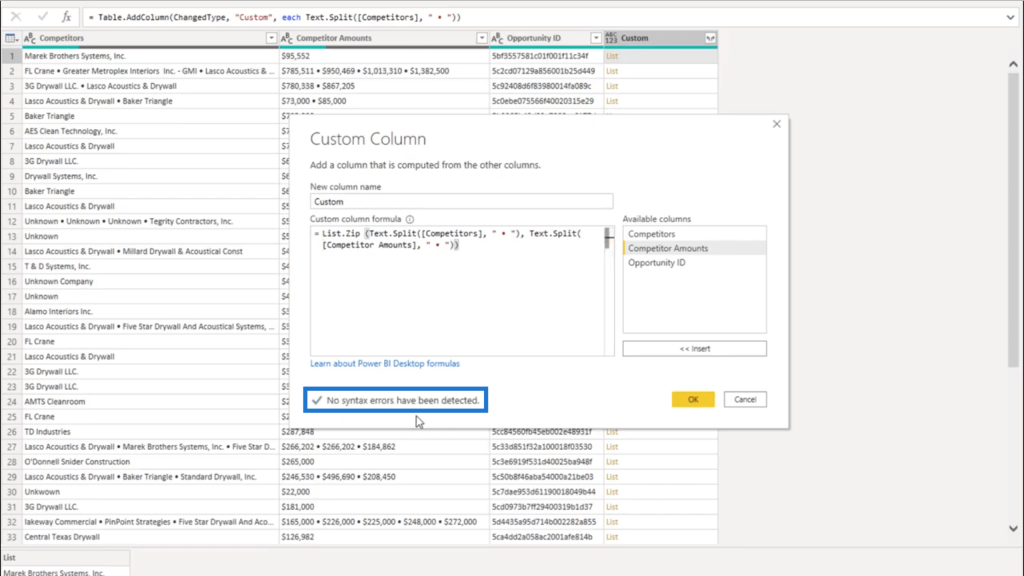
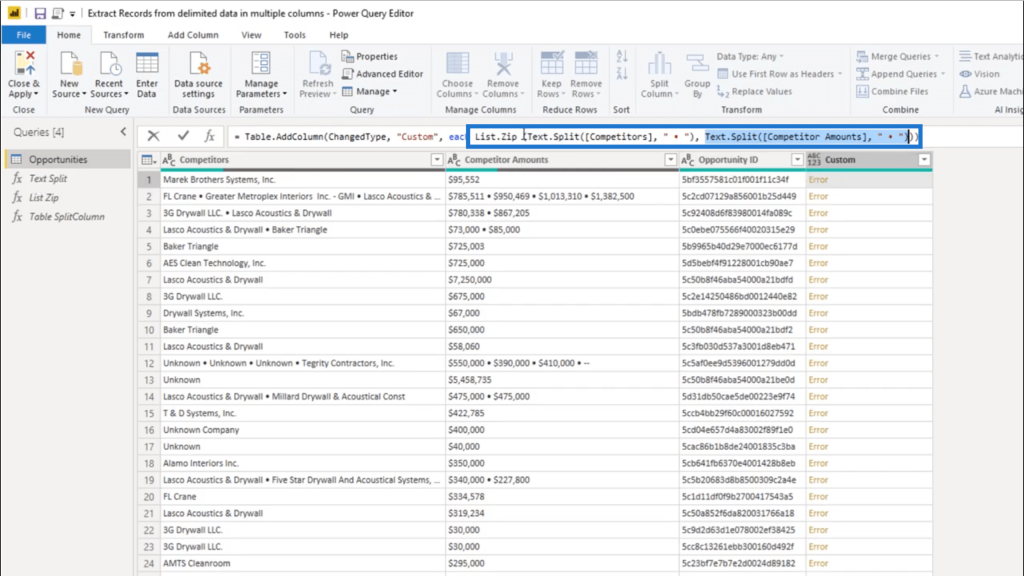
Going back to the Opportunities table, I’m going to add another custom column.
This time, I’m going to add the Competitor Amounts column to the formula.

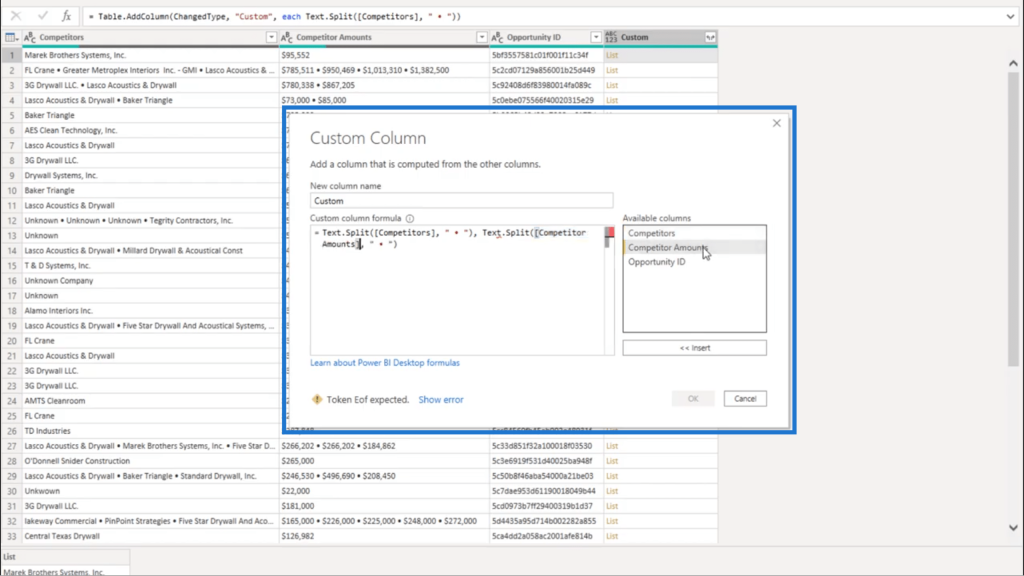
I’m also going to add List.Zip.
Checking below, it shows that there are no errors detected.
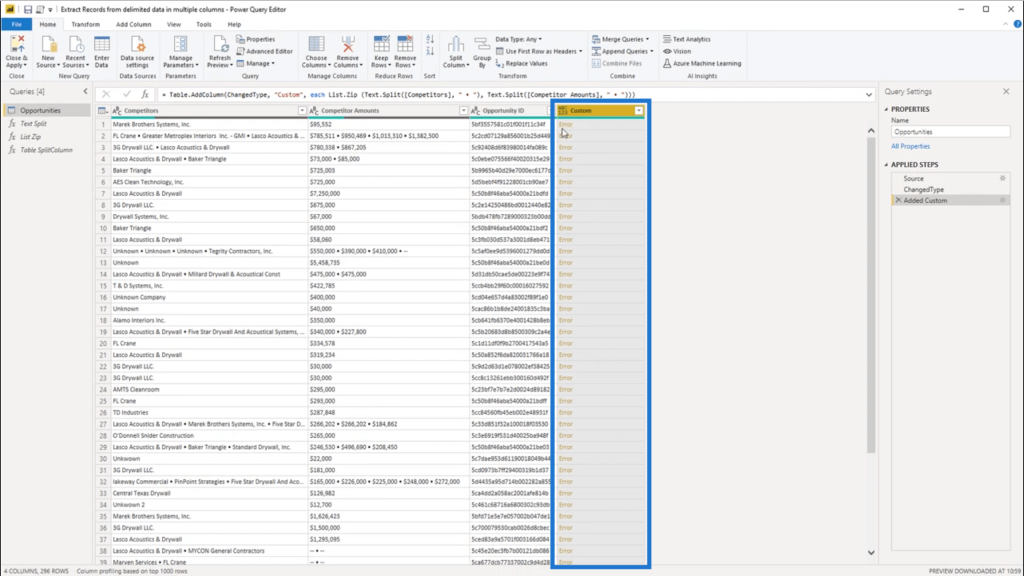
But when I click OK and look at the new column formed, I still end up getting an error.
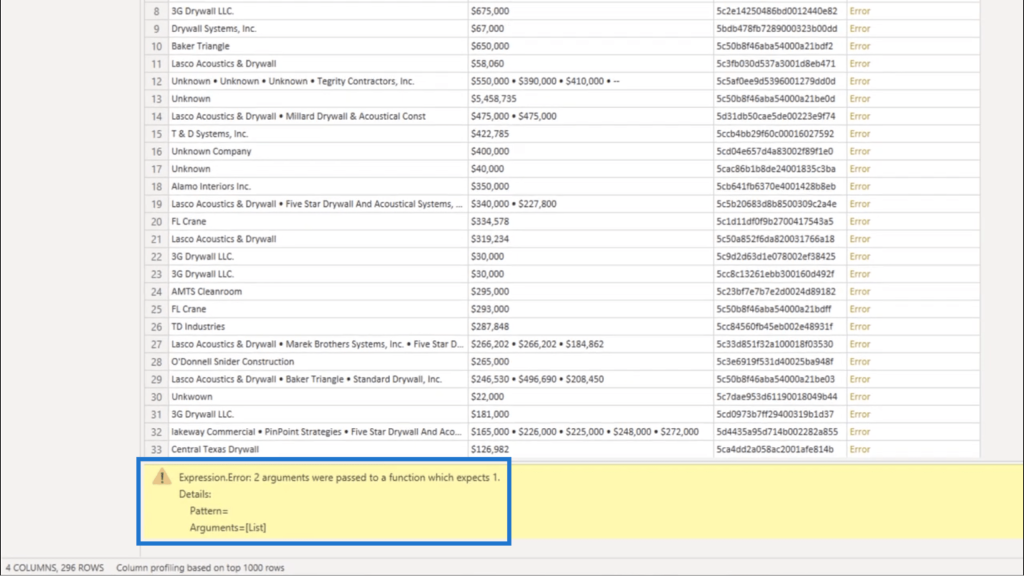
I’m going to click on the white space beside the error to see the details. It shows that I’m getting an error because I returned some arguments around the lists.
Looking at the formula, it shows that this syntax where the Competitors column was referenced returned a list.
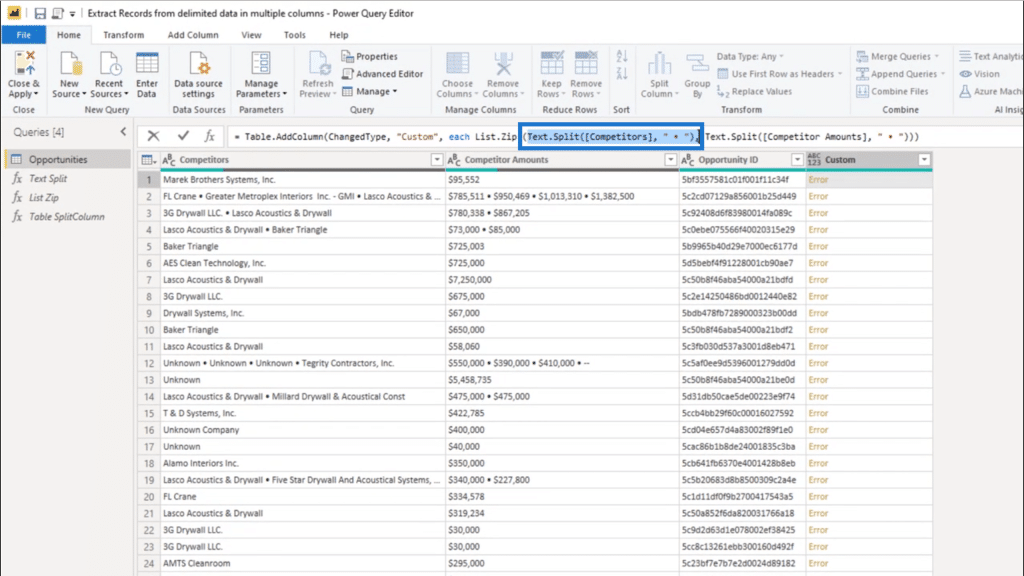
But the syntax for the Competitor Amounts columns also returned a list.
Recalling what List.Zip does, it takes a single list of lists and combines them.
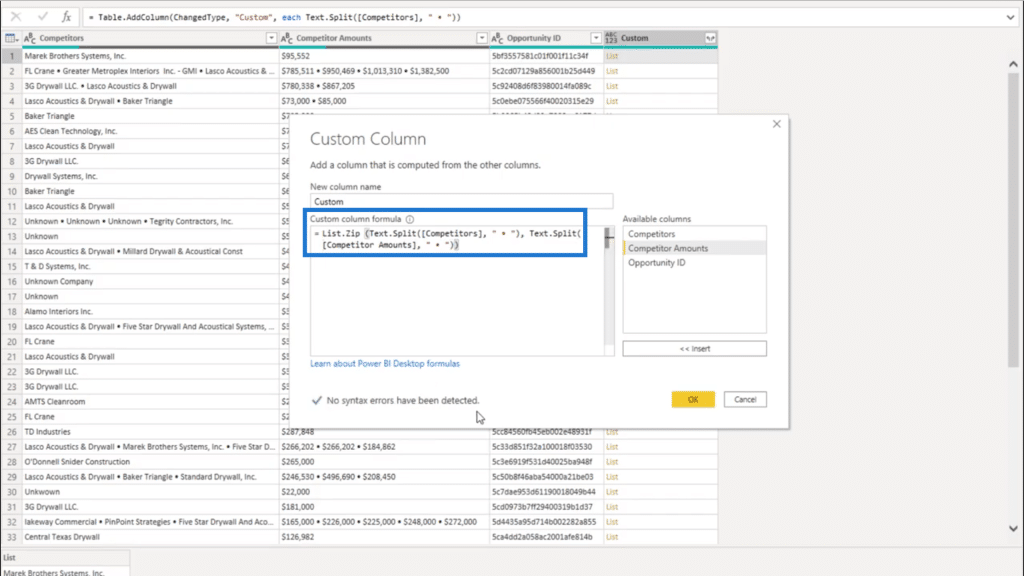
Seeing that there are two lists showing up, I need the list initializer to bring those lists together. That’s why I’m adding these curly brackets.
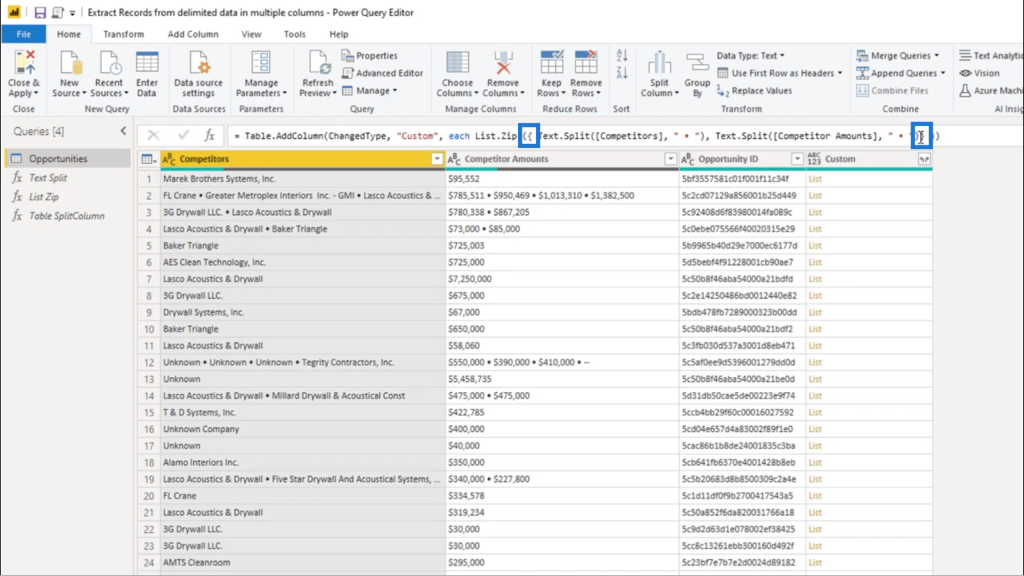
Once I add the closing curly bracket at the end, I just need to press enter. That will give me a list object.
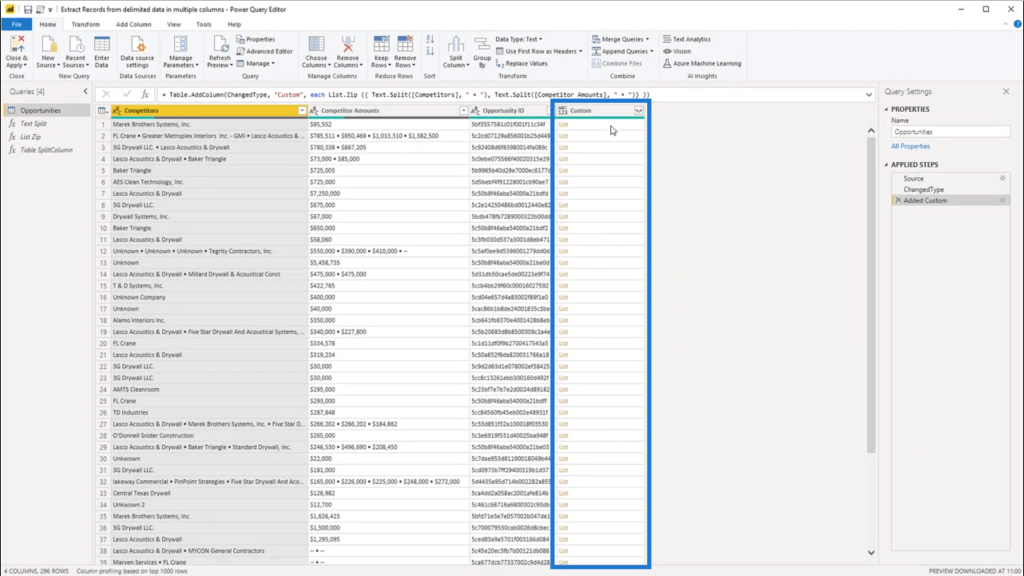
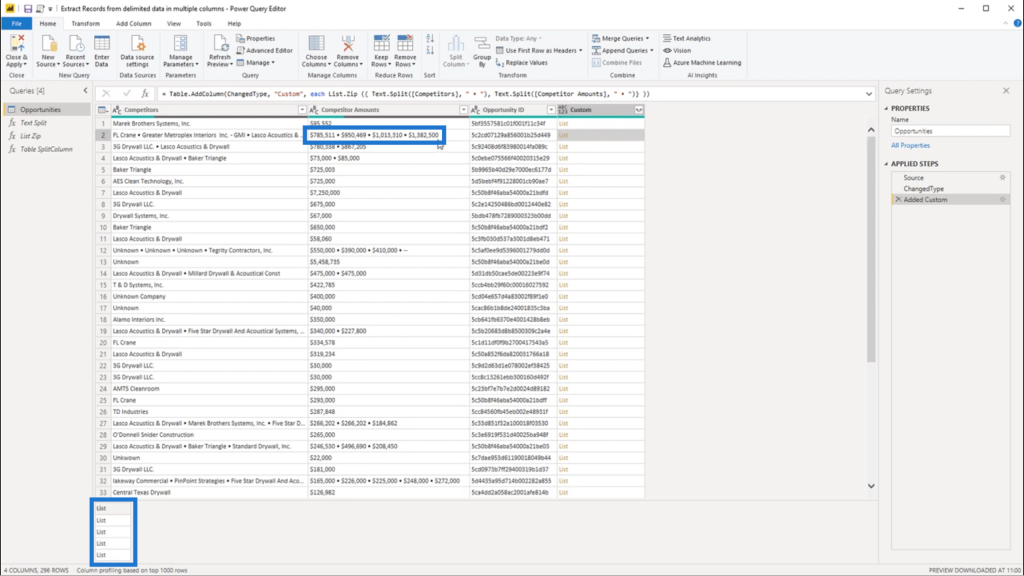
Now, when I click off to the side of the 1st record, it shows a single list object. This is correct, seeing that under Competitor Amounts, there really is a single value there.
If I do the same thing to the second record, it shows a list object containing 4 lists. That also matches the number of values in the delimited data under Competitor Amounts.
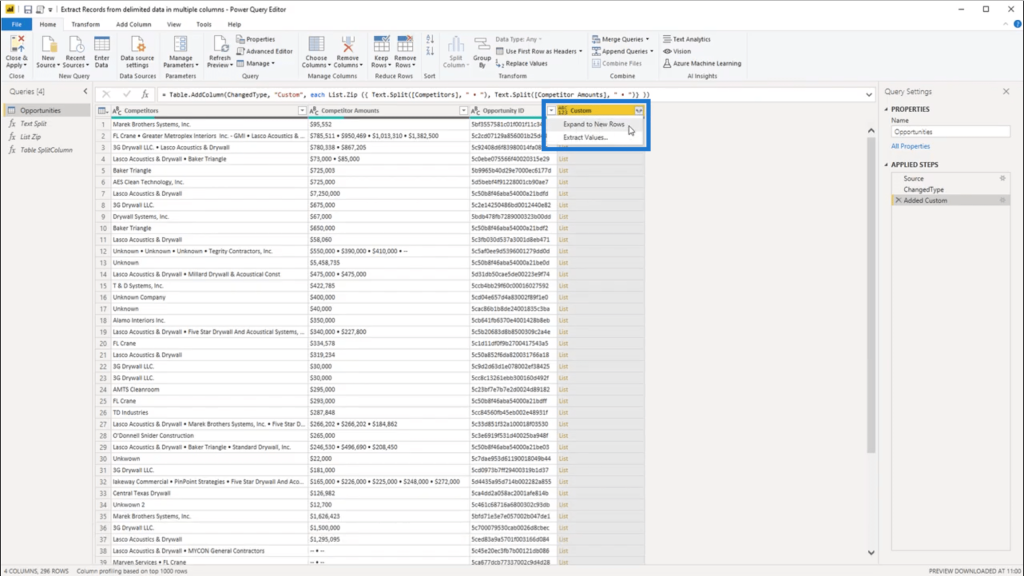
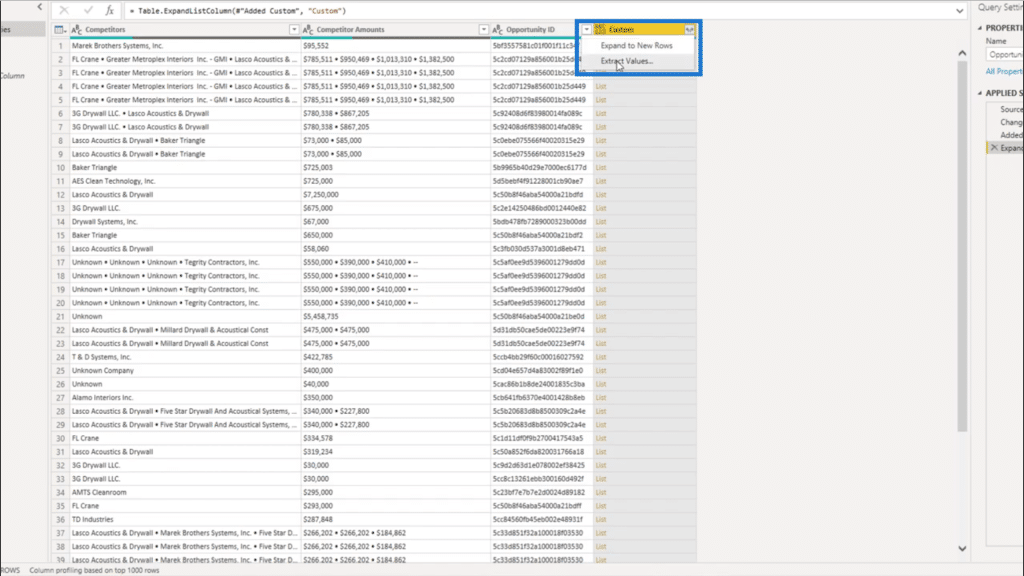
I’ll use the sideward arrows to the right of the heading of the Custom column to expand the data into new rows.
Pay attention to the second record as I expand to new rows.
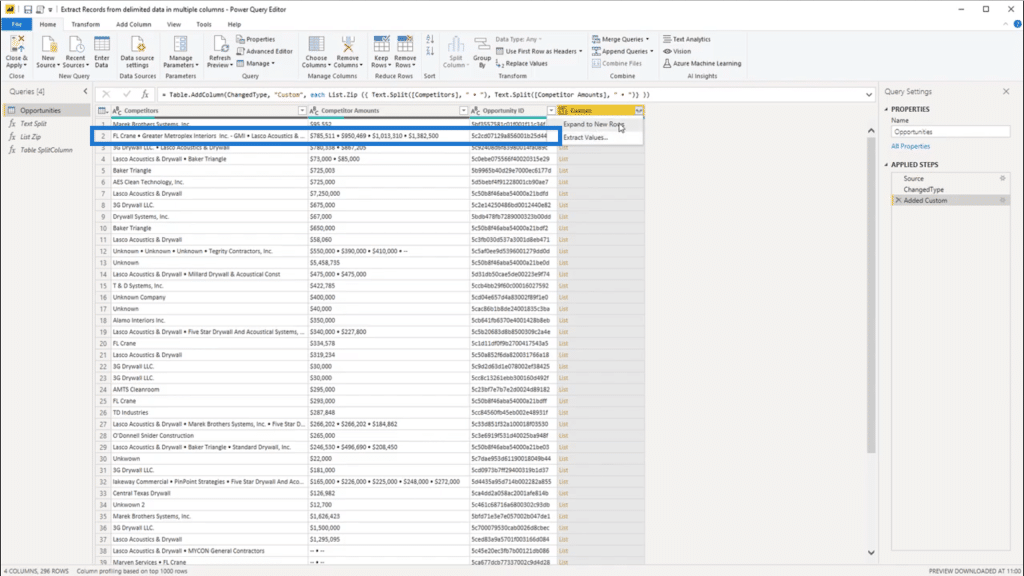
You’ll see that all the values from that record get expanded down.

And when I click off to the side in the white space, I can see the content of that nested list. Since the 1st record has only one value for each column, I’m also showing the same data at the bottom.
But when I click on the 2nd record, you’ll see that I’m only showing the 1st of the 4 values given in my delimited data.
On the third record, I show the combination of the second values.
So I’m going to use the sideward arrows again. But this time, I’m going to extract the values from that list.
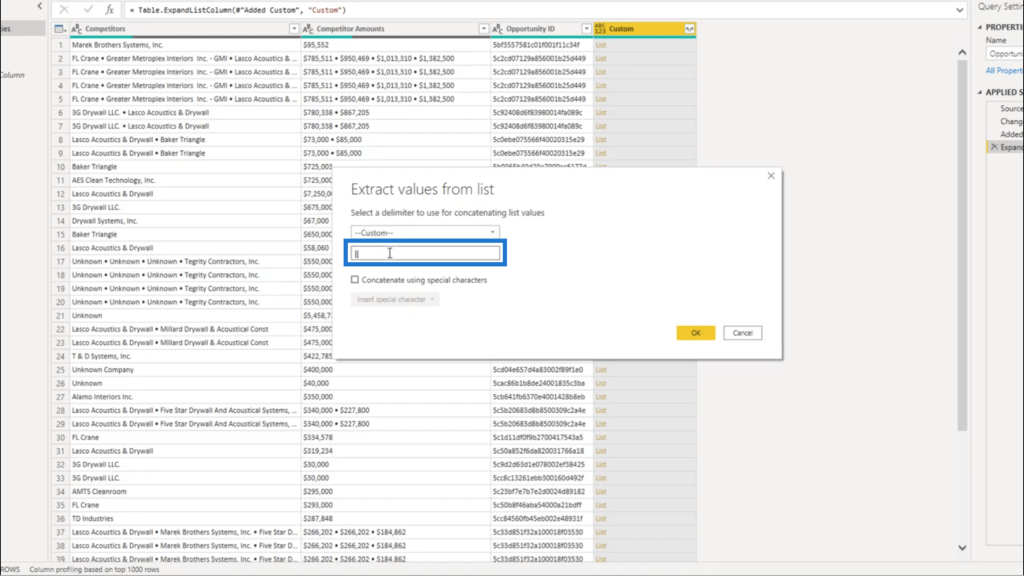
I’m going to give it a custom separator.
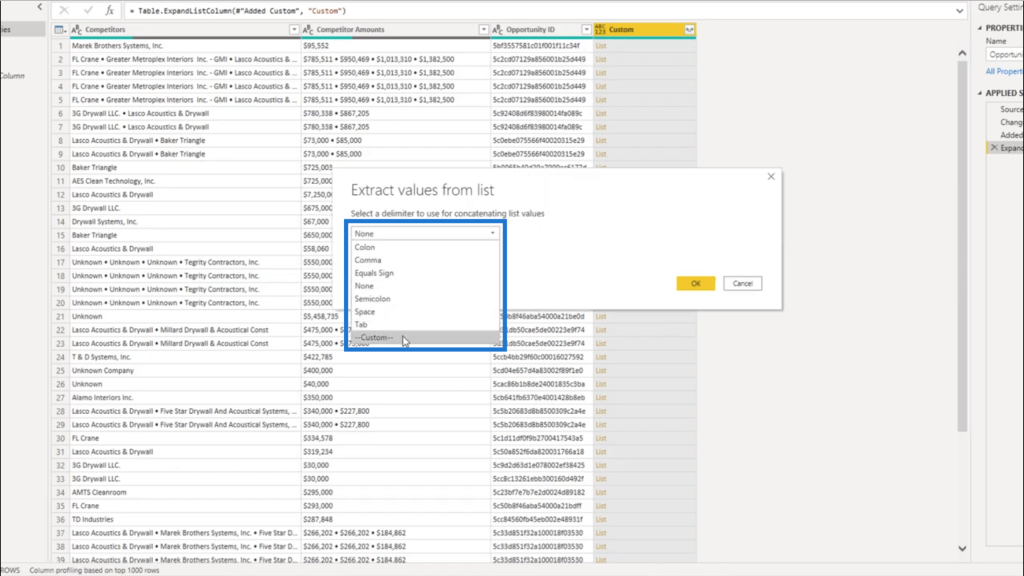
I’ll use the double pipe as my delimiter. This should make the distinction among the values in the delimited data clearer.

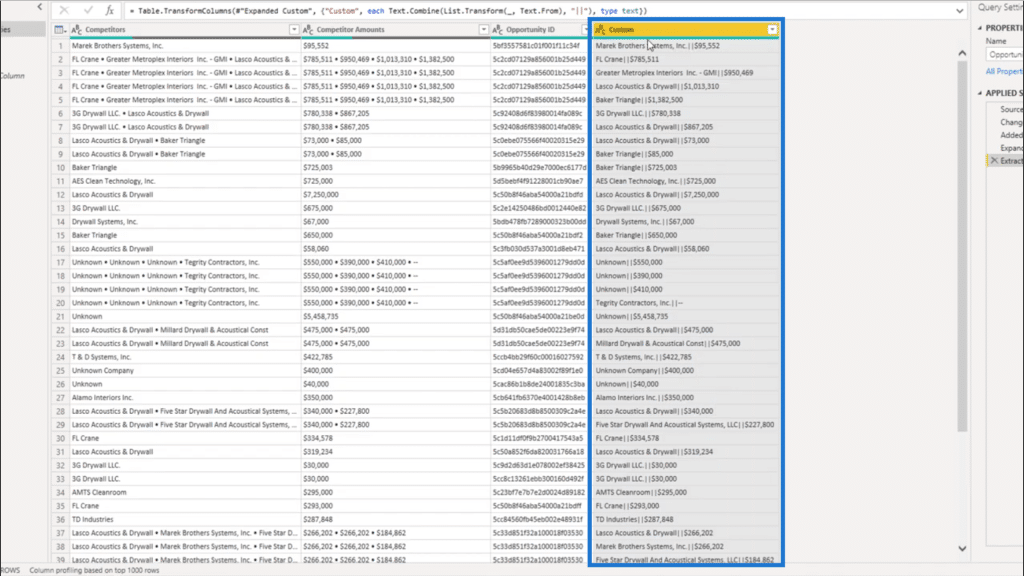
Once I press OK, the values are concatenated right into the Custom column.
Cleaning Up The Data
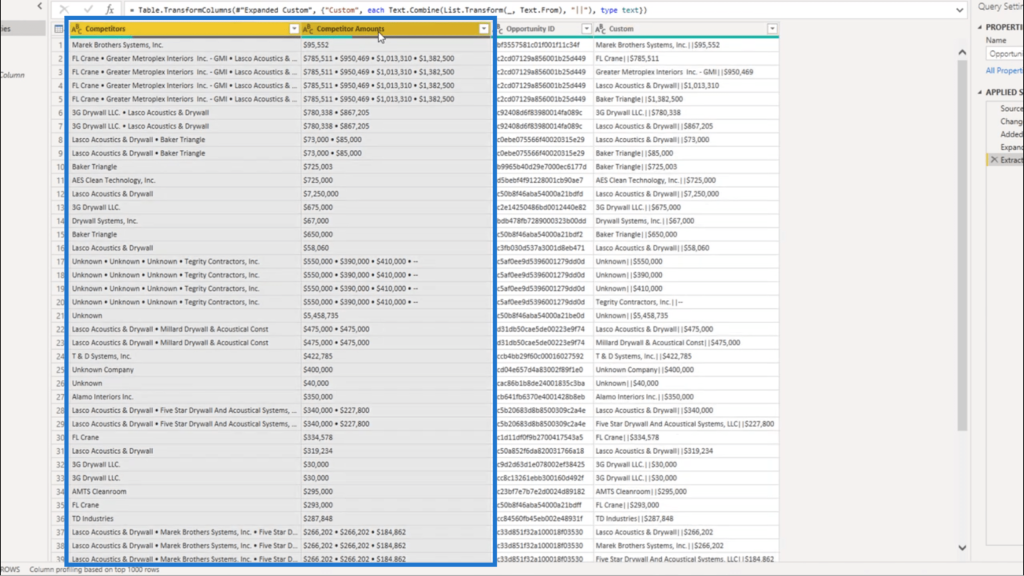
I no longer need the Competitor and the Competitor Amounts columns, so I’m going to remove those columns.
As for the Custom column, I’m going to split that.
On the transform tab, I’m going to select Split Column. I’m going to split it by the delimiter.
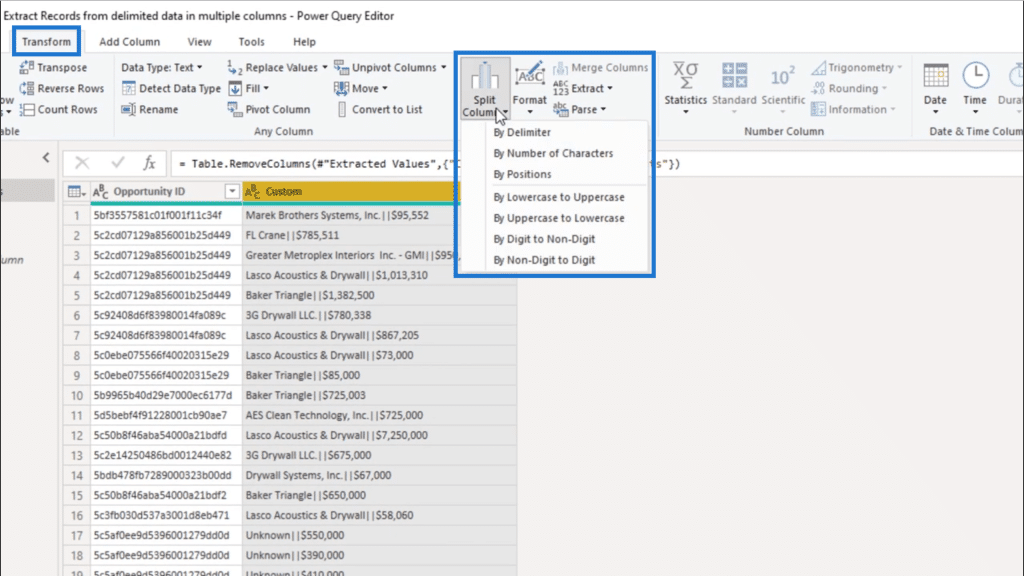
In the window, I’m going to give the double pipe as basis.
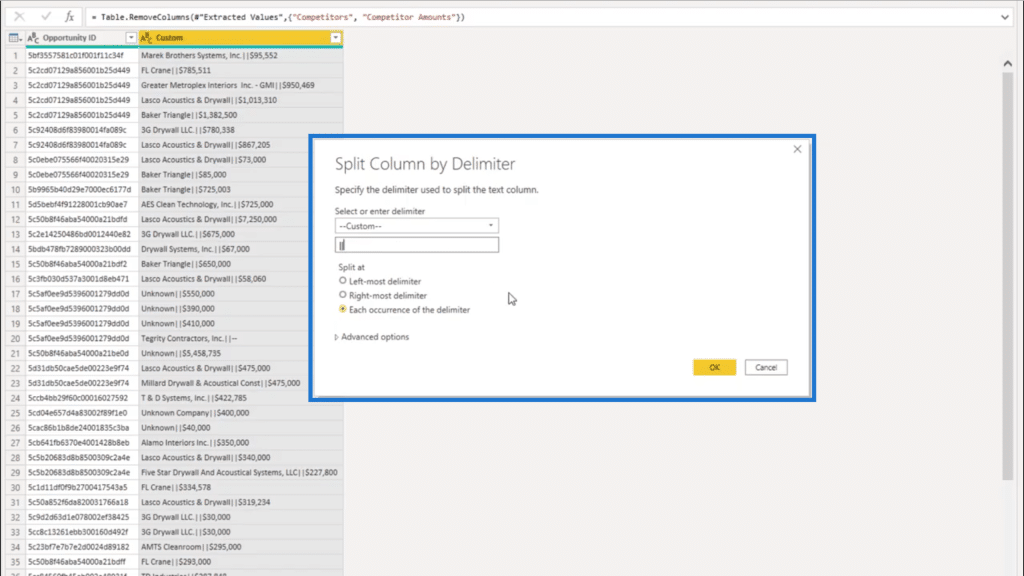
Once I press OK, the data will now be split into separate columns.
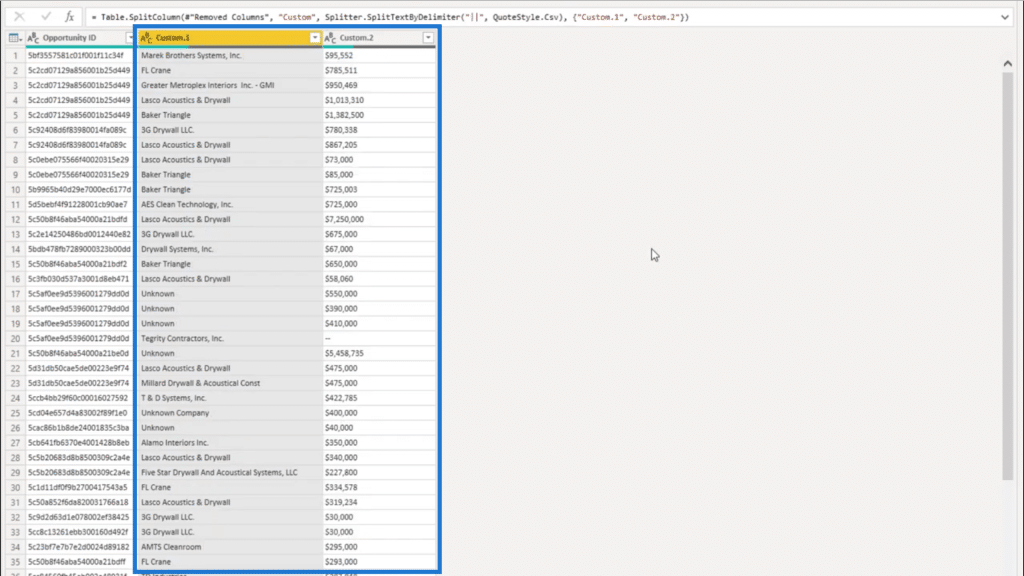
I’ll just rename these new columns to make it easier to figure out what the data is about. I’ll call this the Competitor column again.
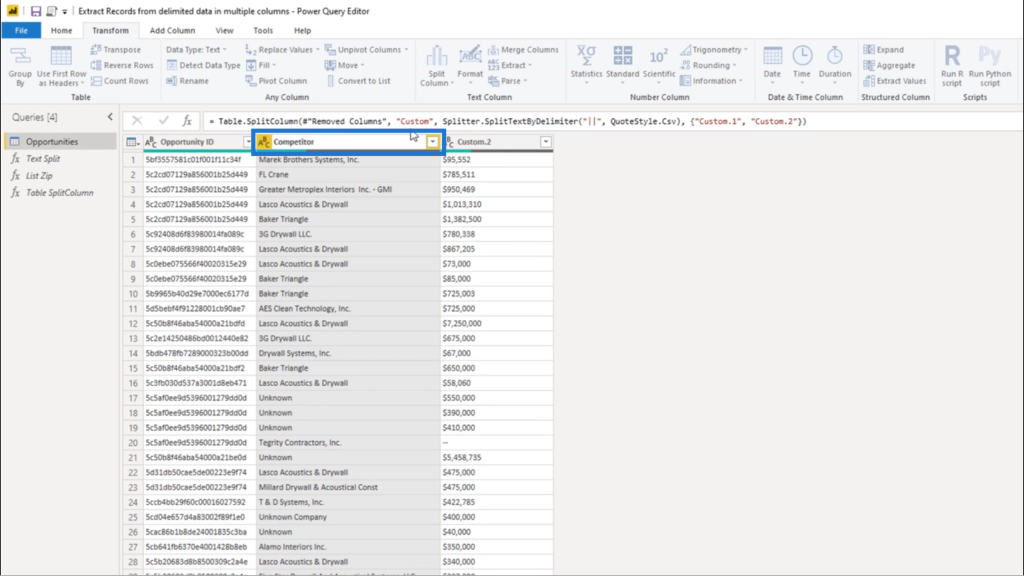
Then I’ll call the other column the Amount column.
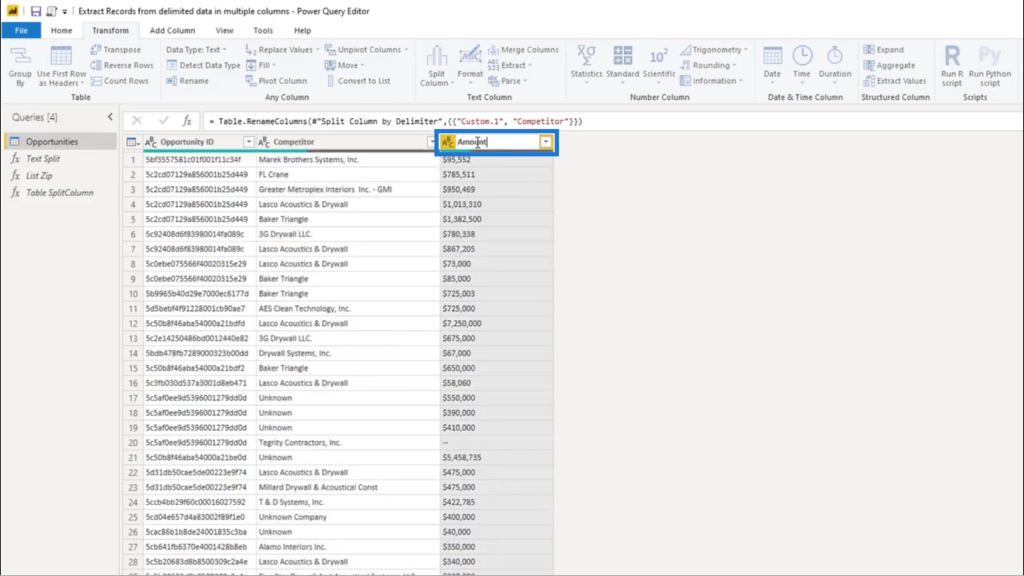
Obviously, the Amount column contains numbers. But if you look at the icon representing the data type, it shows that I have text instead of numbers. So I’ll start fixing that.
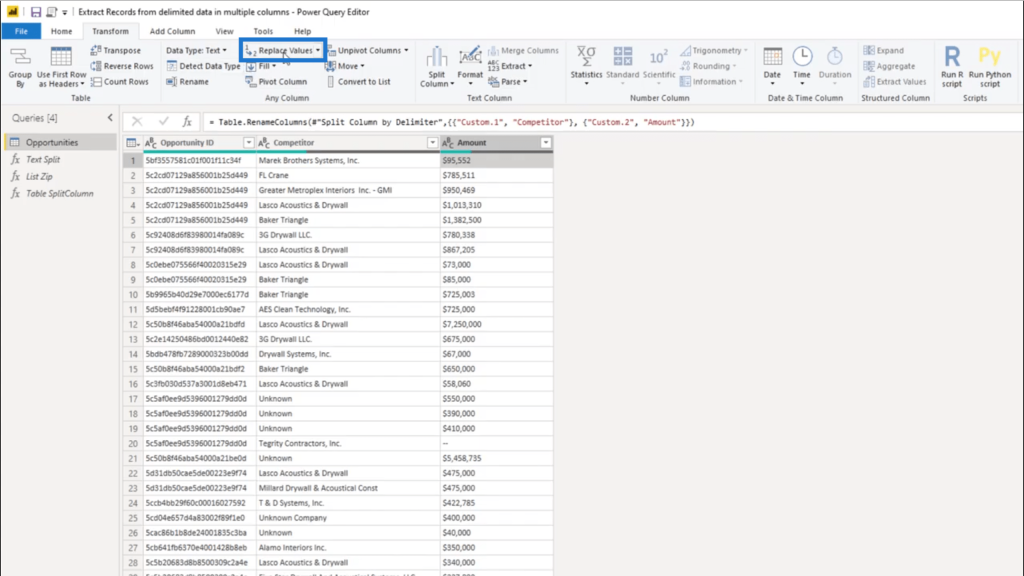
I’m based in Europe, so we use a period as a thousands separator instead of a comma. I’m going to use Replace Values to clean that up.
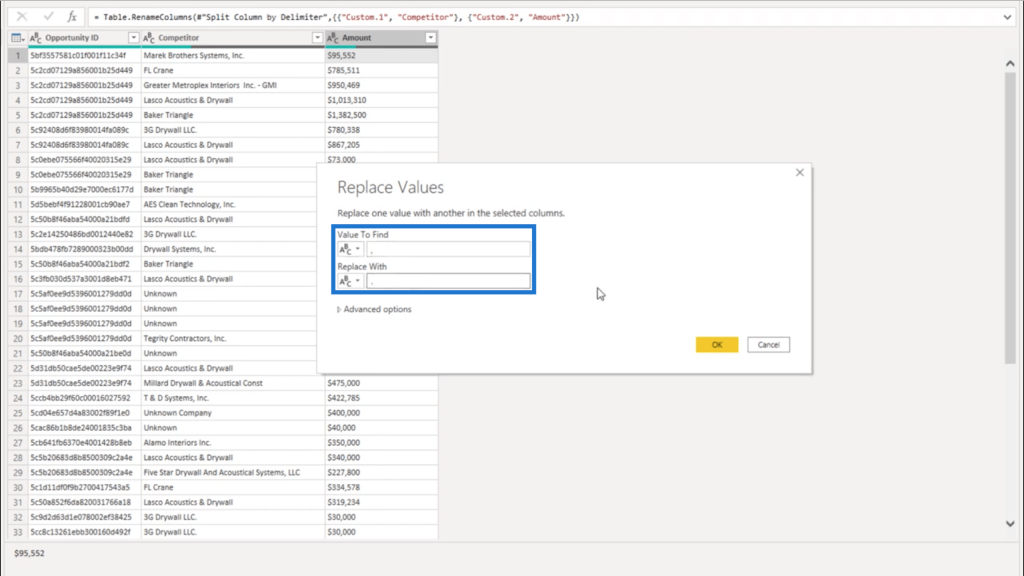
In the window, I just need to put a comma under Value To Find, and a period under Replace With.
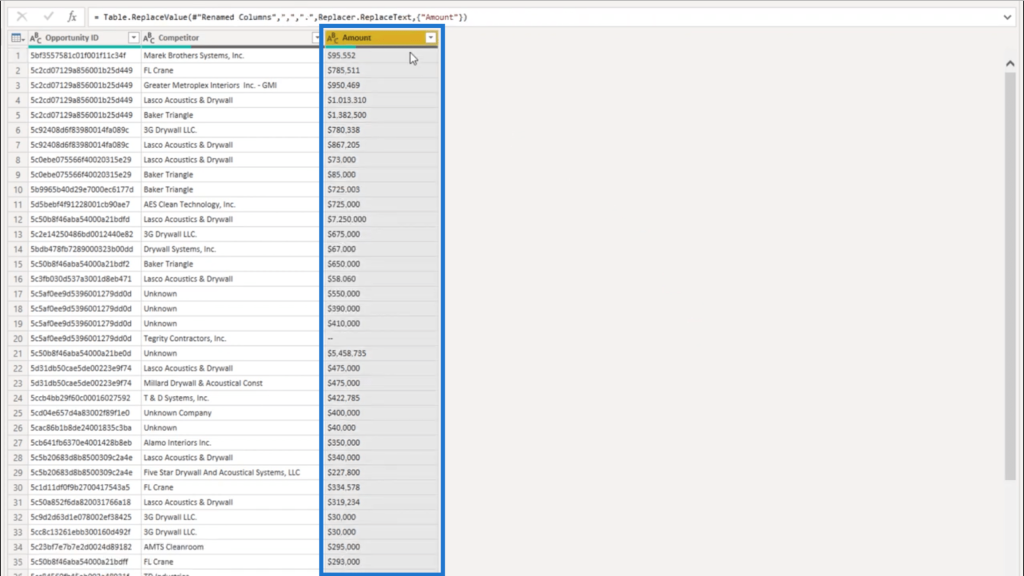
Once I press OK, all the commas will now show periods instead.
The next thing I’m going to do is remove the dollar sign in front of the values. Again, I’ll use the Replace Values tool. This time, I’ll leave the space for Replace With with a blank.
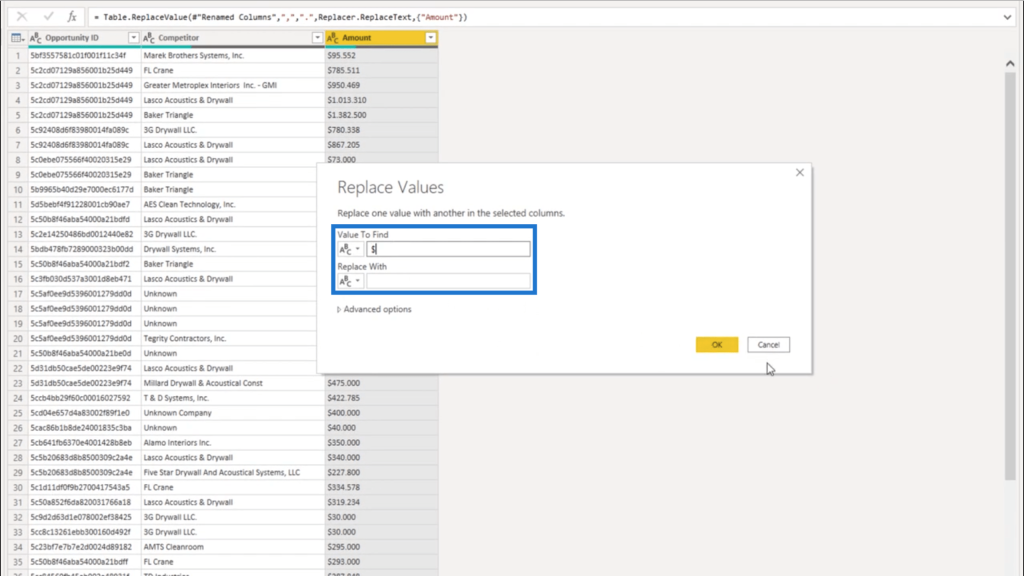
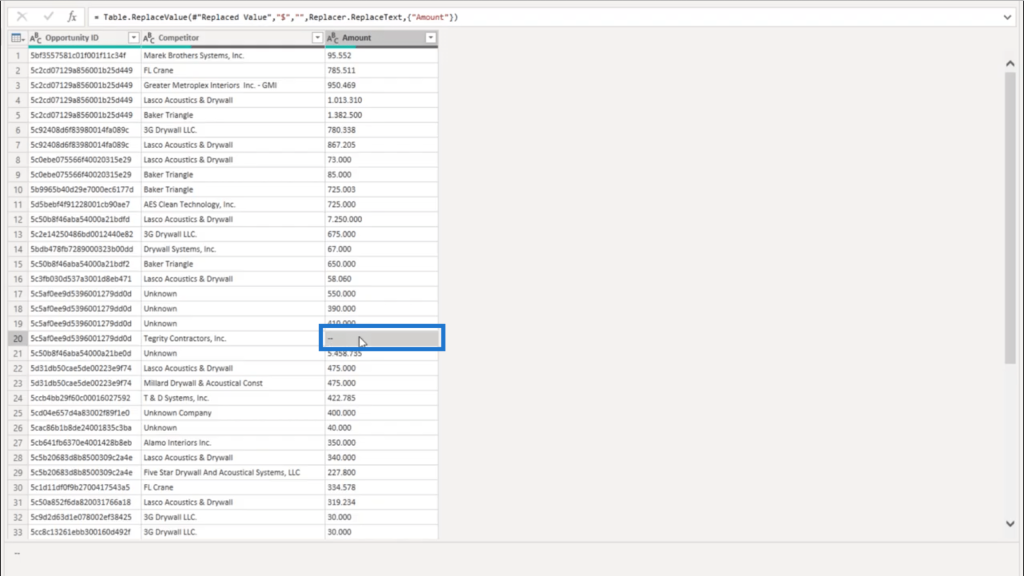
Once I press OK, the values will only show the numbers without any currency.
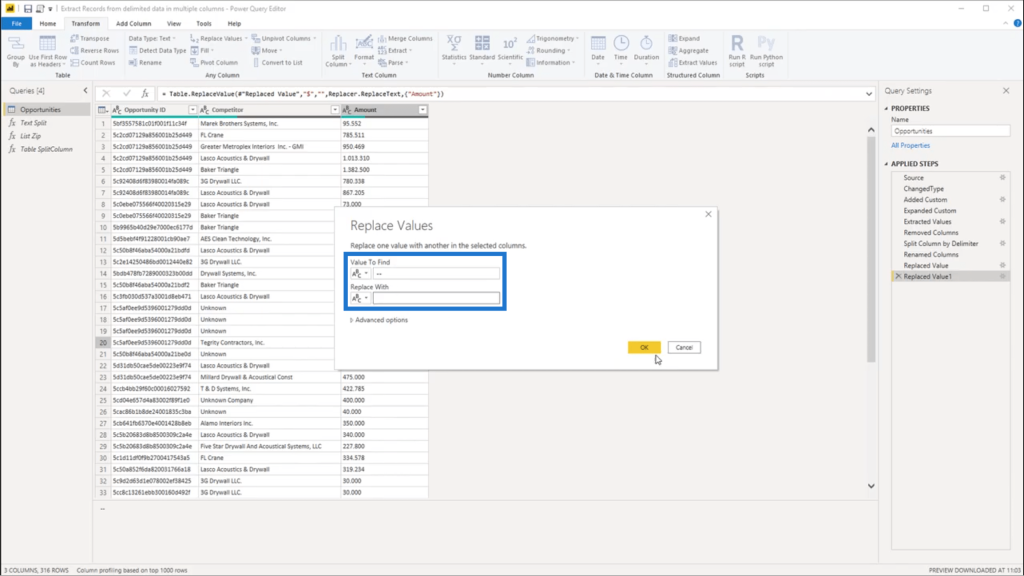
Looking down my column, it also shows an entry here with a double dash. Since that could return a possible error, I’m going to get rid of that double dash.
I’ll replace the double dash with a blank.
And once I press OK, I have the right format for all the entries under the Amount column.
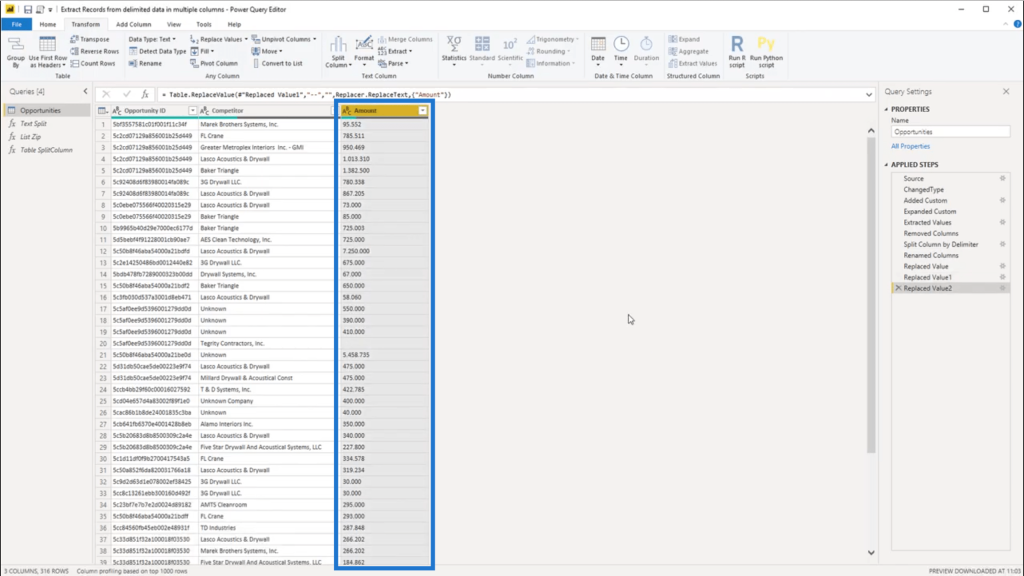
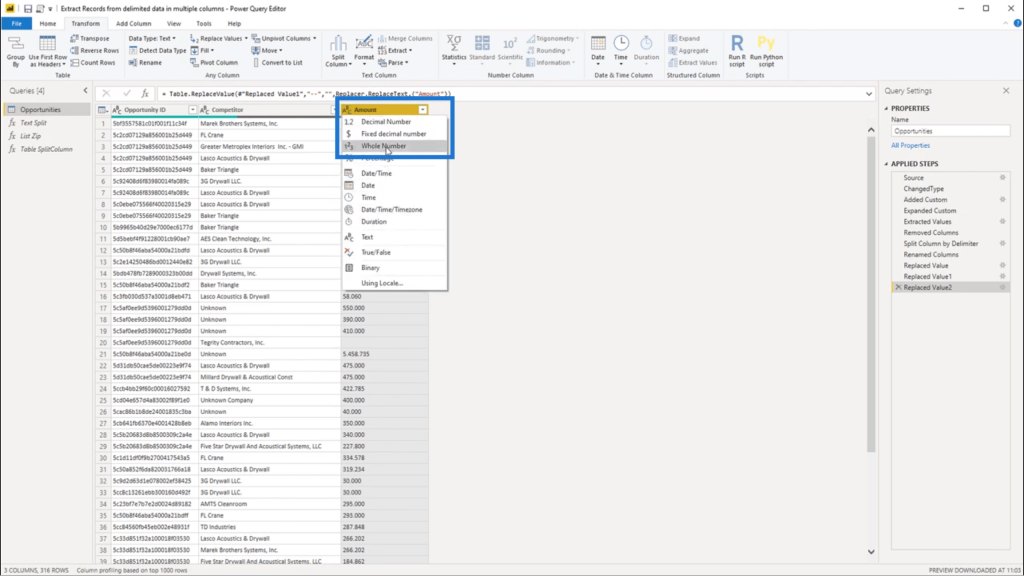
I can now click on the icon for the data type and choose Whole Number.
***** Related Links *****
Change Date Formats Using The Power Query Editor
3 Ways To Combine Values Using DAX Inside Power BI
Advanced Transformations in Power BI
Conclusion
As I mentioned earlier, you can extract values from delimited data in different ways. But for me, this approach is one of the easiest and fastest ways to do it.
Since I got the idea for this solution from one of the members of the Enterprise DNA community, this also shows how important the Enterprise DNA Forum is. You can really see each problem from many different perspectives. From there, you can just choose a solution that you think would work best for you.
All the best,
Melissa
***** Learning Power BI? *****
FREE COURSE – Ultimate Beginners Guide To Power BI
FREE COURSE – Ultimate Beginners Guide To DAX
FREE – 60 Page DAX Reference Guide Download
FREE – Power BI Resources
Enterprise DNA Membership
Enterprise DNA Online
Enterprise DNA Events


