Not too long ago, I completed an entire scenario method session for members of Enterprise DNA. I worked on an entire session which encompassed many types of analysis including lost customers, steady customers and new customer analysis. You may watch the full video of this tutorial at the bottom of this blog.
All of them involved great analytical work in order to maximize the business potential of this customer data.
In this particular tutorial, I want to break down how you actually calculate new customers in your reports.
But, it is certainly open to debate about what you would classify as a “new customer” based on your organization or industry. Is that someone who’s never bought since the beginning of your business? That piece of analysis is quite unique. But occasionally, you might want to actually put some sort of time frame on it. If a customer has not purchased in that particular period, you can consider them as new once they come back.
However, regardless of your definition, the technique will be very similar to the example that I will walk you through.
Understanding The Insight From New Customer Analysis
This tutorial is quite advanced and does require an understanding of table functions and virtual tables inside Power BI. But I’ll go through this in detail throughout the tutorial. I’ll also show you the formulas that you need to dynamically highlight this data in your Power BI reports.
First, I want to show you a sample analysis in this dynamic window.

In this particular case, I consider new customers to be those that haven’t purchased anything in the last 90 days.
To arrive at this model, I first need to set up the parameters and formula. To do this, click Modeling, and then click New Parameter.

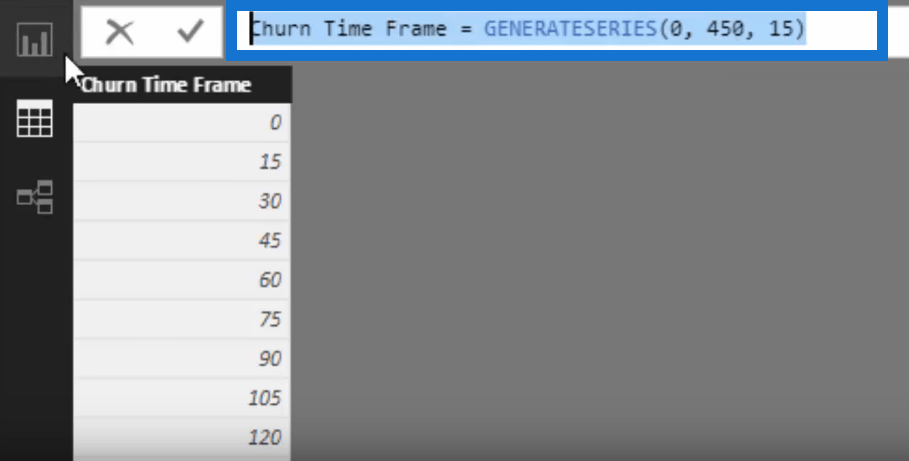
I also created a simple table for Churn Time Frame using the formula below.

Customer churn refers to the customers that stopped purchasing from a specific company’s product or service during a certain time frame.
Now, to make the analysis more dynamic, I can actually extend the churn time window. Originally, I have 90 but I can increase it to 180 days. I can even go to a shorter time frame as well.

We can use Amazon as an example. If you haven’t purchased anything from Amazon for 90 days or 180 days, they may consider you a lost customer. After this, they’ll probably send out some forms of marketing to get you back as a ‘new’ customer.
That’s the key thing that I’m going to talk about in this video. The key on how to actually solve or calculate these new customers which could say a lot about how successful your marketing efforts are.
Formula for New Customer Analysis
So let’s just run through this formula here for New Customers. This formula calculates the customers who have purchased something in the current month but haven’t purchased anything in the 90 days prior to that.

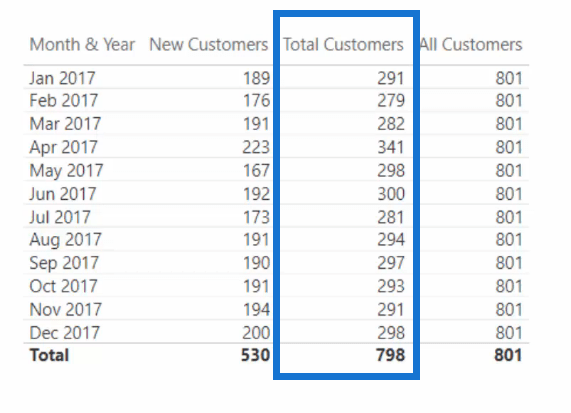
Firstly, the CustomerTM formula evaluates the customer sales for the current month.

You can see the results of this formula in the Total Customer column of the table below.

After that I used the PriorCustomer formula to look for those customers who have prior records for the past 90 days. It just means that they are steady customers.
Instead of the current context, we need to change the time frame or context of this table by using CALCULATETABLE.

I’ve also added the FILTER function to remove any context on dates and reapply the filter based on the 90-days time window. This is the crux of the formula.
Now, the EXCEPT function evaluates two of these tables. After that, it returns a table of unique customers.

After that, I’ve added the COUNTROWS formula to count the unique customers.

Subsequently, I can come up with the new customer analysis just like the one below.

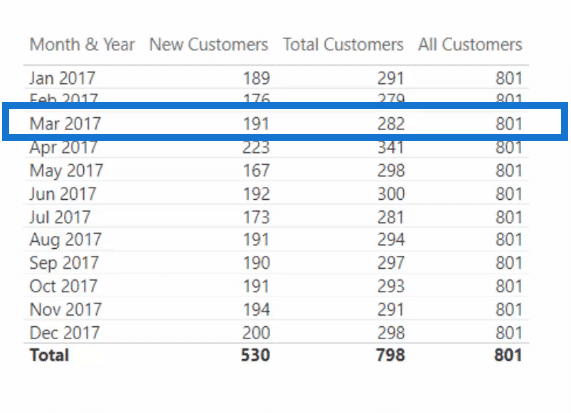
Let’s take a look at this example for the month of March 2017.

We have 282 total customers and that’s what the CustomerTM formula evaluates. Out of those customers, only 191 haven’t purchased anything in the past 90 days. Thus, we consider them to be new customers.
Using this new customer analysis can help you figure out if your marketing efforts are successful in bringing in new customers to your business.
***** Related Links *****
Discover How Many Sales Can Be Attributed To New Customers
New vs Existing Customers – Advanced Analytics In Power BI
Analysing Customer Trend Using DAX In Power BI
Conclusion
Generally, a new customer costs more than an existing customer. So understanding the trends behind who is purchasing from you is very important for a lot of organizations.
This is a really powerful metric to understand the makeup of your customers during any period of time. In this particular case, we will show it month by month.
This technique allows you to understand how much it is actually costing you to get revenue on board in your organization.
I’ll leave a link below in the description if you want to actually view this entire workshop. All you have to do is to upgrade your membership to be able to replay and download the entire resource.


