
If you’re an online retailer or a high frequency sales operation, then understanding your customer base, like if they are new customers or existing customers, is a really high quality insight that you can achieve using advanced analytics in Power BI. You may watch the full video of this tutorial at the bottom of this blog.
You’ll want to dive into this type of analysis because you need to evaluate if most of your sales are attributed to people who are brand new to your company, or if you are adding consistent value to customers and they’re coming back for more.
Implementing this in Power BI is not that easy. The DAX formula will likely take sometime to get your head around but it is so powerful from an analytical point of view. The insights that you can derive and implement effectively once you know what you’re doing are pretty incredible.

In this blog post, I’m going to walk through both formulas – the one where you need to calculate if a customer is new, and then how you can derive from that how many people are already customers or have bought before in a previous time frame.
Calculating Sales From New Customers
In this post, I want to show how you can calculate sales that came from new customers. There are heaps of scenarios where you can utilize this technique, especially if you’re a retail company and selling plenty of stuff online. You might want to analyze your sales and want to find out how much of that is coming from new customers. You also want to dynamically select any time frame and then dissect how much out of our Total Sales did we actually sell to new customers.
This technique can also be relevant to products. Let’s say you sent out a new product and you wanted to work out how many of your existing customers bought the product versus your brand new customers.
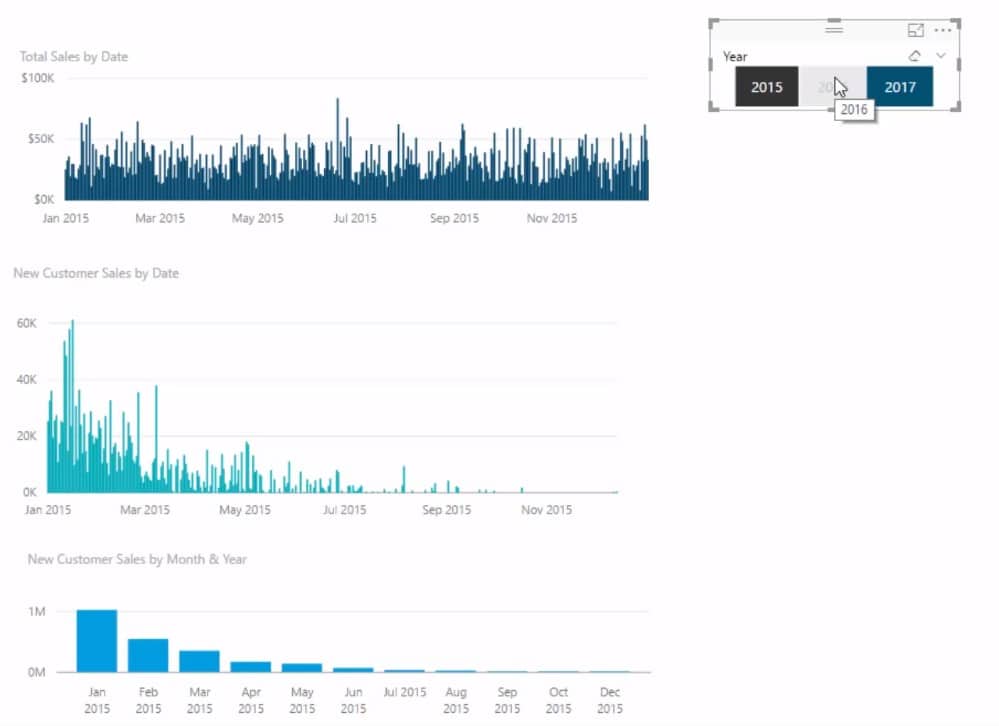
I’m going to walk through how we can create this using advanced analytics in Power BI but first, let’s take a look at our final visualization. We have the Total Sales by Date at the top and a year slicer beside it, which provides a dynamic view of sales coming from new customers. The middle chart provides the new customers on a daily basis while the bottom chart shows the month and year basis.
Creating The Date Table
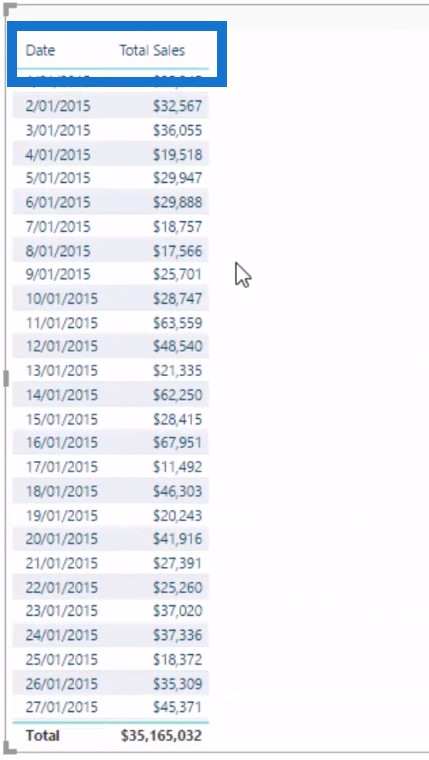
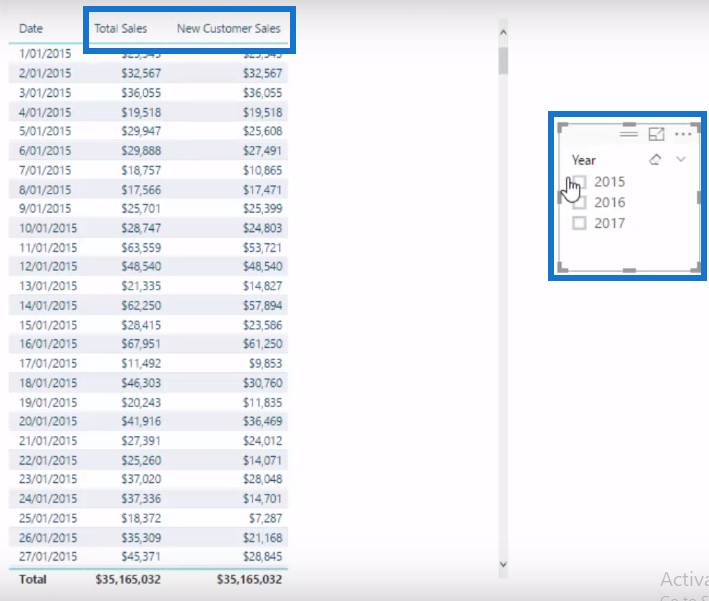
I’m going to show you the technique of how to create this using DAX on top of your data model. I’m going to set up a table with the Dates and Total Sales column, where we can see our Total Sales for every single day. The second step is to bring in a year slicer so we can jump between the years.
New Customer Sales
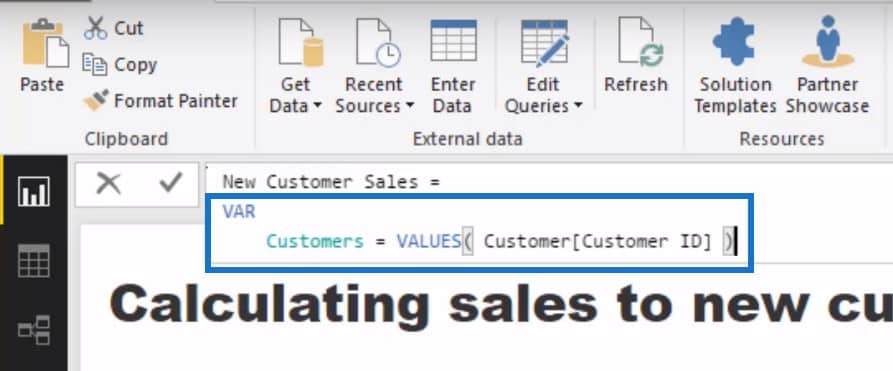
Now we need to write a DAX formula that says how much of the Total Sales are from new customers. I’m going to create a new measure and call it New Customer Sales. Don’t worry if this formula doesn’t make sense right away—I suggest trying it out first and then the understanding comes with time. This formula is a little bit complex so I’m going to use variables which makes it easier to understand.

I’m going to create a VARIABLE called Customers and then put a table of my Customer IDs inside of this variable.
Then I’m going down to a new row and type RETURN, which is the syntax of what you need to use when using variables. We’ll start widening our logic so we’ll use the CALCULATE function to calculate Total Sales. We’re still calculating Total Sales but this time we’re using a different context. It’s a quite complex logic but if you can get your mind across this, then you’re in a good shape to understand what DAX is actually doing for this calculation.
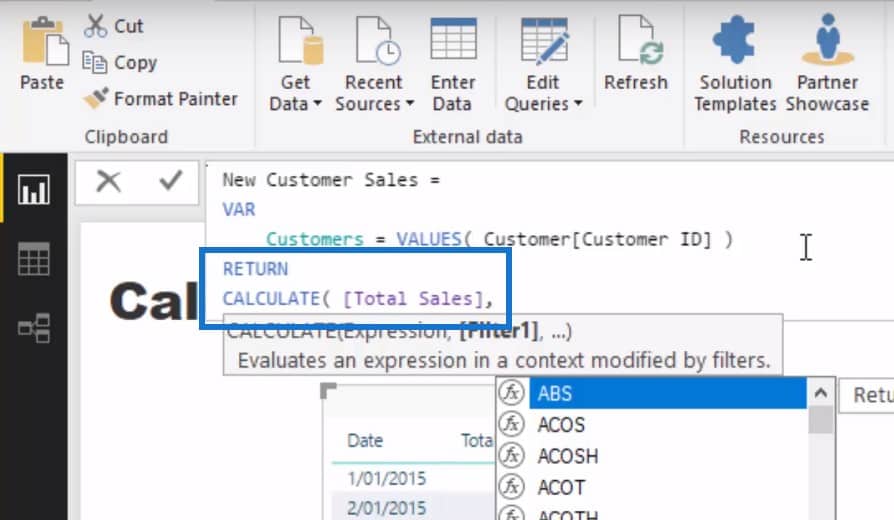
We’re jumping to another line and using the FILTER function. Within this filter I’m going to put Customers as my variable where it is going to say that for each customer I needed to do an evaluation, and evaluate if that customer has bought before.

Once I’m done writing the formula, I am going to drag the measure into the table to see what it actually calculates. This is going to take a while because there’s a lot of internal calculation or in-memory calculation going on here. Now if we just rearrange this a little bit and format the table into dollars, this is what it looks like.
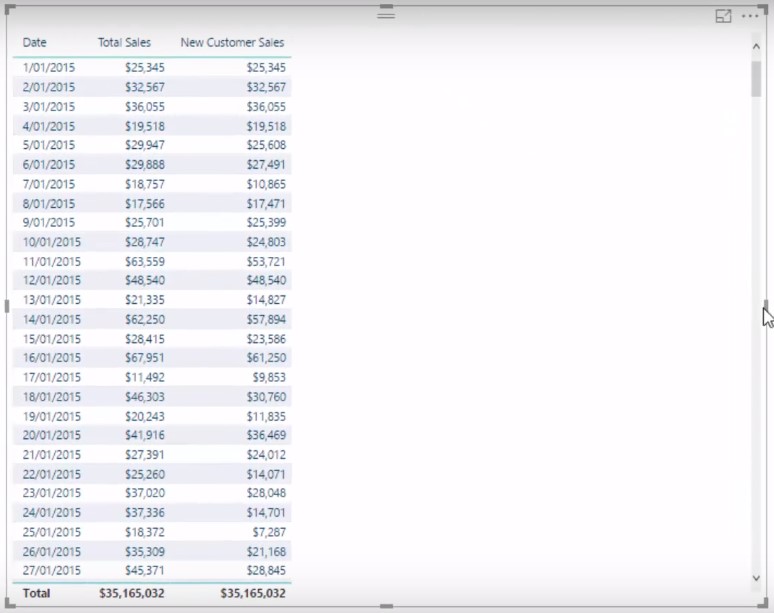
You can see now that we have our Total Sales and New Customer Sales. You can also see that when I click on any time frame selection in the Year slicer, the New Customer Sales column changes with it.
The first thing I worked out here was the Customers Variable which is just a table of Customer IDs.

Working Out The Logic
To come up with the second part of the formula, we need to recognize the initial context. For each particular row, the Customers Variable goes in and finds every customer which bought during a particular day. For each of these customers, it will then iterate through the Dates table to find out if that customer existed and have bought before.
If they have bought, then it is going to equal to greater than 0 and it’s going to basically cancel out. But if they haven’t bought, then this logic is going to return TRUE and that customer is going to remain in the context.

Each customer that bought something on that day is being evaluated if they had bought on any previous day in the current context. This is what exactly this logic does here.

Existing Customer Sales
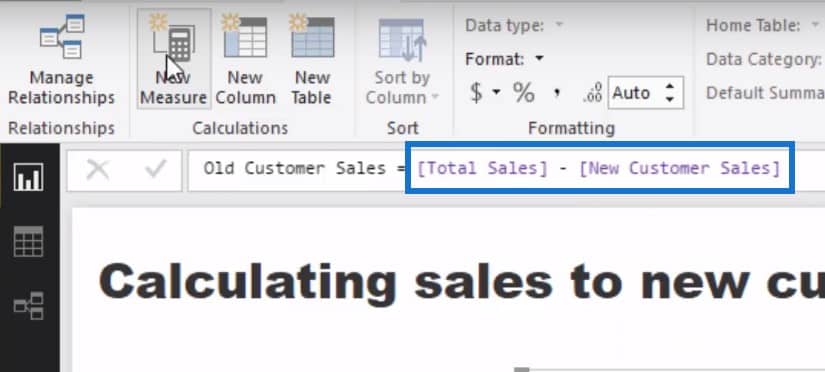
So that’s the formula we use to return the sales of new customers. You can even go further than this and think about how you can work out the sales of your existing customers. You can easily branch out from here because basically all you have to do is deduct New Customer Sales from Total Sales.
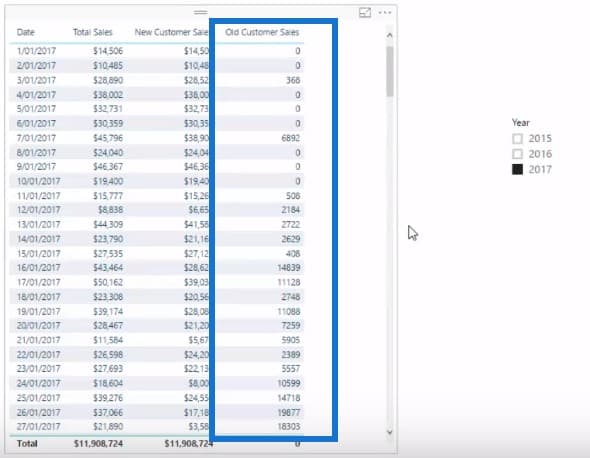
We will then drag the Old Customer Sales into our table.
Visualising The Data
The last step is to turn this table into a visualization which will give you the distribution through time of new and old customers.

You can keep this dynamic, so you can actually utilize the data model and see from any year who is a new customer and who returned and bought more from you. You’ll quickly see how you can apply this in lots of different ways.
***** Related Links *****
Discover How Many Sales Can Be Attributed To New Customers – Advanced Power BI Insights
Calculate The Total Of New Clients You’re Onboarding Every Month – Advanced DAX
Discover What Was The Initial Product A Customer Purchased Using DAX
Conclusion
This technique is very practical and you could jump to any time frame and analyze, based on the marketing promotion activity that you may run, how many people make a purchase, how many of those sales came from existing customer versus new ones, and also what were the long term implications of your promotions on overall sales.

So as you can see, this is some really high quality stuff. It’s really an amazing use of advanced analytics in Power BI. Try and learn this well and it will put you in a good position to develop some really compelling reports in Power BI.


