You might encounter a requirement where you’ll need to display the ratio percentage of a particular level in your data against a parent level. Many might find this to be a tricky task as there is no straightforward function to achieve this result. In this tutorial, I am going to demonstrate how you can calculate percentage in Power BI in hierarchical form. You can watch the full video of this tutorial at the bottom of this blog.
When we calculate the percentages for each line item by dividing Total Sales by the overall aggregated sales, we get the percentage of Total Sales for each line item.
But how do we calculate it when it is present in the form of a hierarchical feature that is created in the form of a subcategory? Let’s see how we can calculate the percentages in a hierarchical form.
How To Calculate Percentage In Power BI Hierarchically
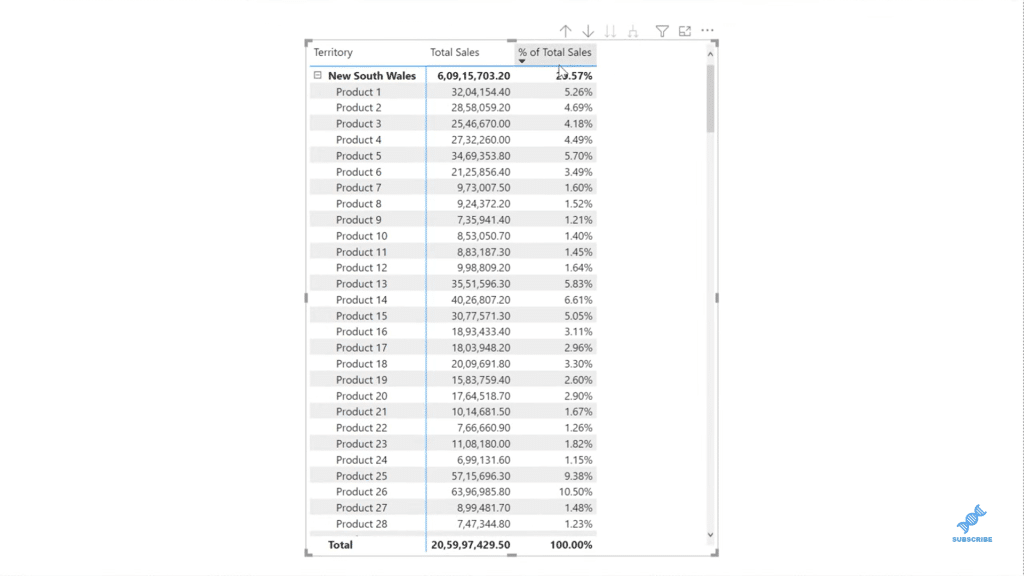
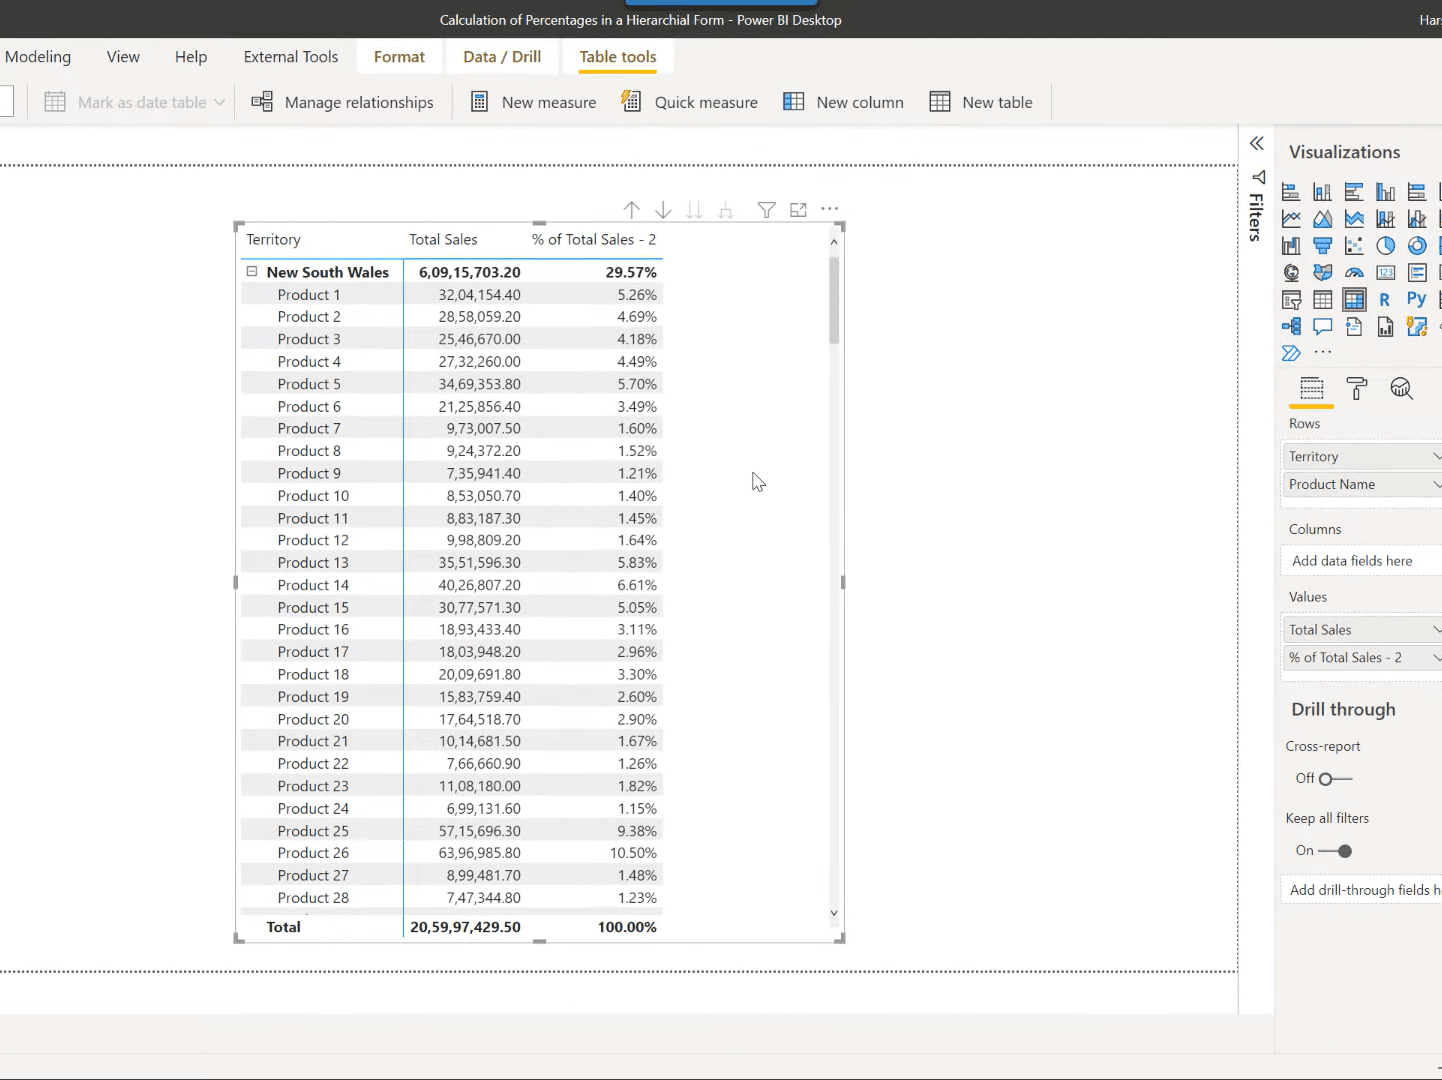
In the matrix, we have created a hierarchy of rows. The first level of the hierarchy contains the territory from the Regions table whereas the second level of the hierarchy contains the product name from the Products table. We have the percentage of Total Sales for each territory, where the Total Sales is getting divided by the overall aggregated sales.
But when we move down to the next hierarchy, we’ll see that the percentage of Total Sales for each product is getting divided by the Total Sales of that particular category.
The Total Sales of Product 1 is getting divided by the overall Total Sales of New South Wales territory. The same goes for Product 2, and so on.
Now, let’s write the formula from scratch and evaluate it step by step.
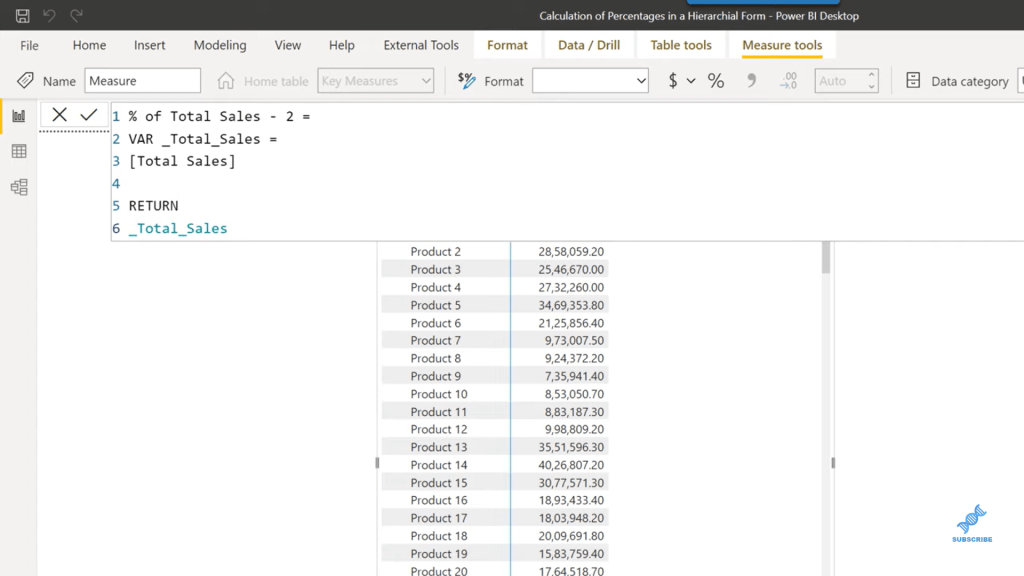
Let’s call this measure % of Total Sales – 2. We’ll create a variable for Total Sales, which calculates the Total Sales for each individual line item, and this will return Total Sales.
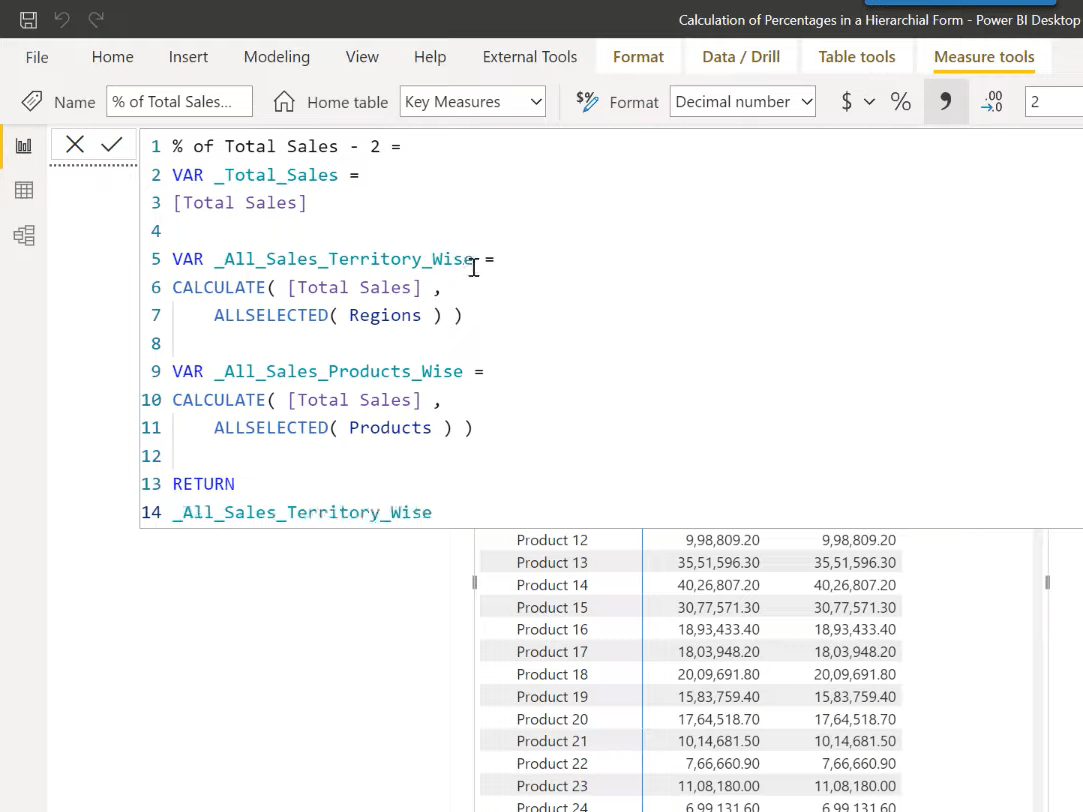
Now we’ll create two variables. The first variable will help us calculate the overall Total Sales for all the territories. The second variable will help us calculate the overall Total Sales for all the products that are being sold inside that particular territory.
Let’s start with CALCULATE Total Sales and call out the ALLSELECTED function. Then we’ll reference the Regions table since all the territories come from the Regions table. Let’s use the same logic for the Product calculation as well. We’ll just change the variable name and the table reference as well.
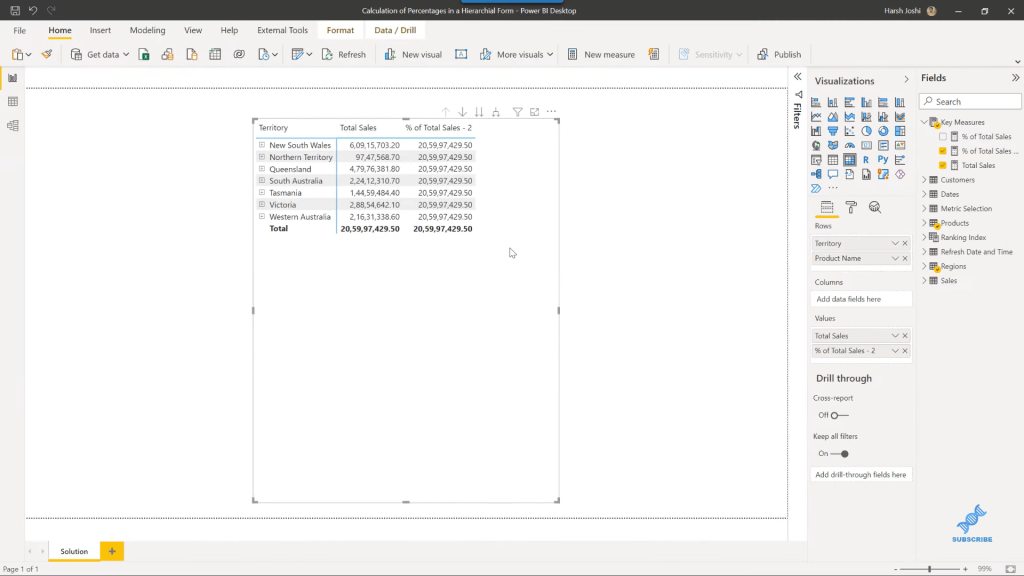
So now, let’s call out these variables under the written statement. Let’s have the first variable.
As we can see, for each territory, we are getting the grand total result, which is as expected.
Let’s check out the results for the Products, which we should get per each individual territory for all the products.
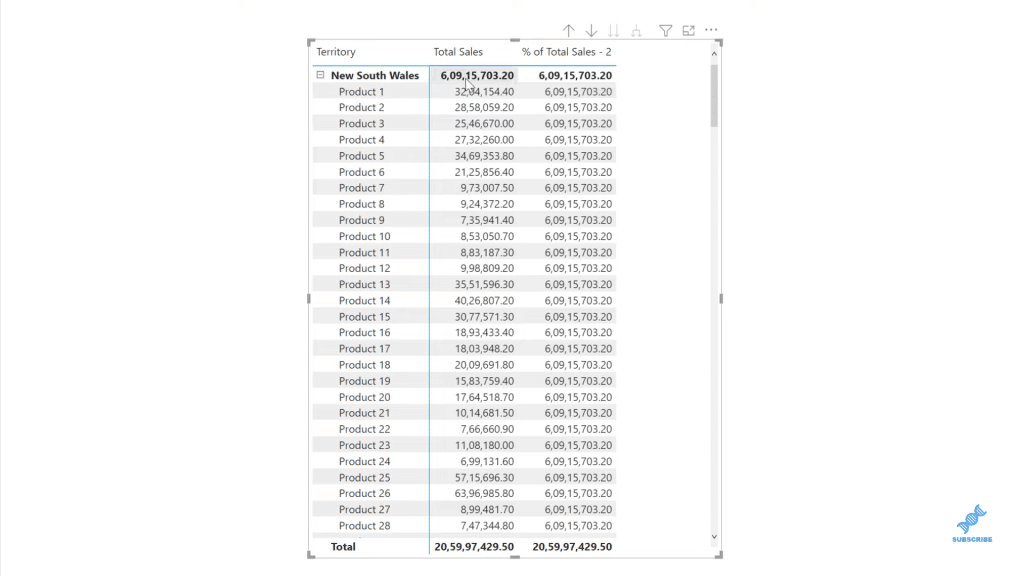
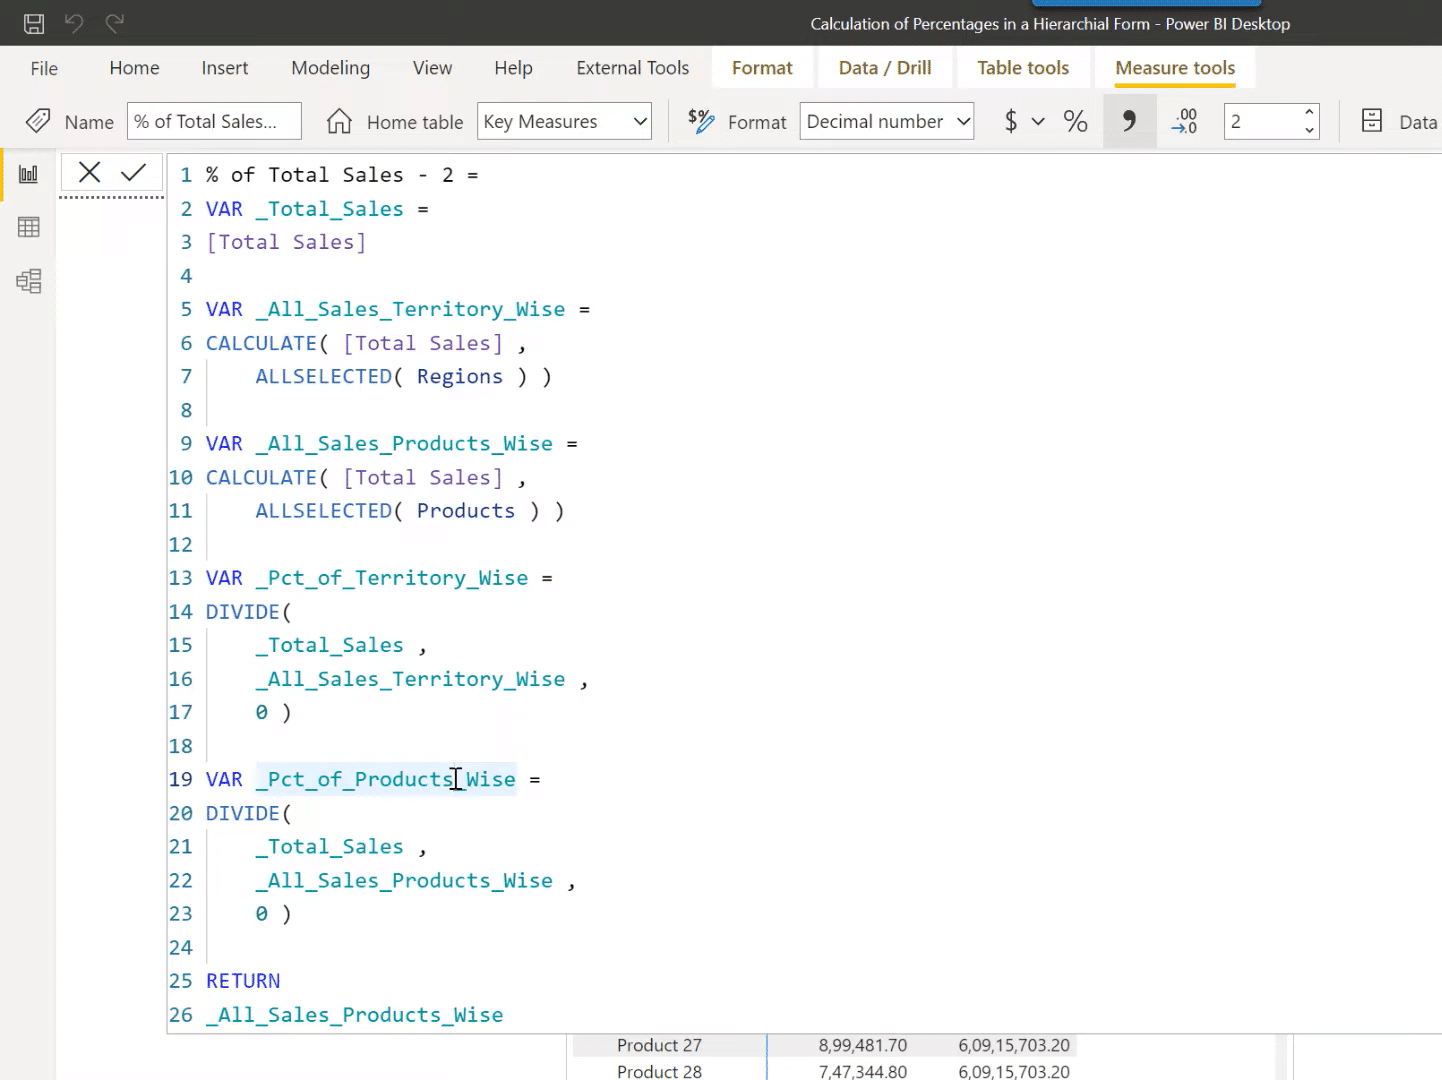
Next, we’ll create the two sets of variables that will help us in calculating the percentage for Territory_Wise as well as for the Products_Wise.
We’ll use the DIVIDE function and divide our Total Sales by the Total Sales of territory, with the alternative result as zero. The same goes for the Products as well. Let’s just change the variable name and the variable reference.
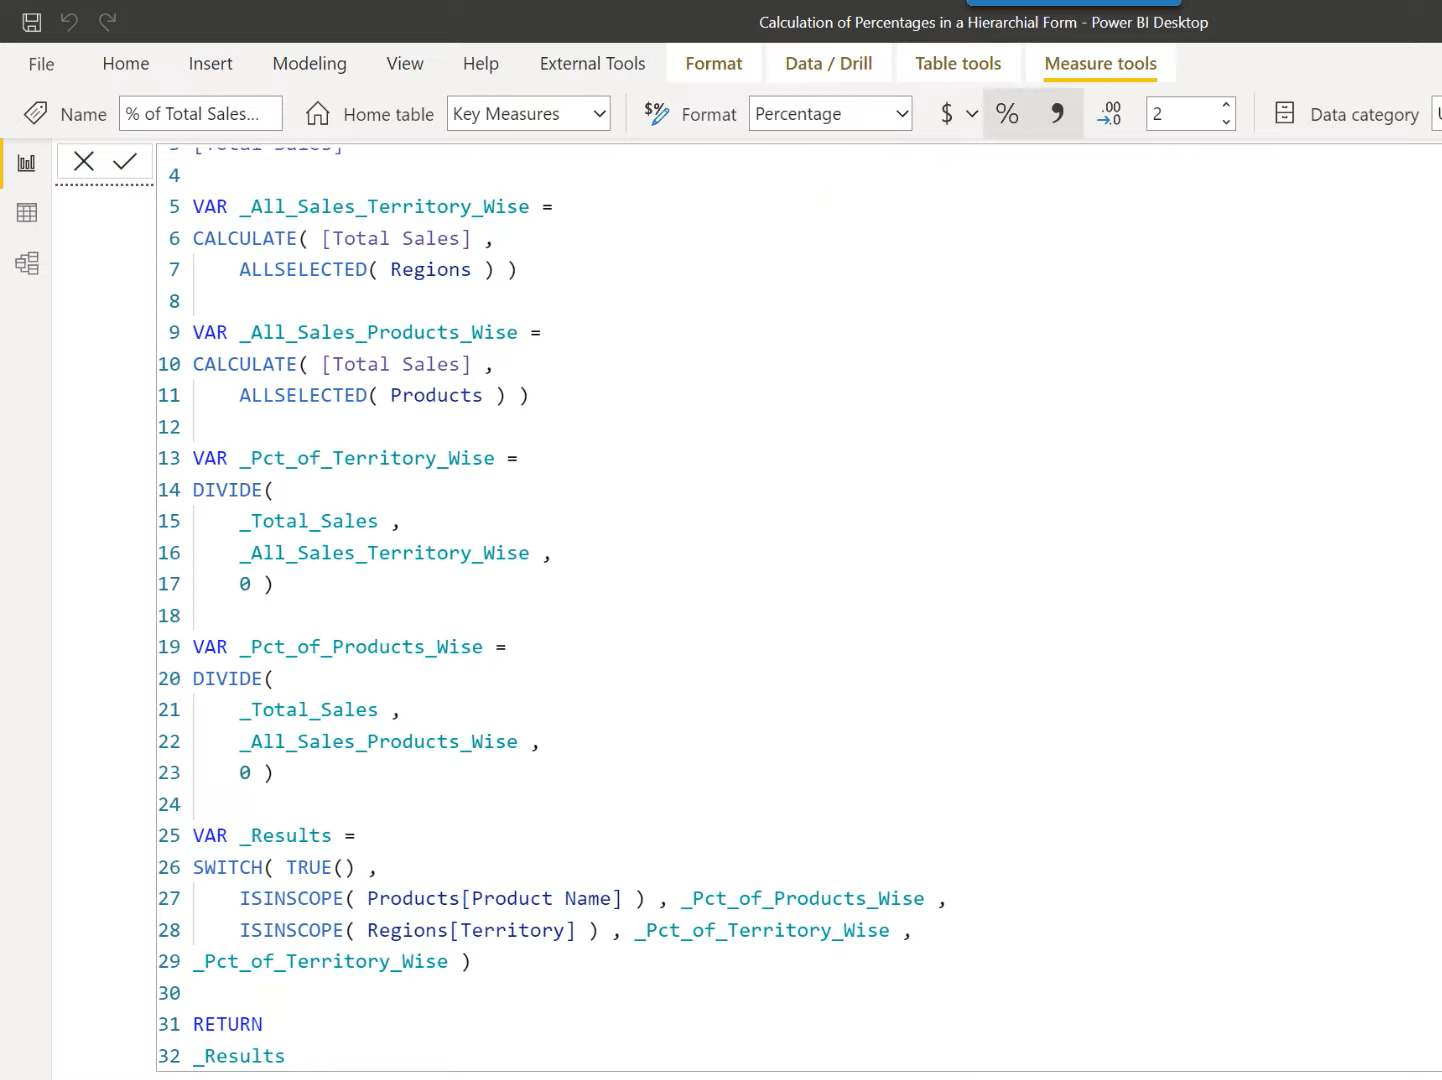
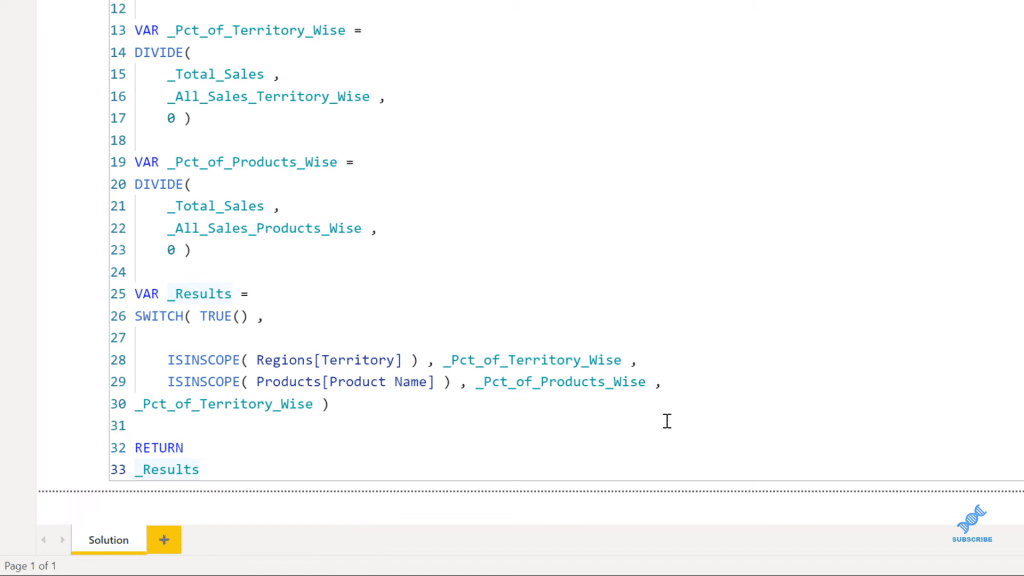
Lastly, we will define our final variable, which will be the RESULTS variable. It will contain a SWITCH TRUE statement with the condition that if it’s a territory, then we want a result to be a Percentage of Territory; if it’s a product name, then we want the results to be a Percentage of Products_Wise.
Otherwise, we want a result to be as Percentage of Territory_Wise. We want to show our grand totals to be a hundred percent.
We will use a function called ISINSCOPE. This function retains a value in the form of true or false. Then, let’s bring the results under the written statement, and let’s format our results into percentage form.
As we can see, we are getting the expected results.
Finally, let’s see what happens when we change the order of our condition inside the SWITCH TRUE statement.
The results are actually not correct. The reason being is if we divide our 3 million Total Sales for product 1 by the 60 million Total Sales for New South Wales, we should be getting around 5 as a result, but rather we are seeing the results at 34%.
What happened here is that DAX calculates the innermost context first, and then moves towards the outermost context.
Therefore, in the case of hierarchies, our order of conditions also needs to be arranged accordingly.
In this case, our Product names are located at a lower level in the hierarchy, so they will go first as a condition. Since the territories are in the upper level or first level of the hierarchy, they will go last.
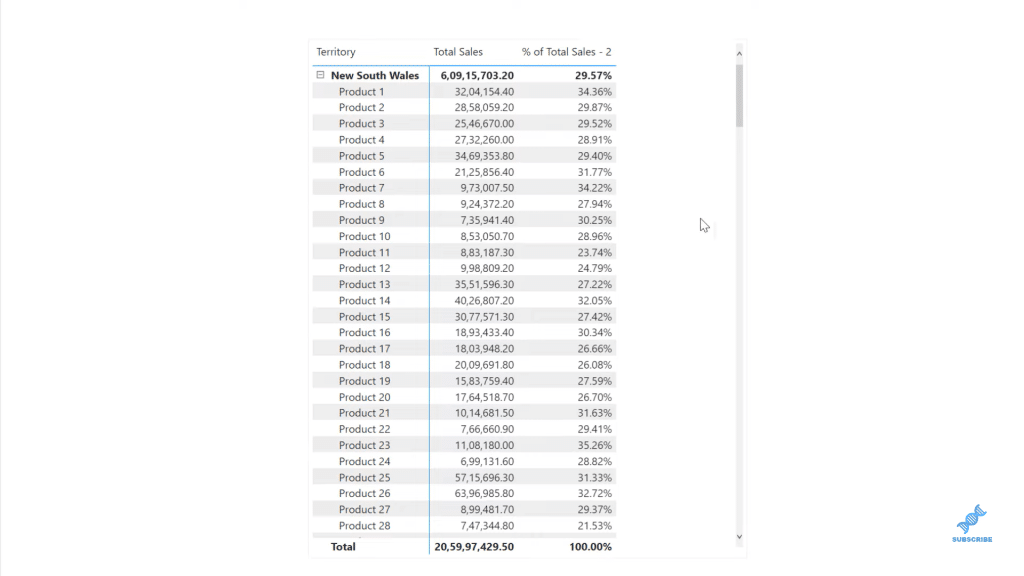
So, let’s change the order of our condition again to go back to normal. That will give us the correct results.
***** Related Links *****
Hierarchies In Power BI Visualizations
MultiIndex In Pandas For Multi-level Or Hierarchical Data
How To Organize Your Power BI Data Model – Best Practice Tips
Conclusion
In today’s tutorial, I’ve shown you how to calculate percentage in Power BI in a hierarchical form. I’ve walked you through how it’s done by using a simple measure with some DAX functions and a SWITCH TRUE statement.
I hope you find this one helpful. You can watch the full video tutorial down the link below. Check out the related links as well for more similar content.
All the best!
Harsh
[youtube https://www.youtube.com/watch?v=wbIkcRBlOao&w=784&h=441]


