
In this tutorial, I’ll talk about Power BI anomaly detection, which is a new feature that was released late last year. As an example, I’m going to use one of the reports I submitted as part of the 10th Power BI Challenge.
The Power BI Challenge is done twice a month on the Enterprise DNA Forum. It involves real-life scenarios where participants can see how Power BI can be applied across different industries. It’s also a great way to try out different Power BI features, like anomaly detection.

Activating Anomaly Detection In Power BI
Power BI anomaly detection was still fairly new when I started working on this report. This function helps enhance visualizations by detecting inconsistencies in time series data.
Initially, I was unsure about its value and how it can benefit my reports. As I dug deeper into what it can do, I realized that this was a great call for the Power BI team. I’m also sure that over time, they will find ways to further improve on the feature. But in its current form, it already contributed a lot to my report development.
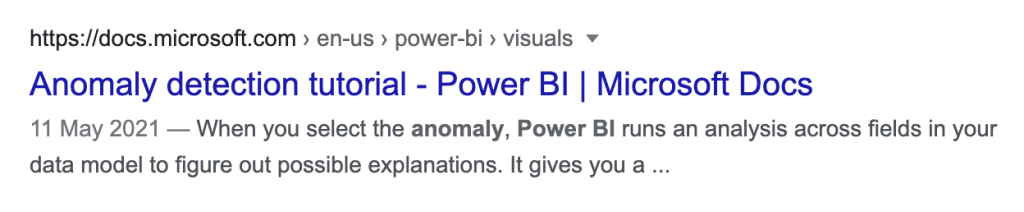
You can find out more about what anomaly detection can do through a simple Google search. If you look for “anomalies in Power BI”, the first result will show a Microsoft document that goes through the different capabilities of anomaly detection.
Now, I’m going to show you how I used Power BI anomaly detection on my report.
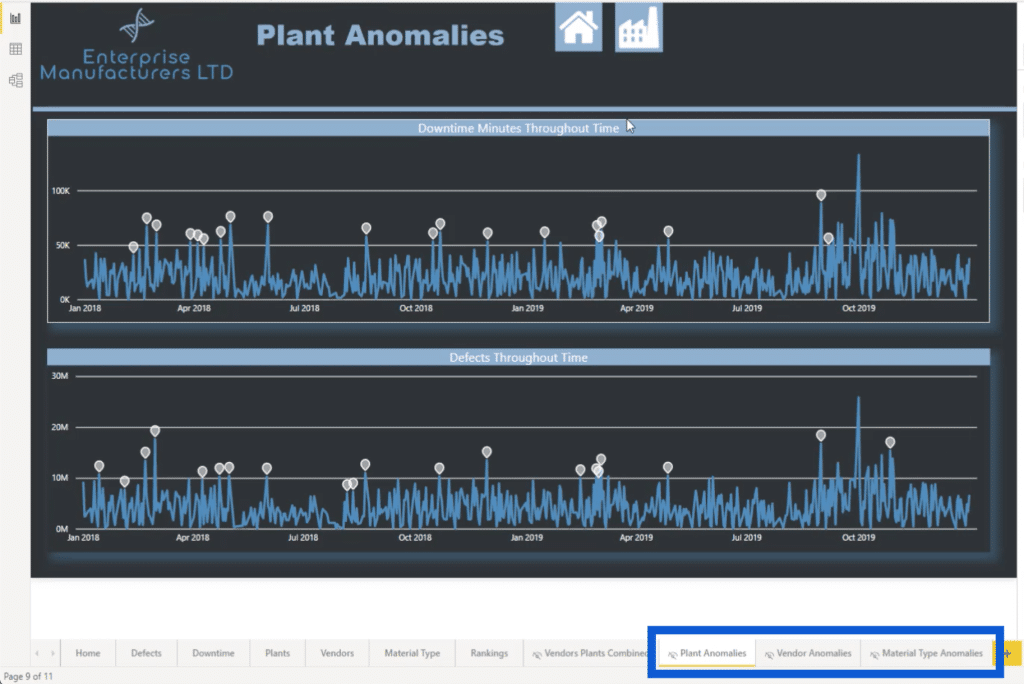
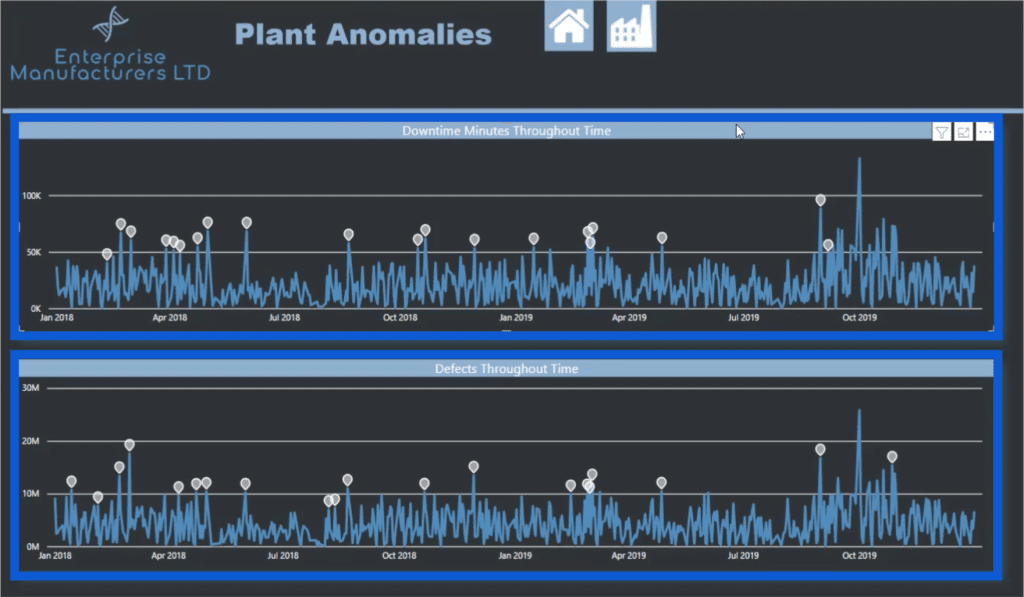
This is one of the pages on my report, which shows Plant Anomalies. And if you look at the bottom of the page, you’ll see that I actually have three different slides that cover anomalies.
I’ve set up this slide as a hidden slide, that’s why it shows this icon beside the slide name.
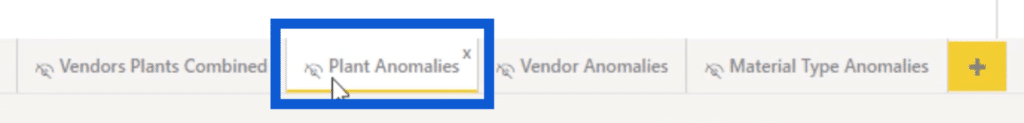
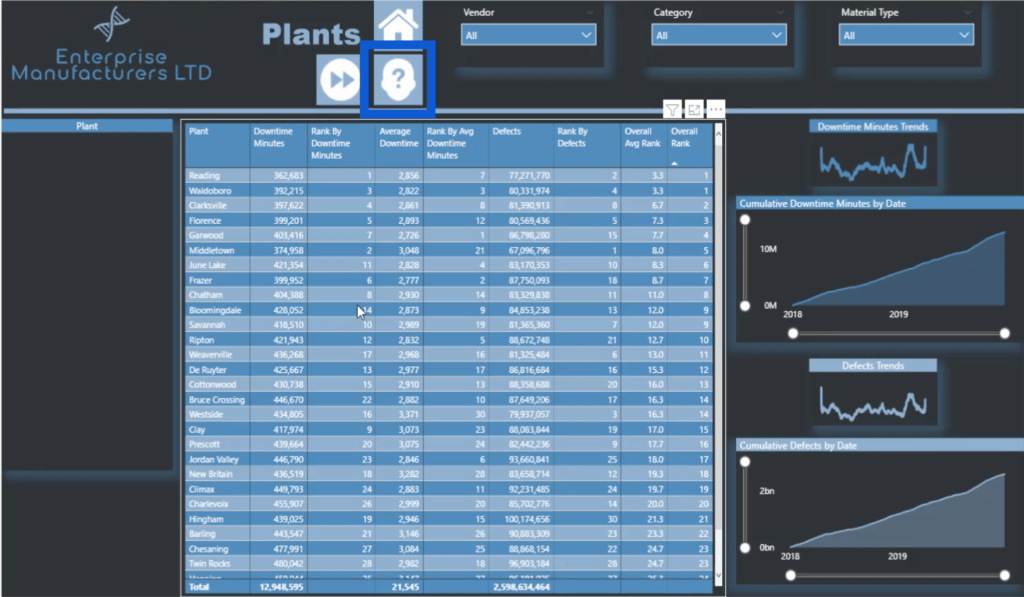
This means that this is not a slide that you can get to directly from the homepage. In fact, the only way to see this slide is by going to the Plants page and clicking on the icon of a face with a question mark.

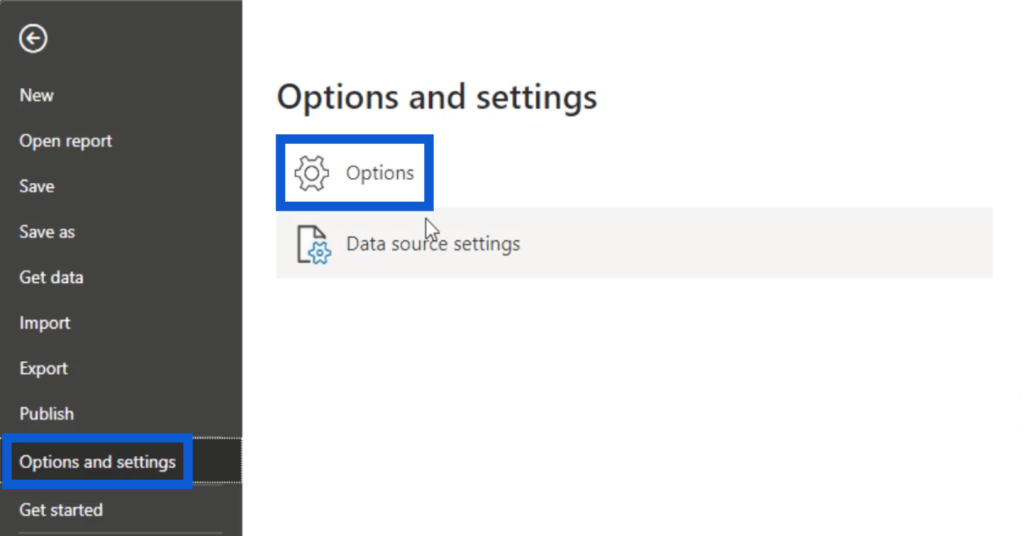
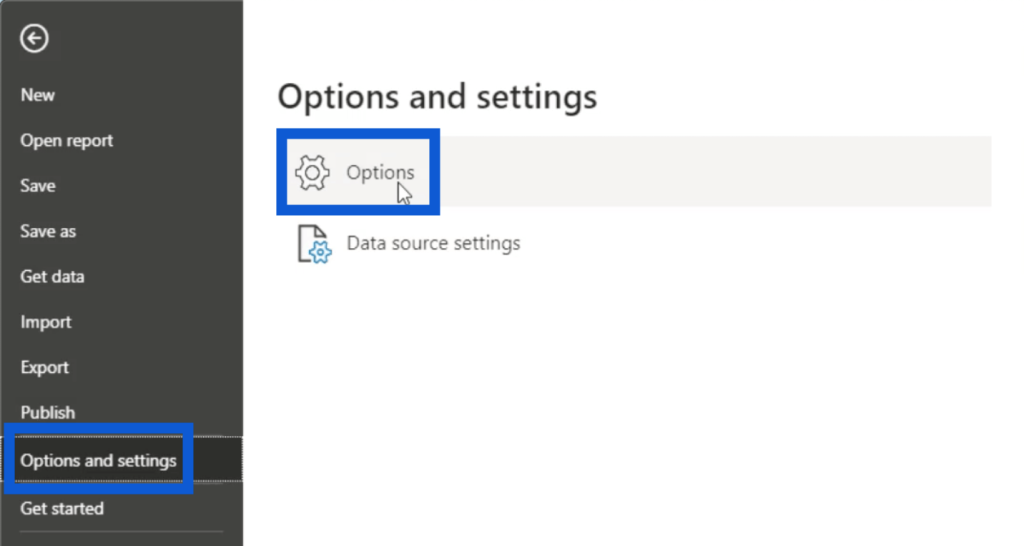
If it’s your first time to deal with anomalies, you will have to activate the feature first. Under the file ribbon, go to Options and Settings, then go to Options.
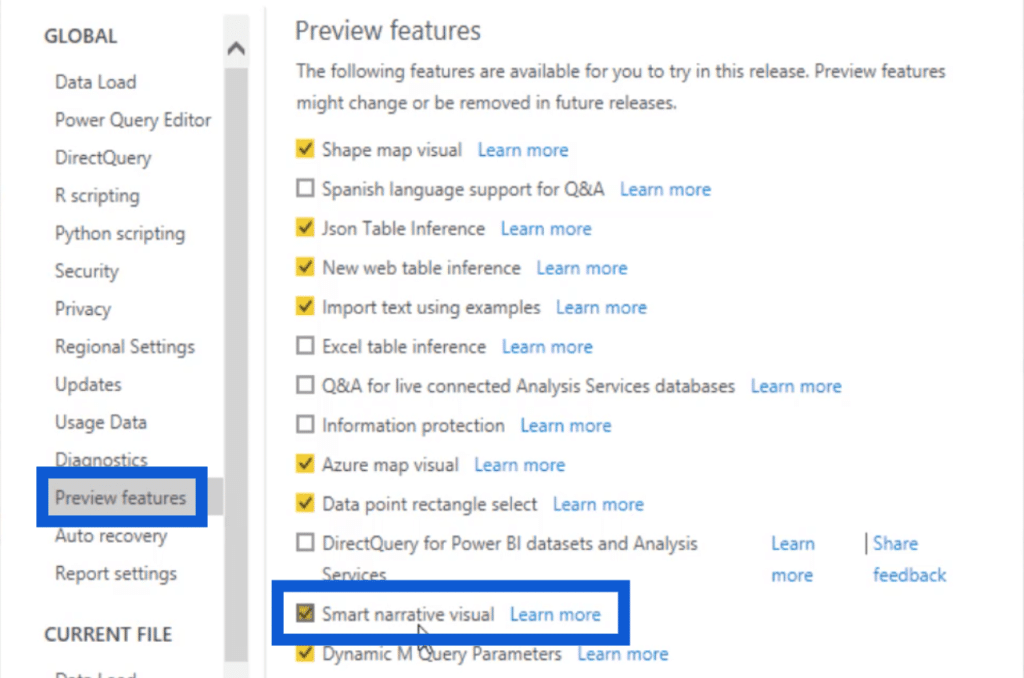
Then, click on Preview features and tick the box beside Anomaly detection.
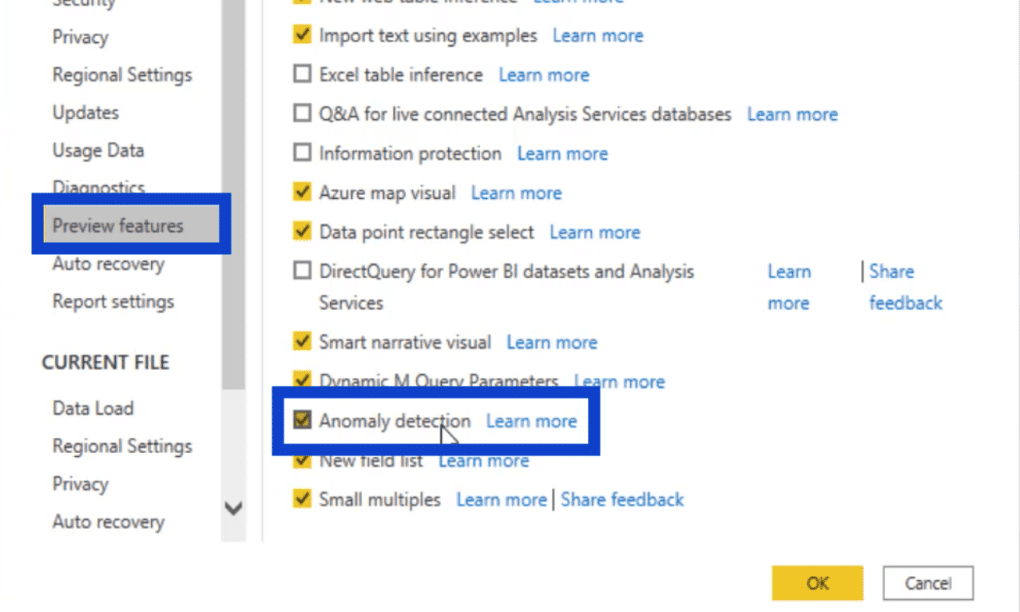
Once there’s a check mark in that box, just click on OK to apply the changes.
Customizing Anomalies
Right now, anomalies can only be shown through line charts.
Although that’s the only option for the kind of visual to use, it does offer a number of customization options.
The dilemma that I faced with this report is the fact that I have a dark background throughout my pages. This makes it pretty hard to see some of the details that I want to see. Here’s what I did to fix that.
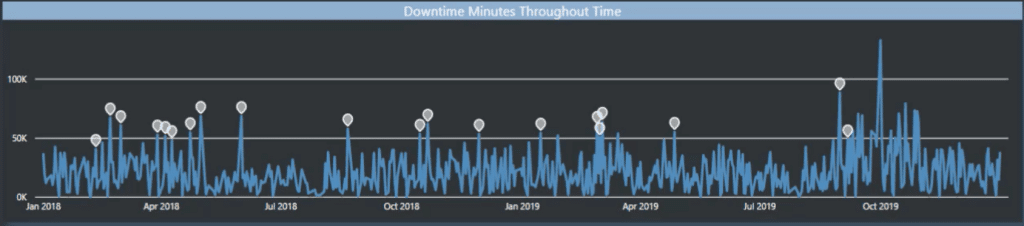
Under the analytics pane, there’s a section for Find anomalies. By default, the sensitivity is set to 70%.
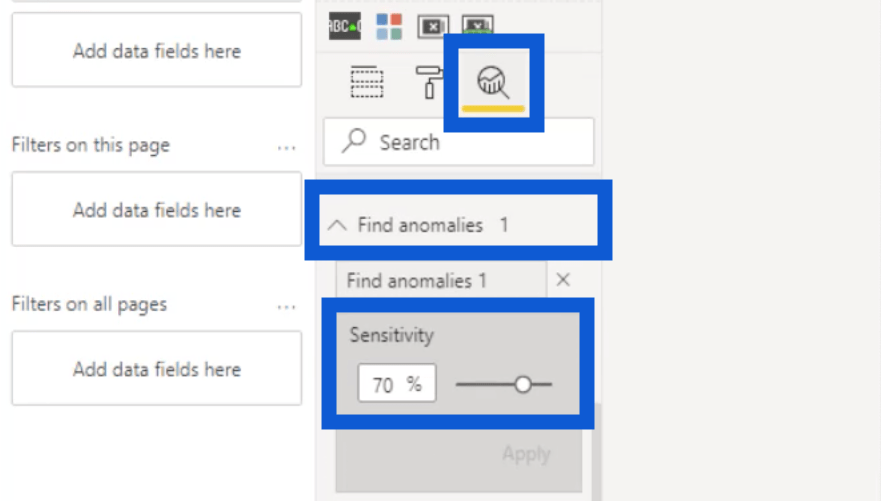
That’s the same setting that I’m using for my line charts. The anomalies can be seen through the white markers throughout the chart.
Most people increase the sensitivity to at least 80%.
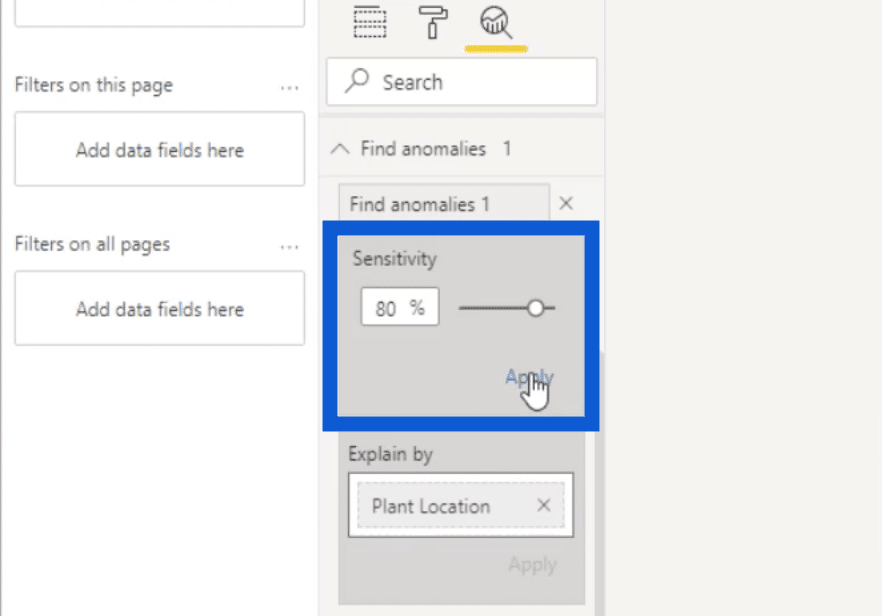
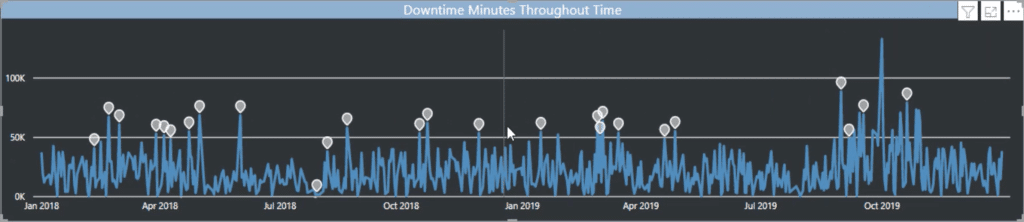
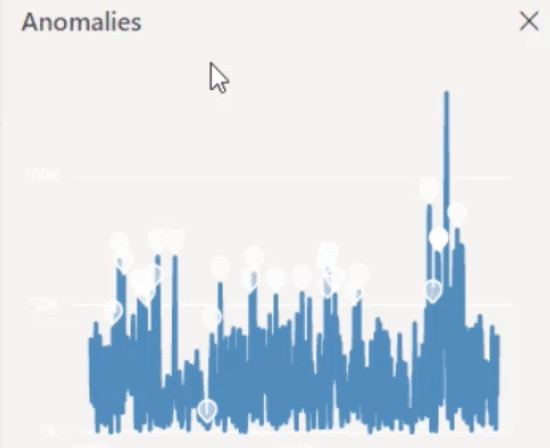
That means more anomalies will show up. If I was to apply that to my line chart, it will look like this. Notice that there are more white markers now compared to earlier.
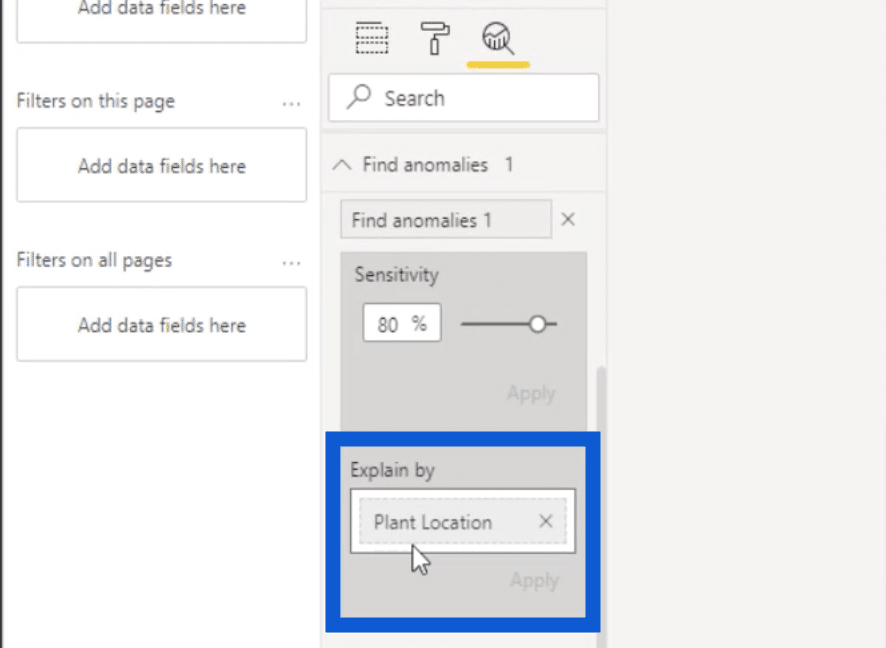
Also under the same pane is the Explain by option. Since the anomaly I’m working on is about plants, I chose to reference the Plant Location.
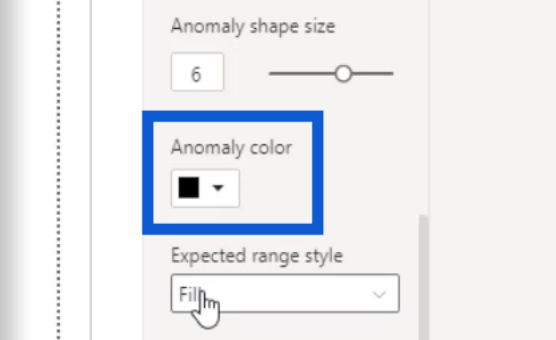
The next thing I customized was the Anomaly shape. I always use this roundish, teardrop shape but you can also choose other markers, like a square or a triangle.
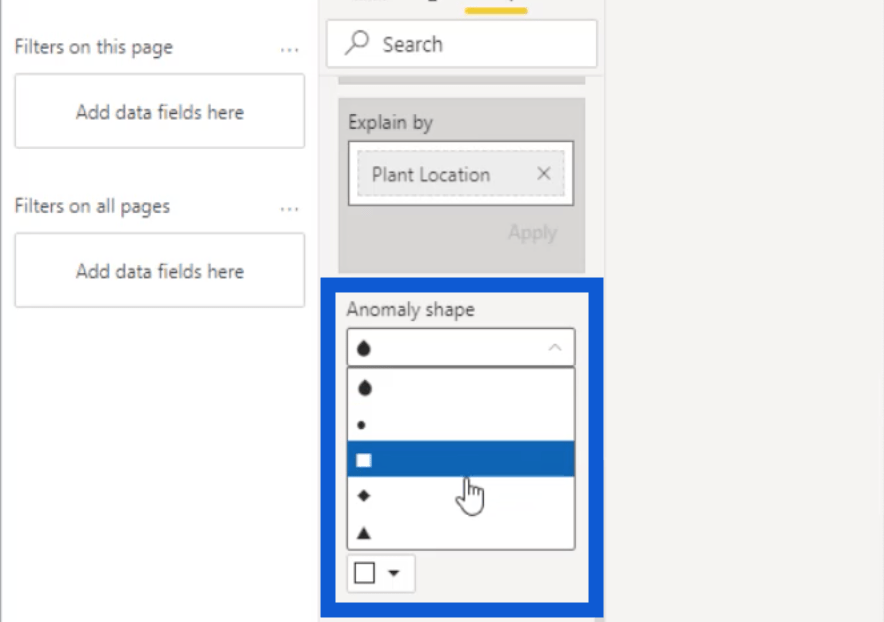
Next is the Anomaly color. I chose white because this shows the most contrast against the dark background used in my report.
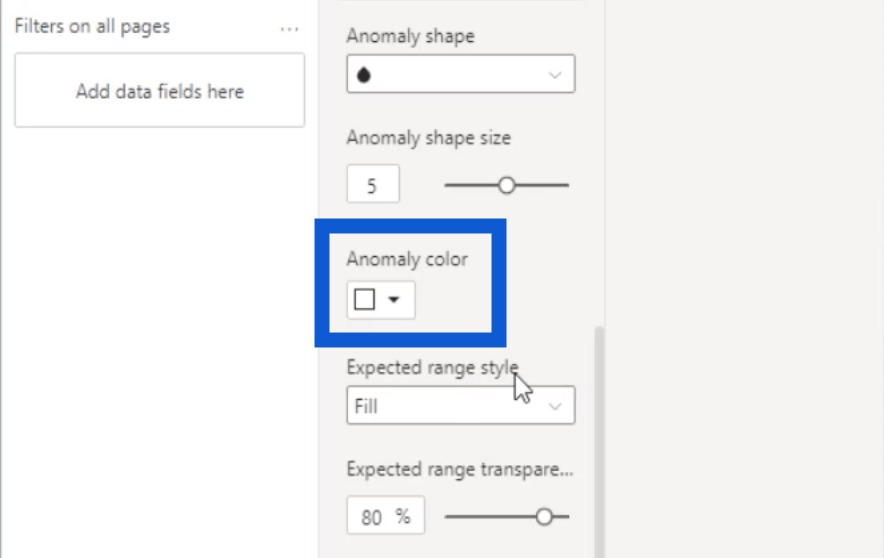
Another customization option is the Expected range style. You can choose among Fill, Line, or None.
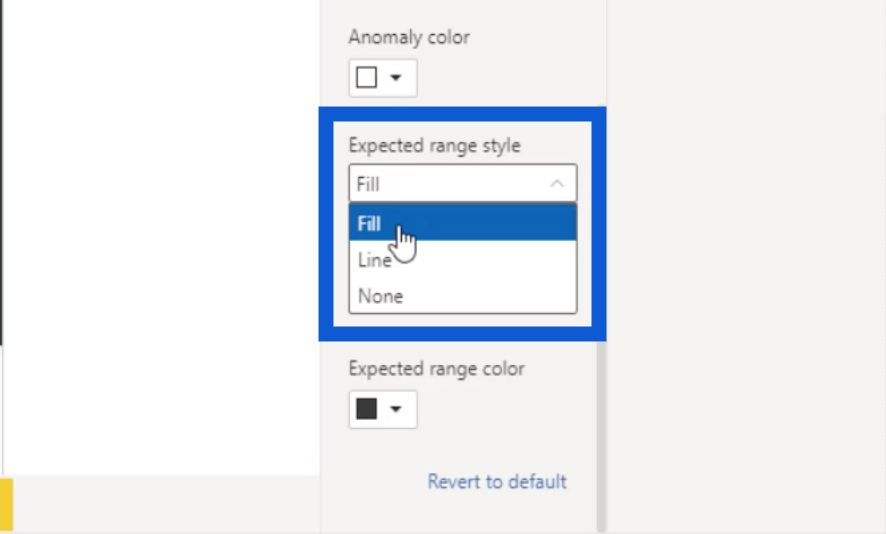
This is where my problem started. If I choose Fill, set the range transparency to 0%, and choose white for the range color, this shows up on the report a bit more.

If I click on one of the anomalies to see the details, the details will show up on the right. The problem is, the details on the right don’t follow the same dark background I used on the report but will follow the same settings I set before.
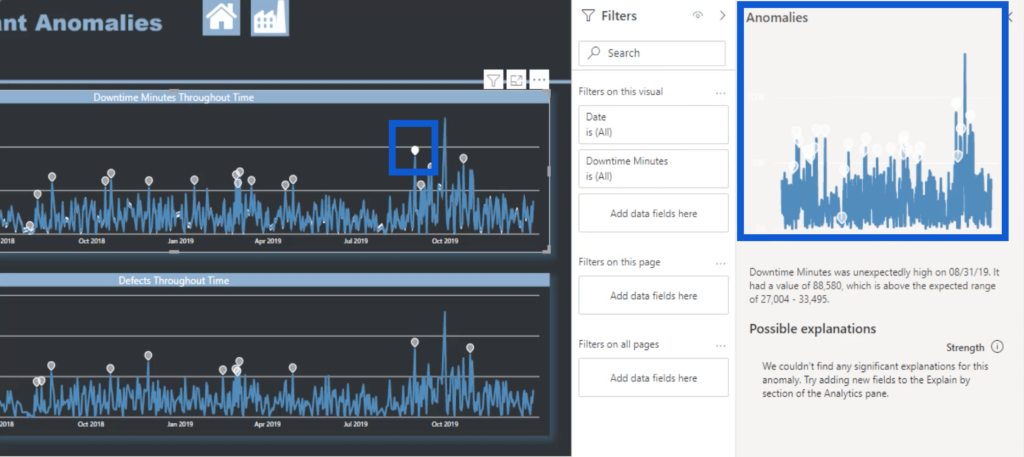
As you can see, the markers for the anomalies are barely seen.
If I click on another point, it will show up at the bottom. Again, the details can barely be seen.
This is the reason why I had to create a separate file just for anomalies. Here, I applied one of the default themes from Microsoft instead of applying the same theme I used for the rest of my report. Since this is meant to show against a light background, it’s also easier to see the details.
I’ve sent feedback to Microsoft about this so that I can hopefully customize every detail when working on anomaly detection. But for now, having a separate file was the best workaround that I can think of especially if I want to stick to my theme.
Using Zoom Filters
Another feature that Power BI released at around the same time they introduced anomaly detection is the option to add zoom filters. That’s something that I also applied to my anomalies in this report.
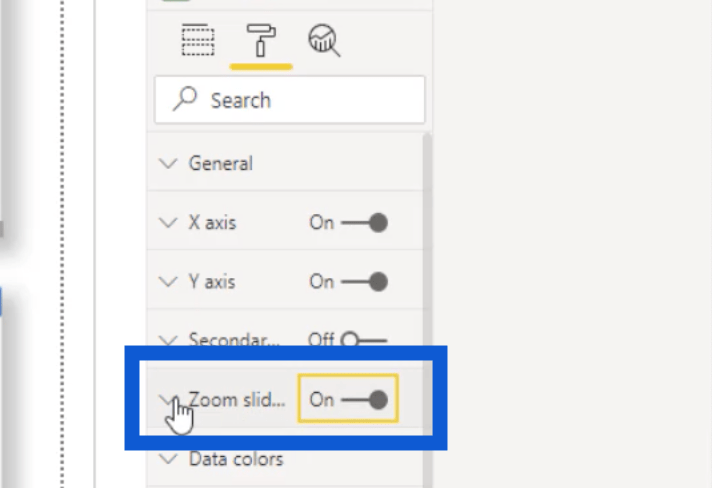
To turn on your zoom sliders, just go to the formatting pane and toggle on the switch for the feature.
Depending on the data you have and what you want to show on your report, you can add zoom sliders for both your X and Y axis. But in the report I’m using right now, I opted to stick to my X axis.
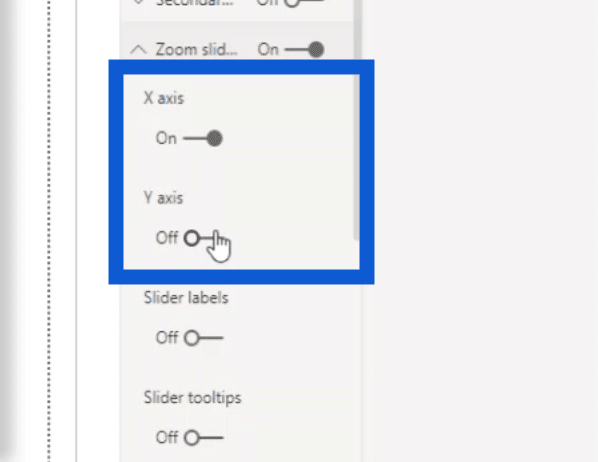
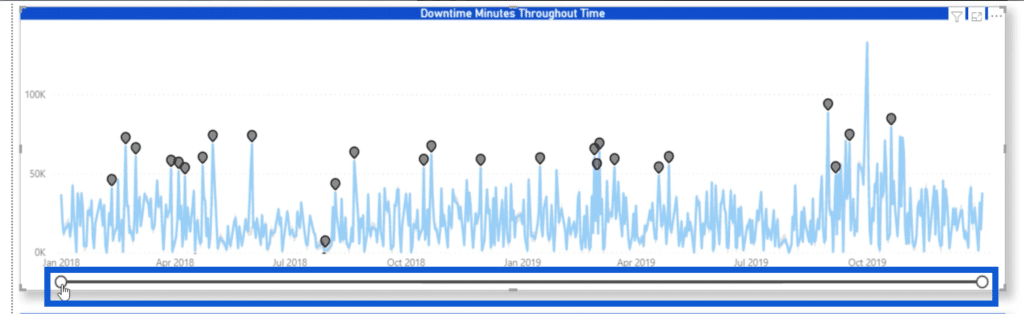
If I switch back to the visual here, you’ll see that I only have a slider at the bottom. That’s because I want viewers to be able to zoom in on the data from more specific dates.
This is why I referenced my Date column under the X axis.
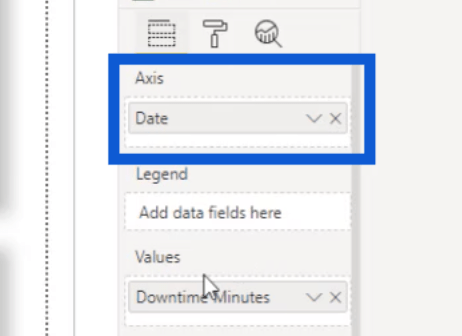
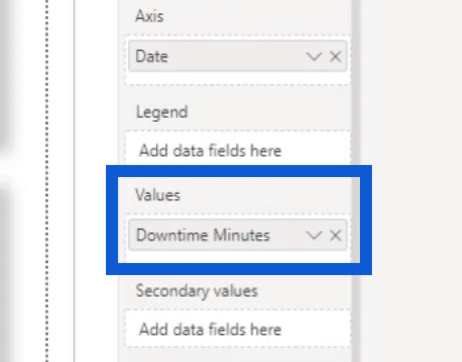
I have these settings for my visual that uses the Downtime Minutes measure, so I referenced that under Values.
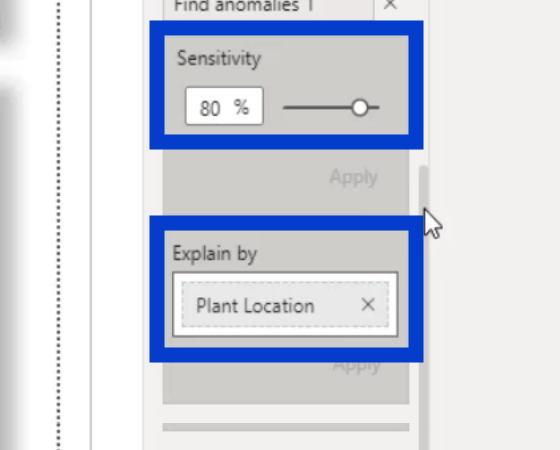
Since I’m on the Plant Anomalies page, I used Plant Location under Explain By. I also adjusted the sensitivity to 80% to show a bit more anomalies than the default.
I also kept the same shape I used in the previous anomalies I showed you. You can increase or decrease the size of the shape depending on your data.
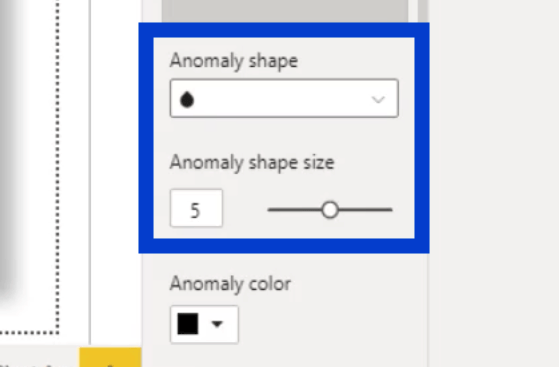
It might make more sense to make these points larger. So I’ll leave that up to you when you’re doing your own analysis. Just to show you the difference, you can look at the image below. The visual on top has a size 6 while the one at the bottom is a size 5.
Since I already have a white background, I used a darker anomaly color.
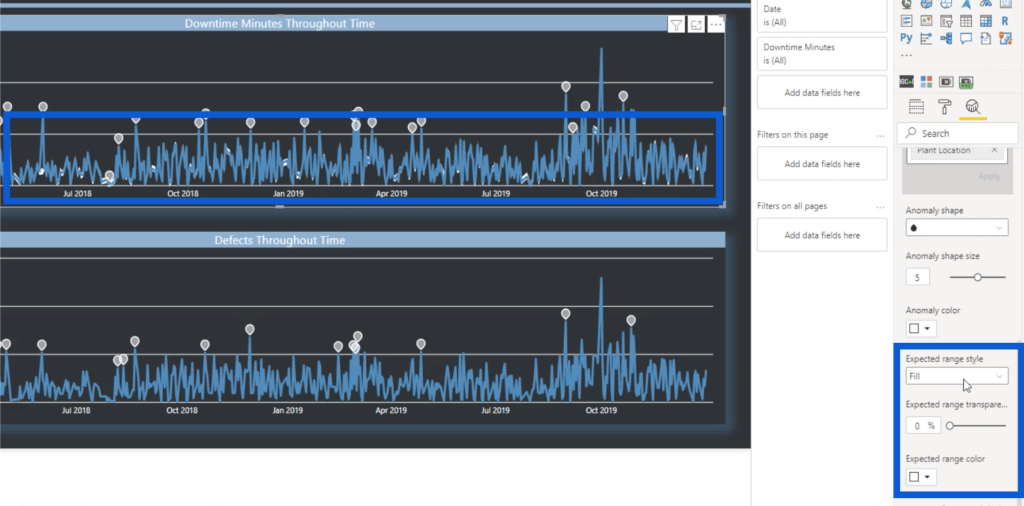
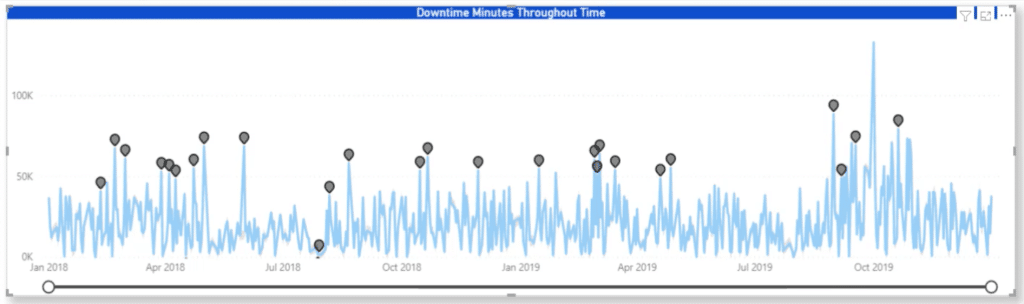
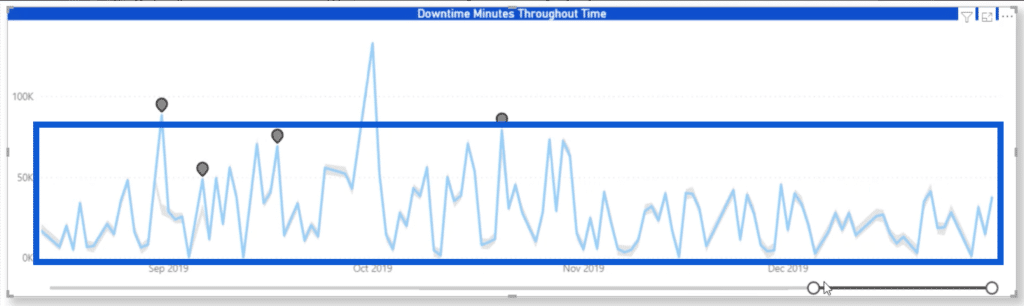
One good reason why I placed these zoom sliders is to show more detail in my visual. I actually have the expected range in gray underneath the blue lines. But if I leave it at its original state, those gray ranges can barely be seen. So I went to the zoom slider and dragged it to shrink the data into a smaller time period.
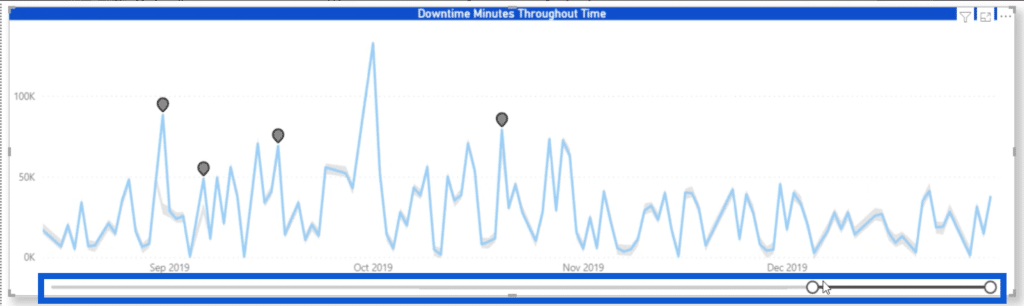
That allowed me to show the expected range better.
Gaining More Insights From Anomaly Detection In Power BI
Creating a new page with a lighter background definitely helped show the data more effectively in this report. But there’s a great way to get even more insights through anomaly detection.
For this point, if I want to show more details on that specific anomaly, I just need to look at the right-hand side here. Since the report uses a design setting meant for a white background, it’s not easier to see the specifics.
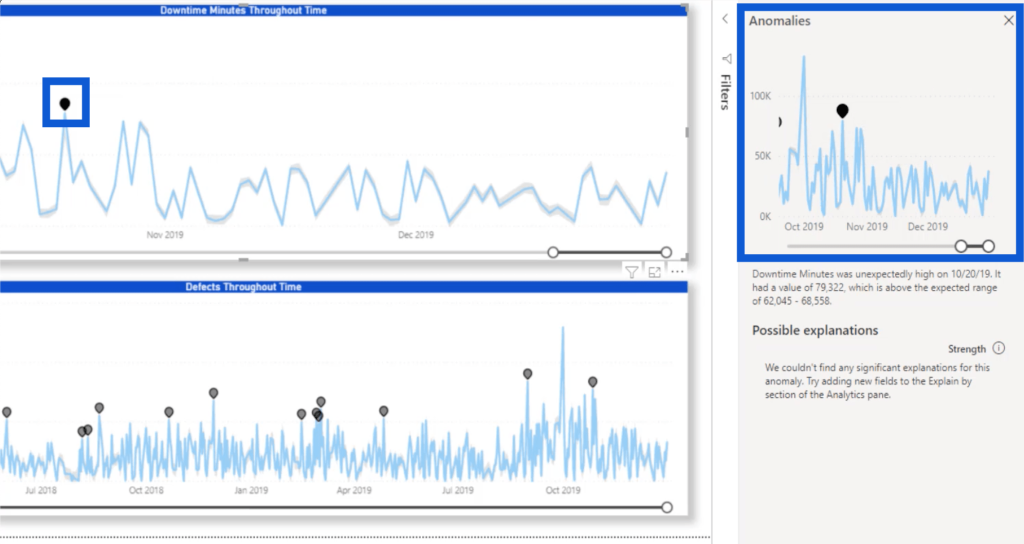
It also has details written under it, telling us that the downtime minutes were unexpectedly high on the 20th of October in 2019.

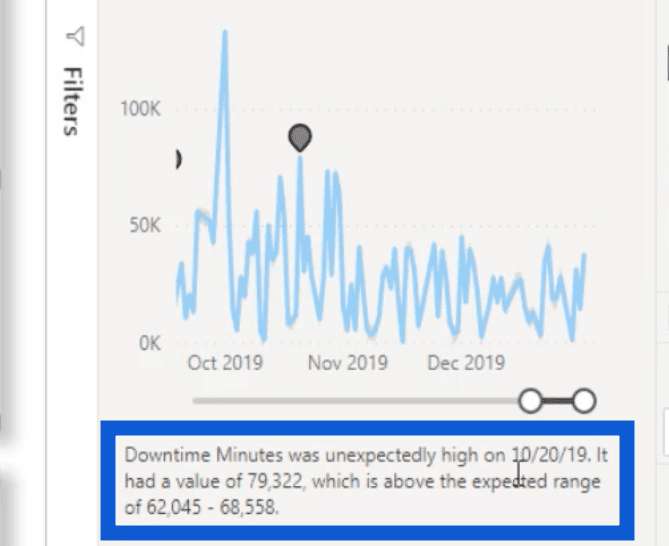
It also tells us that it reached 79,332 when the expected range was only at 62,045 to 68,558.
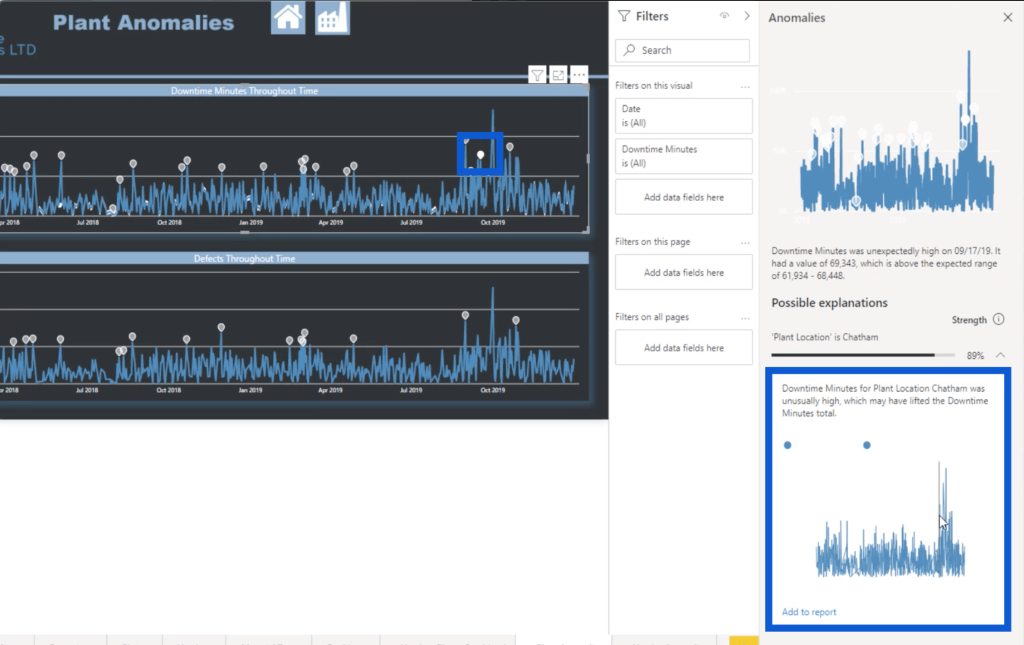
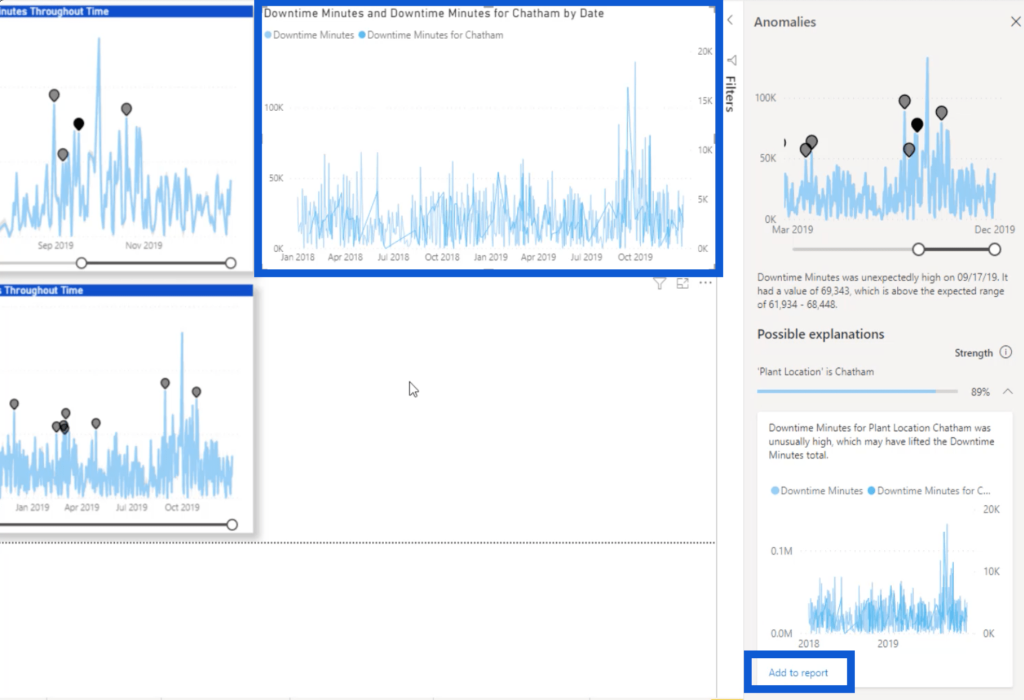
Let me click on another point that will show me more details. This point here, for example, says that its Plant Location is in Chatham.
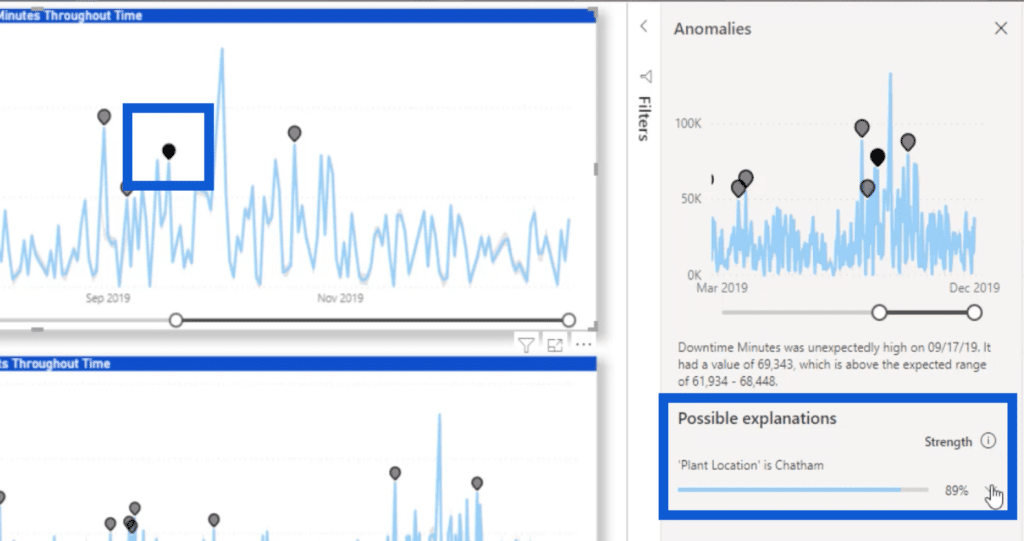
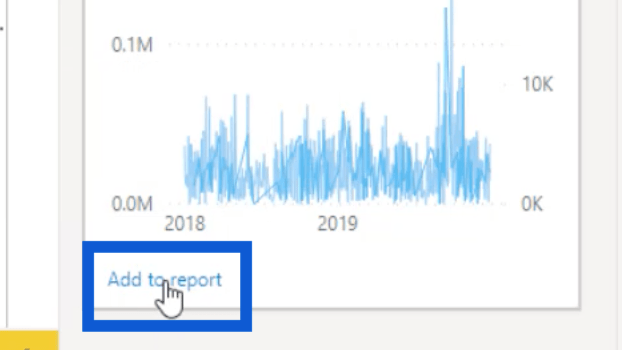
So if I click on the dropdown to see more information, it shows me another visual that tells me how the location affected the total Downtime Minutes.
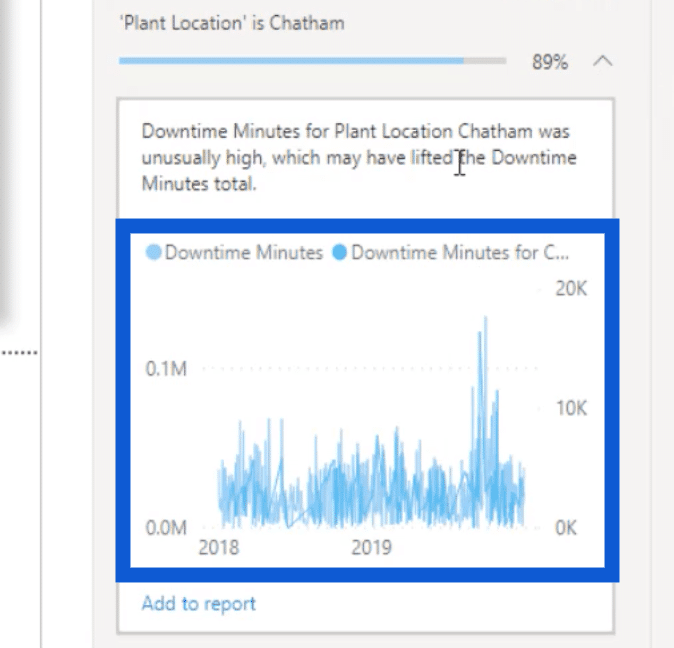
Despite the narrative explaining what happened, it’s still tough to see the details on the visual because there’s just too much data. Plus, there are two different lines running through it — a light blue one and a darker blue one.
In this case, the best way to see the details better would be to click this button that says “Add to report”, which will add this chart to my slide.
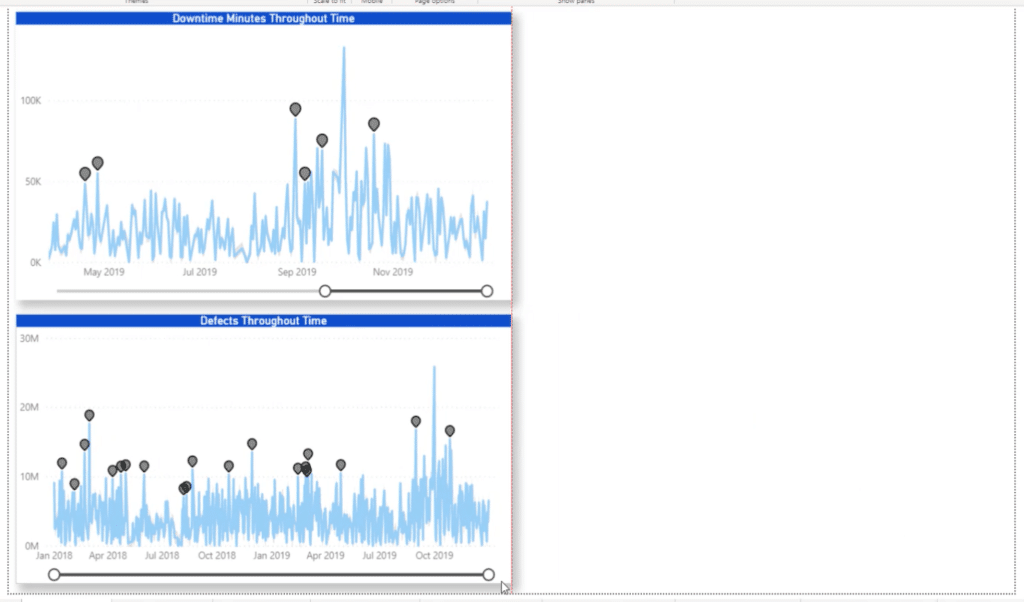
Before I add that to my report, let me prepare the space where it’s going to go. I’ll make these two existing charts on the page smaller.
Once I click on Add to report, it pops up in the empty space here in my report.
To make it easier to see everything, I’m going to move things around and stretch that chart on top so that we can see those lines better.
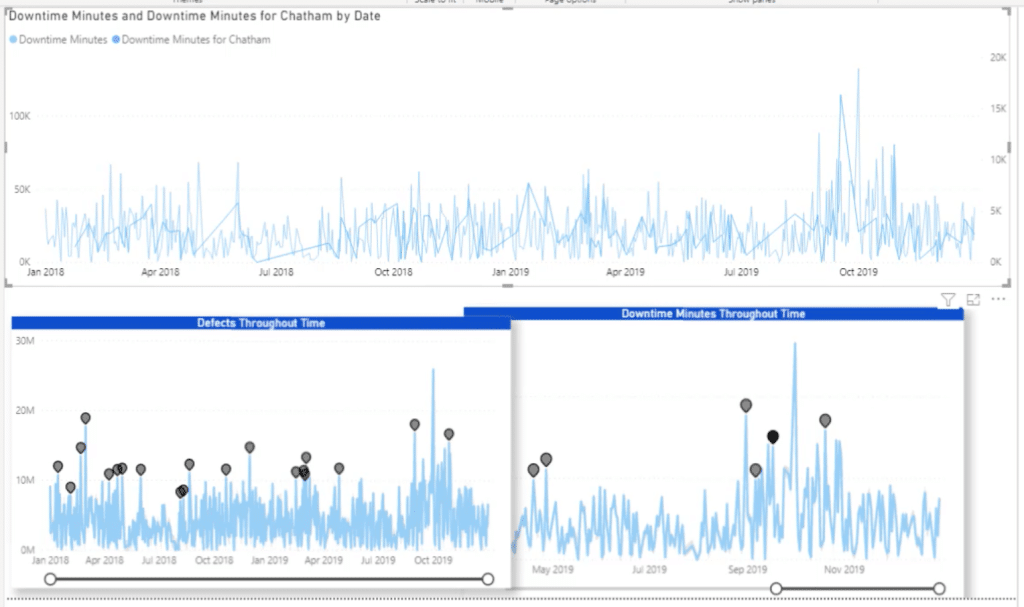
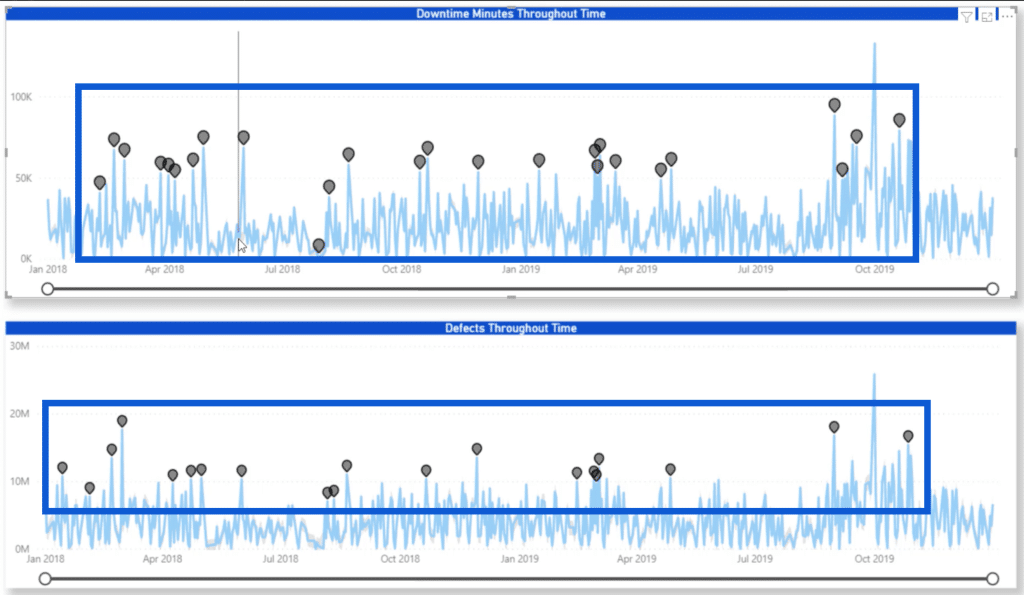
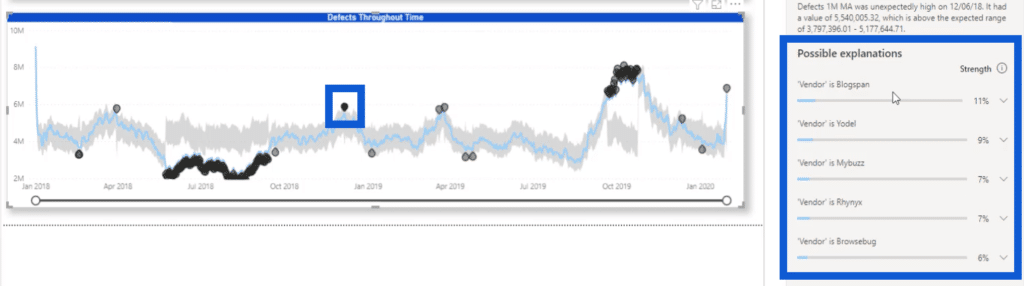
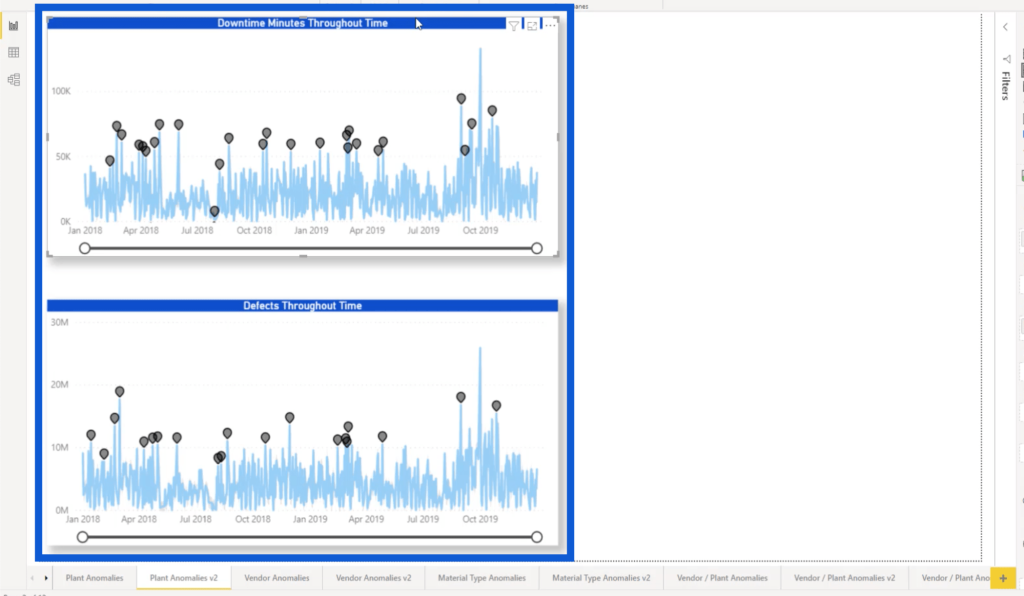
You’ve seen what I did with the anomalies for the Downtime Minutes Throughout Time. I basically did the same process for the visual showing Defects Throughout Time.
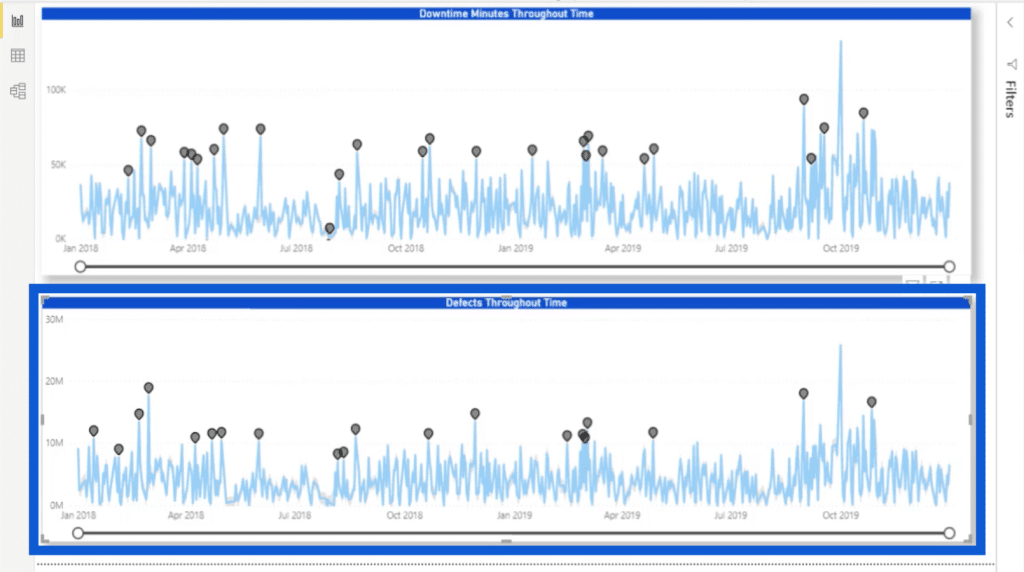
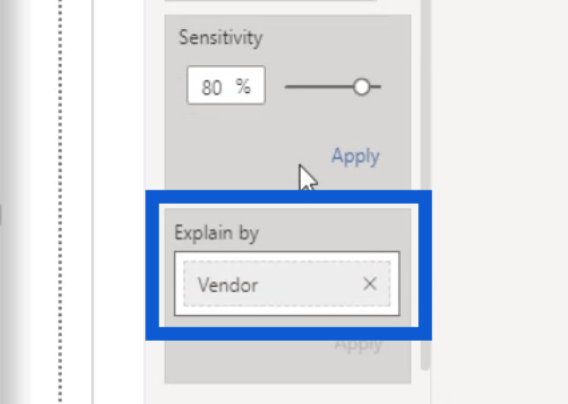
When I open the analytics pane for Defects Throughout Time, you’ll see that I increased sensitivity to 80% just like I did with the previous visual. But under Explain by, I’m referencing the Vendor this time.
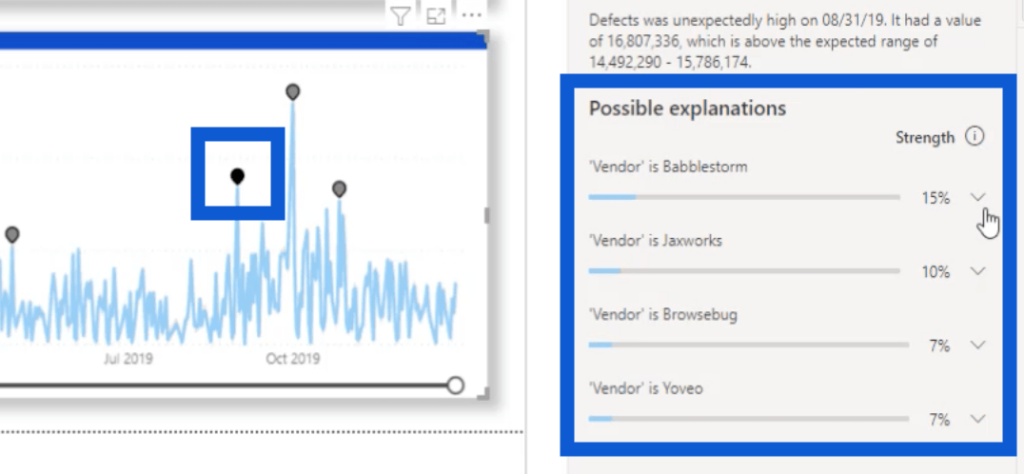
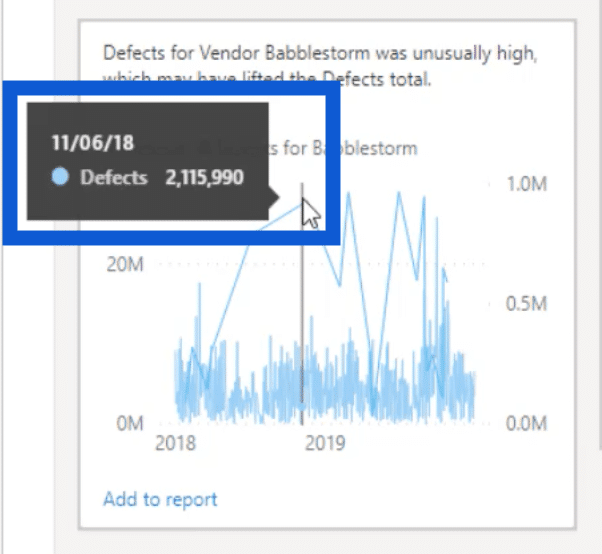
If I click on a specific point, it will show more data on that specific vendor. In this case, it shows that the vendor Babblestorm has the biggest anomaly.
If I click the dropdown for Babblestorm, it’s going to show the visual detailing that anomaly.
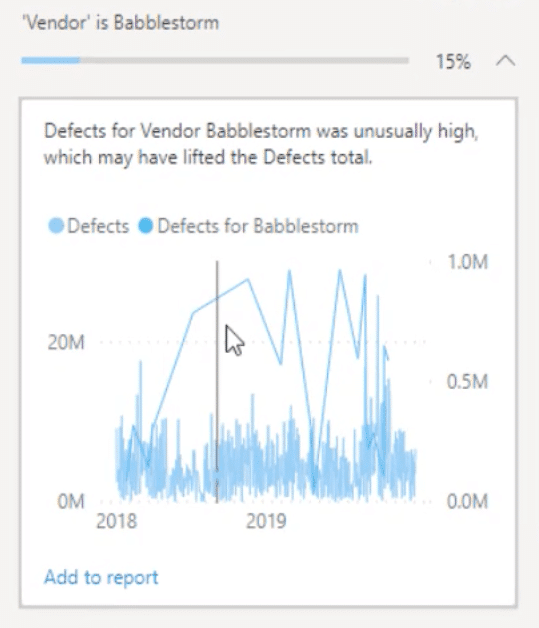
Hovering over any point on the visual shows the specific numbers on the specific date.
Anomaly detection is already useful enough as it is, but we’ll see deeper insights if it is developed further. Again, Microsoft is usually receptive to feedback so I’m hoping to see more improvements to this functionality.
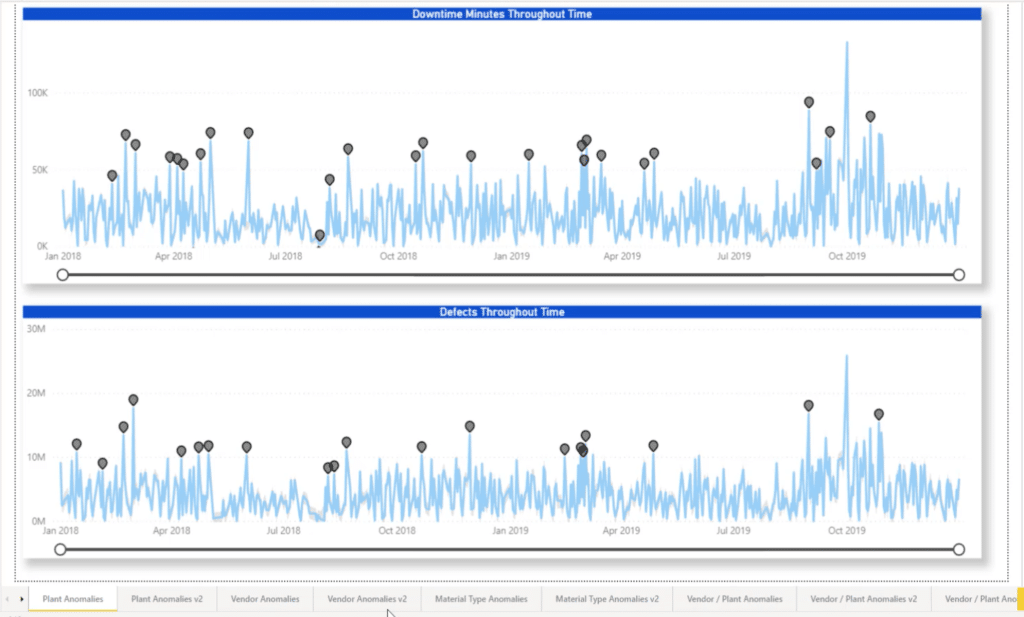
Just to show you what it looks like when the range of anomalies looks clearer, let’s go to the slide I created for the one-month moving average for Vendor and Plant Anomalies.
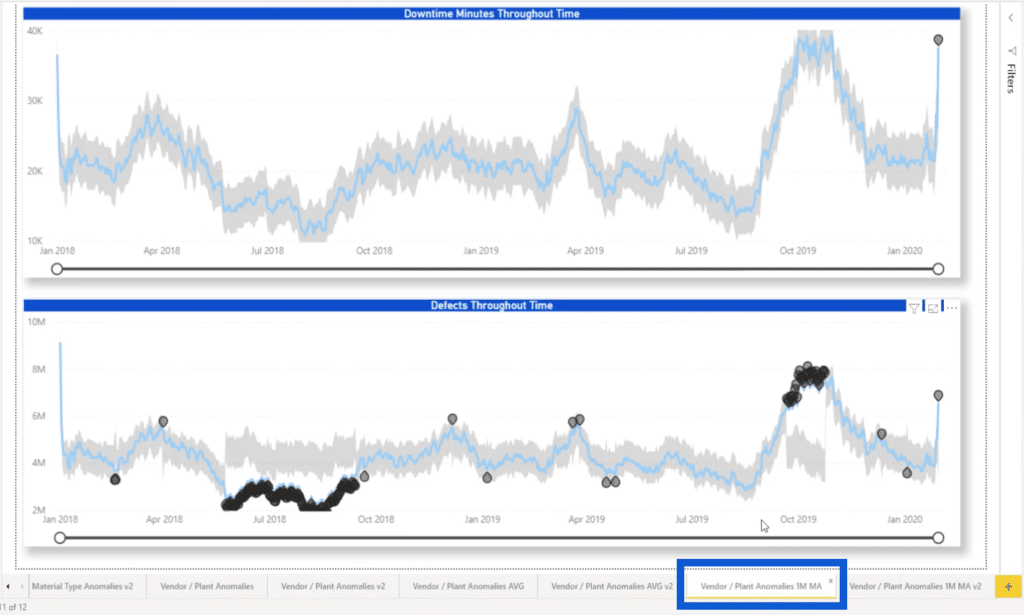
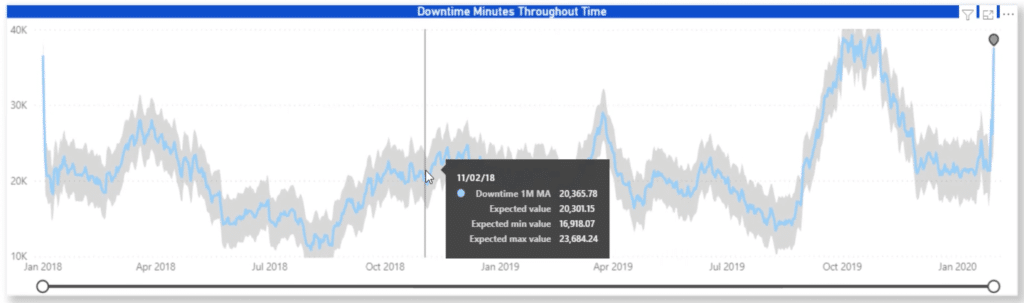
As you can see, the anomalies can be clearly seen. In the Downtime Minutes Throughout Time, you can see the expected range in gray with the actual results represented by the blue lines in the middle.
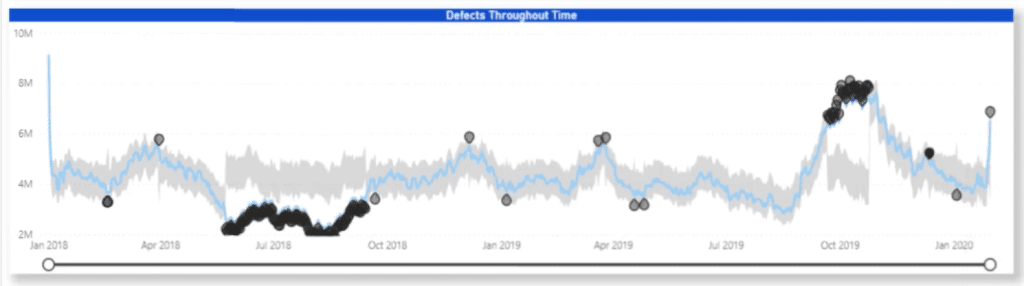
This goes to show that you can really maximize the full benefits of anomaly detection when it comes to moving averages. The same can be observed if you look at the visual for the Defects Throughout Time.
If I click on any of the anomalies, it still shows possible explanations on the right side.
Smart Narrative
Another functionality that was introduced to Power BI is the smart narrative function. Smart narratives give you an overview of what your visuals and reports are showing using artificial intelligence.
To activate that feature, go to Options and settings under the File ribbon, then click on Options.
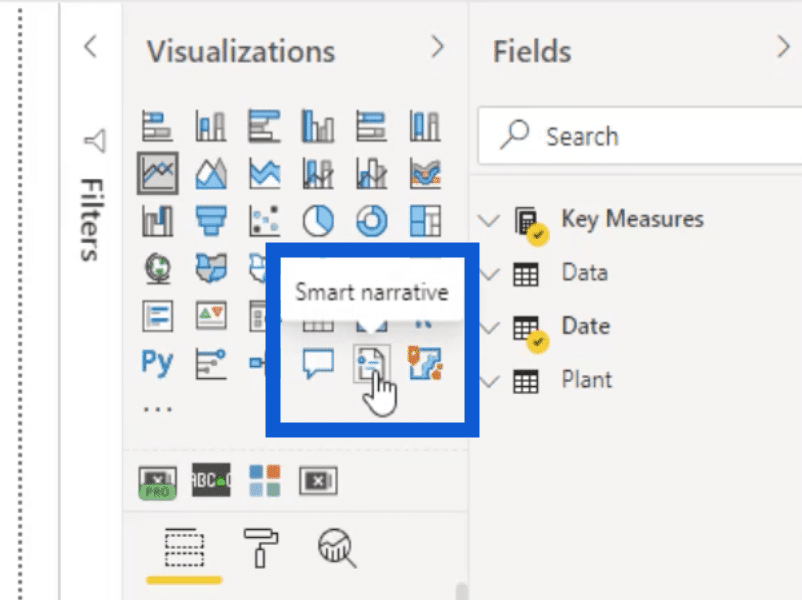
Click on Preview features, then look for the Smart narrative visual. Just tick the box before it to turn it on.
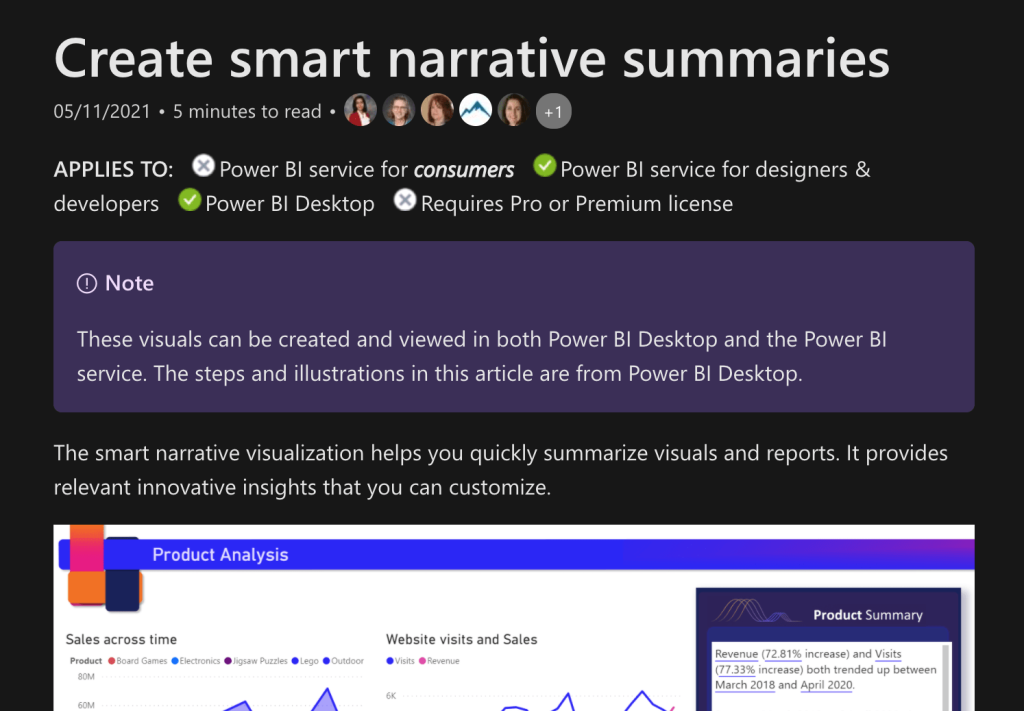
If you want to learn more details about what the feature does, you can click on the “Learn more” link. This will lead you to the Microsoft document that discusses the specifics.
You can also watch a video tutorial done by Greg Phillips, one of our Enterprise DNA experts. In the video, he shows how he uses smart narratives in his own reports.
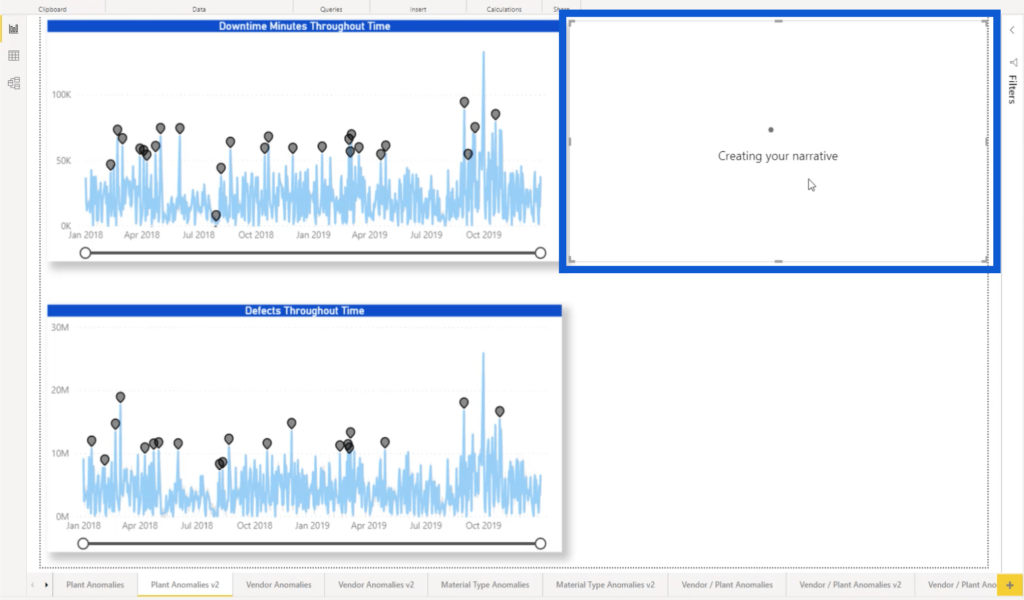
To show you what smart narratives do, I’ve created a second version of my Plant Anomalies slide. As you can see, I’ve made the existing two visuals smaller, leaving some space on the right side.
On the right pane under Visualizations, you’ll see an icon that looks like a piece of paper with a blue dot. This is the icon for smart narratives.
I’ll click on that icon so that it can start creating a narrative based on my report. Note that sometimes, it takes a few seconds for the narrative to load depending on how much data it has to go through.
Once it shows up, you can drag the text box to make it fit your report better, especially if it’s showing quite a lot of information.
You can also format the text if you want to make it easier to read. In this case, I changed the font to Arial size 16.
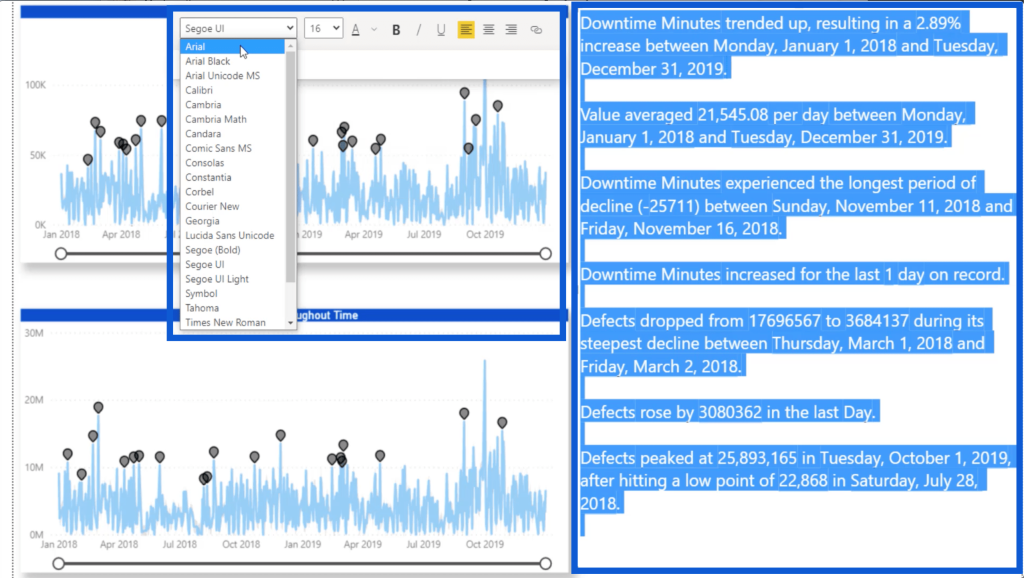
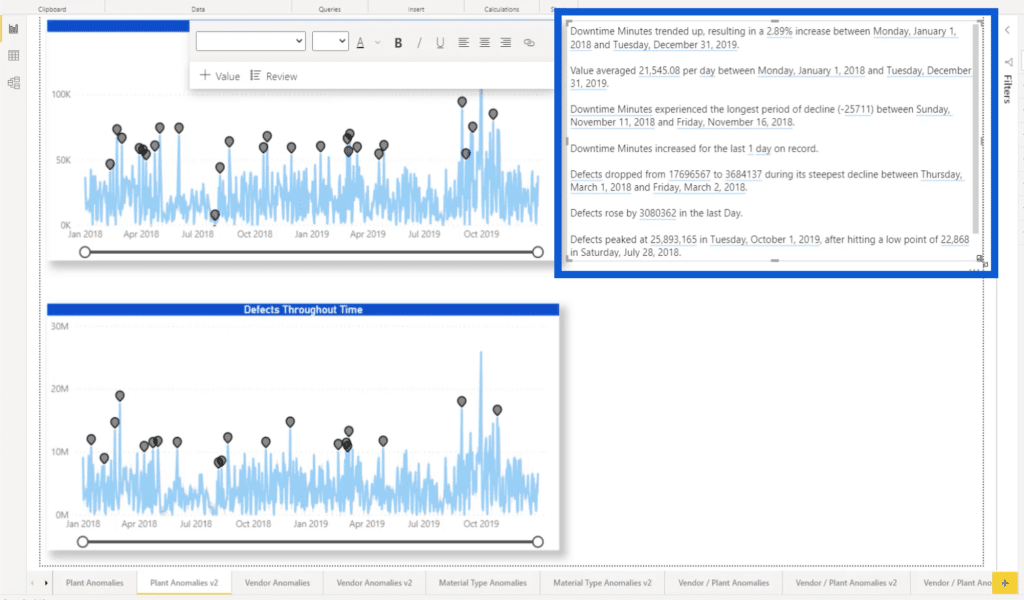
Now, let’s take a look at each of the points delivered by the smart narrative.
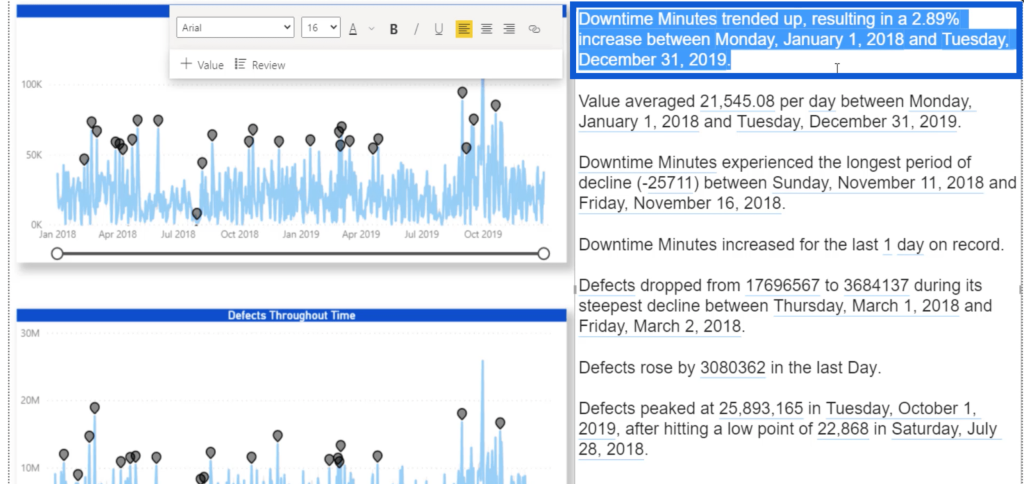
The first one tells us that there was an upward trend, with a 2.89% increase throughout the full date range of the downtime minutes.
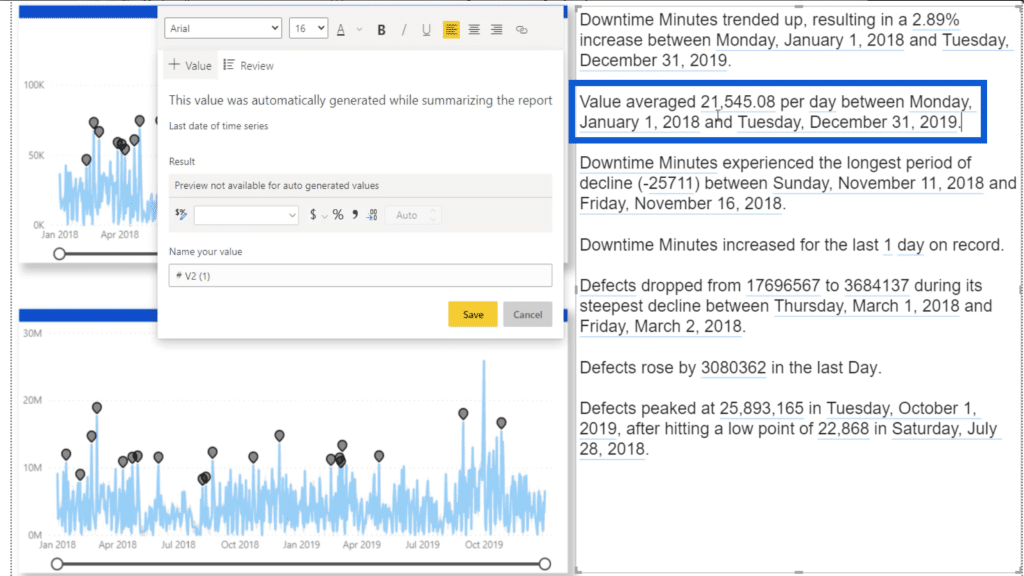
The second entry says that the values averaged at 21,545 within the same date range.
This third point goes into the longest period of decline in downtime minutes between the 11th and 16th of November in 2018.
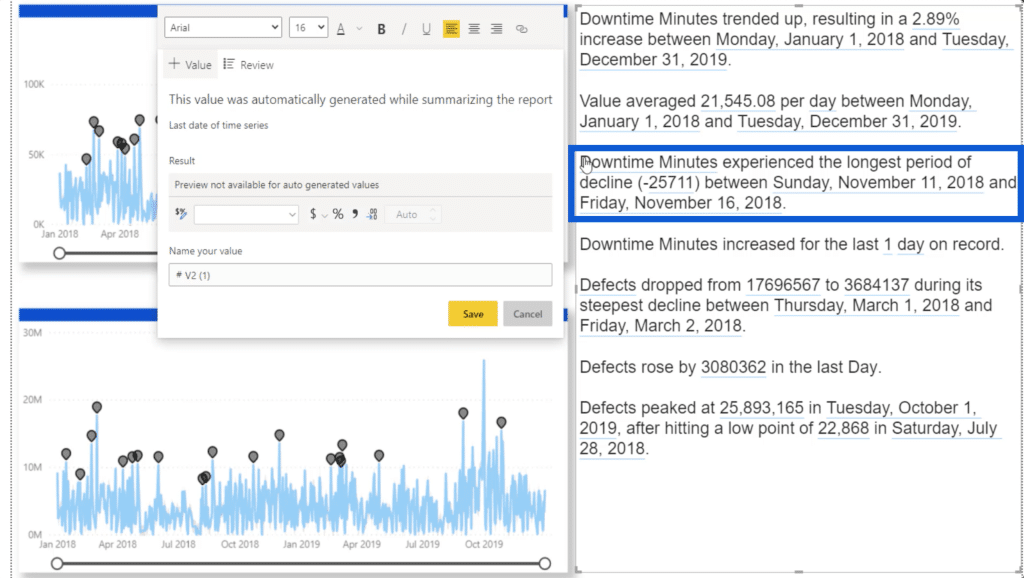
It continues to give other insights on the data given in the report. As you can see, it has underlined these pieces of data in light blue.
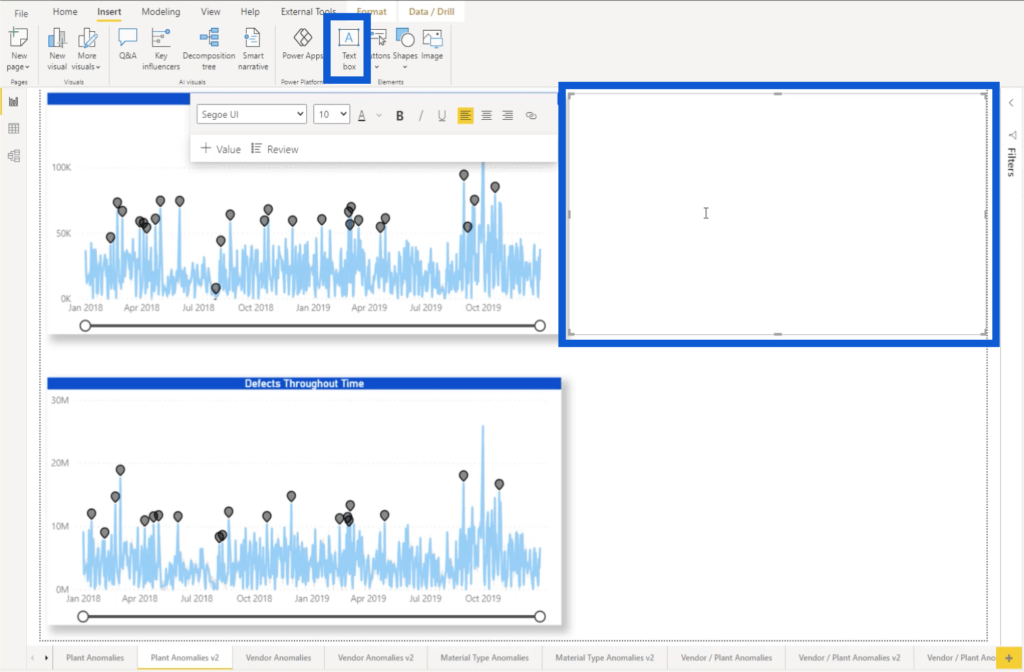
If you’d rather create your own narrative, you can click on Text Box under the Insert ribbon. Once the text box appears, you can type in your own analysis into the space provided.
I won’t be going into the full details of the smart narrative function in this tutorial, but feel free to check out Greg’s YouTube tutorial on the Enterprise DNA channel.
***** Related Links *****
Power BI Anomaly Detection Feature: How It Works
Showcasing And Understanding Anomalies In Power BI
Detecting & Showcasing Outlier Results In Power BI
Conclusion
Microsoft’s Power BI team have really outdone themselves with this batch of new features. Anomaly detection gives us a deeper look at the variance between our expected results and the actual results. The zoom sliders help us zero in on specific points in our data sets. Smart narratives help us verbalize the insights our reports deliver.
Knowing how Microsoft works, I’m sure we’ll be seeing even more enhancements, and possibly, more features in the near future that could enhance the Power BI experience even further.
All the best,
Jarrett


