
In this tutorial, I’ll go through a budget allocation technique in Power BI where you allocate Budgets at a monthly level versus Sales or Transaction Data at a daily level. You may watch the full video of this tutorial at the bottom of this blog.

This scenario is very common when working with any type of forecasted information.
As an example, you may have Sales that happen every day, but your budgets might be at a different granularity. They might be at a monthly, quarterly, or yearly level. You want to be able to break down these numbers so there can be a like-for-like comparison to the daily results we see via our Sales.

This can be a bit difficult at first. That’s why for this example, I’m going to show you a very detailed solution on how to do this budgeting and forecasting technique in Power BI.
Relationships Between Different Granularities
You want to know how to allocate Budgets at a month and year level granularity and compare them to every single Sales transaction. Basically, it’s iterating through each day you’re making Sales.
So, you should know how to allocate the monthly Budget which could also have been broken out by other attributes.
In this case, the Sales Budgets is broken down by City Name, Product Name, and Customer Names.
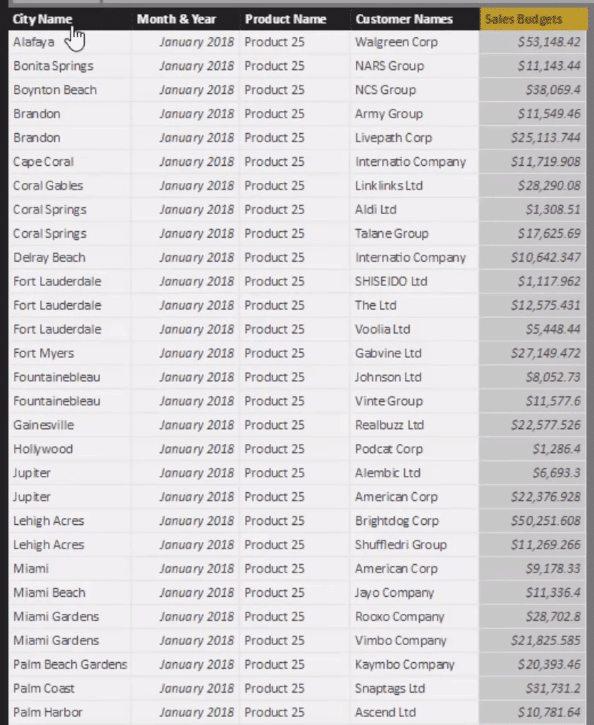
It’s a very detailed bottom-up build of the Budget. There are a lot of attributes within this table, and all of them have a certain Budget Allocation which you need to compare to Sales on a daily level.
All you need to do is to understand how everything fits together in the formulas.

The key thing to learn in this tutorial is how to allocate Monthly over Daily.
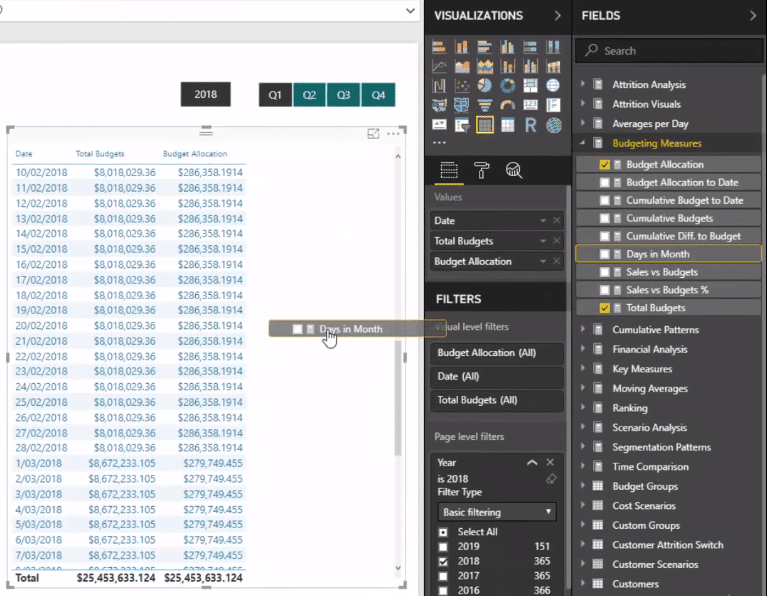
Now, looking at this example, you can see that there’s a table containing Date, Total Budgets, and Budget Allocation.
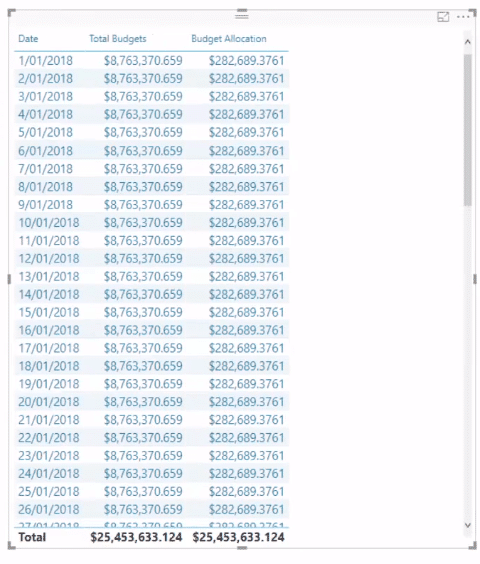
You need to create a calculation that sums up the Budget in a particular month and then allocate it for every single day.
The difficult part of this is that the Month & Year doesn’t match up to the Dates table. Looking at the relationships, you’ll see that the Dates table has a daily granularity while the Sales Budgets are at a monthly and yearly granularities.

So, there’s no direct relationship between them.
Even if you click the Dates table and drag it across to the Sales Budgets table to create a relationship, it would be impossible. Also, you don’t want to do that in the first place since it’s not a true relationship.
The Dates table does not match up to the monthly and yearly granularities of the Sales Budgets table. Thus, you need to create this relationship virtually.
Creating Virtual Relationships Using TREATAS
The interesting part about the TREATAS formula is that it can create virtual relationships in the calculations that don’t have a true relationship in the model.
There are true relationships in this model though. There is the Regions table, the Products table, and the Customers table. All three of them are attributes in the Budgets.

Thus, you need to keep them and utilize the power of filters applied in the model.
But again, there’s a need to virtually allocate by month and year. So, let’s jump to the measure.
There’s Total Budgets.

This measure sums up the Sales Budgets which is the numeric column in the Budgets. But you also need to make sure that you’re creating a filter inside CALCULATE, which is what the TREATAS function does.
TREATAS creates a filter based on the Month & Year column inside of the Dates table, and the Month & Year column inside the Sales table.
Again, it’s not possible to create their relationship inside the model because of the numerous relationships within them. There are also repeated values. So, if you try to grab Month & Year from the Dates table and drag it across to the Month & Year of the Sales table,…


…you’ll get a message error saying:
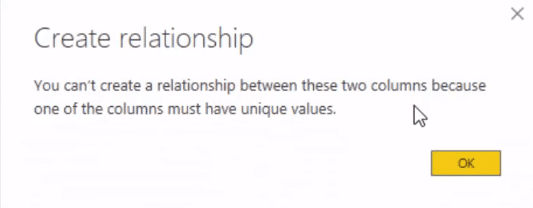
And that’s why the virtual relationship is created using TREATAS – you’re able to virtually create the connection between the two tables using this function.
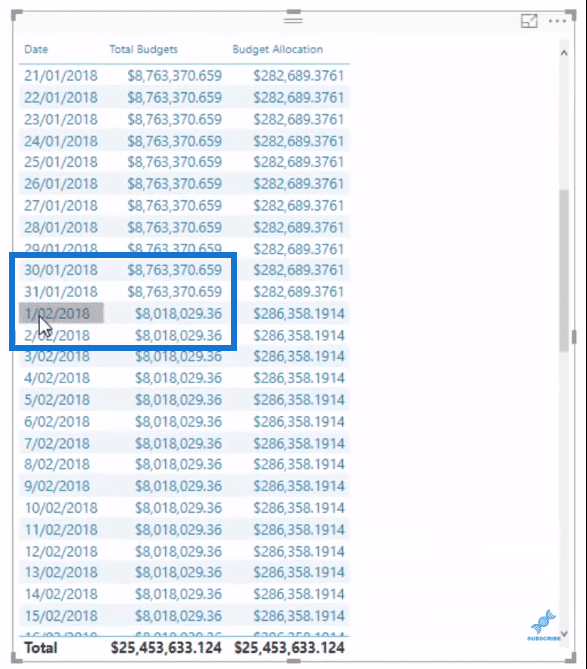
You’ll see that as you jump into a new month, it’s able to recognize and then calculate the Budgets based on that month.
Finding The Allocation Algorithm
You need to calculate the Total Budgets and then create an allocation algorithm which allocates the Budget across every single day.
Logically, the allocation is basically Total Budgets divided by the number of days in a month. You could also use number of working days in a month.
But for this example, the number of days in a month is used.
In performing the calculation, you need to think about the allocation algorithm.
Look at the formula Days in Month.

It’s saying that the Total Budgets for the month need to be divided by the number of days in the month.
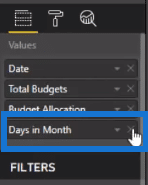
By dragging the measure Days in Month to the table, it counts and shows how many days are in a particular month.
In the formula, I’ve removed any context of days.

But then, I brought them back with the VALUES of Month & Year.

Doing this will make the Dates match up to the Sales Budgets that have monthly and yearly granularities.
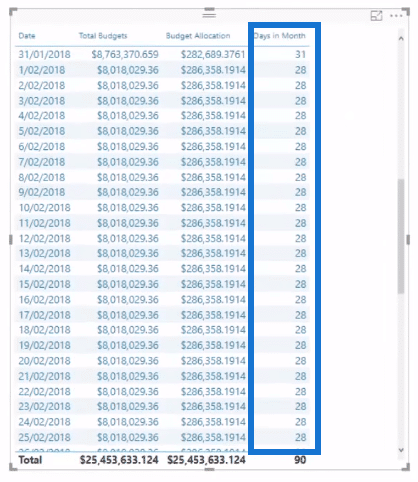
Looking at the column Days in Month in the table, you’ll see that the number of days is different for every month – it’s not just putting the generic number of 30 days per month for all the months.
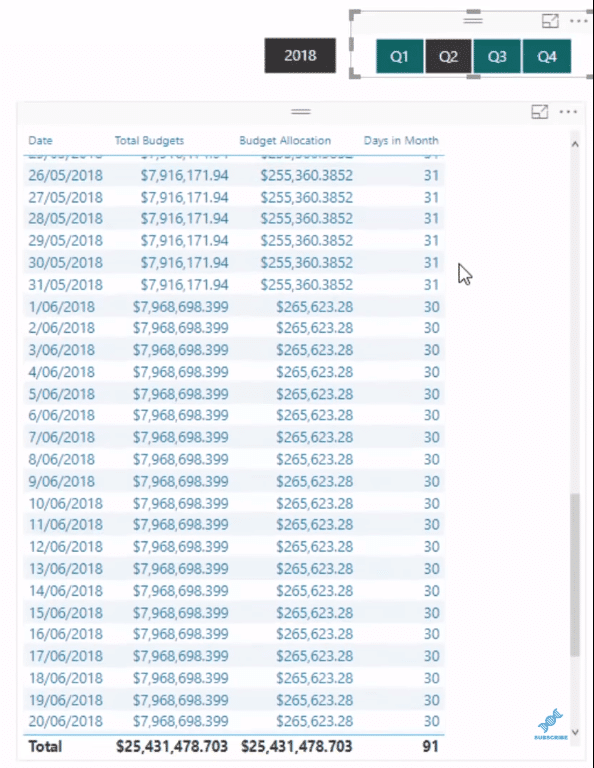
It’ll also automatically change if a different Quarter in the time frame is selected.
Calculating Budget Allocation
In the formula for Budget Allocation, this is the part that’s generating the exact numbers of Days in Month:

This can be simplified by making the formula of DailyBudget equal to the Total Budgets.

And this is the key part of the formula:

It’s dividing the Total Budgets by MonthDays. This is how you can get the Budget Allocation.
Some intermediary calculations aren’t even needed like the Days in Month. so if you want, you can opt to remove it.

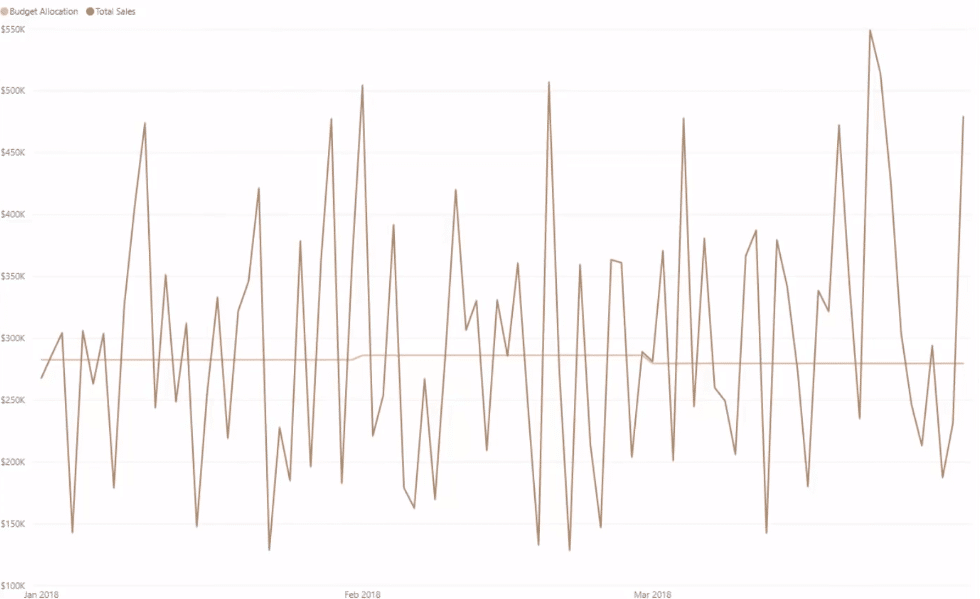
You can then show the results into a chart showing Budget Allocation versus Sales per day.
In using TREATAS, it’s just a matter of finding the allocation algorithm. You need to find the correct division number, in this case, it was Days. And then, divide that number by the correct monthly or annual allocation.
Customizing The Dashboard
Now, let’s go back to the demo model.

In customizing the dashboard, you can incorporate different patterns on top visualizations. You can show the difference between Sales Budgets and Cumulative Budgets, and their trends. You can also create segmentation patterns.
***** Related Links *****
Showing Cumulative Results Versus Targets Only To Last Sales Date In Power BI
Showing Difference Between Sales And Budgets To Date – Forecasting In Power BI
Compare Actual Results To Budgets Using Power BI Forecasting
Conclusion
Doing this inside Power BI requires a reasonable amount of knowledge around how to set up the data model well and also how to form the correct relationships between the tables. On top of this, you also need to utilize the right DAX formulas to make everything work within your visualizations.
For budgeting and forecasting reports like this in Power BI, it’s just a matter of finding the allocation algorithm together by using TREATAS.
With a bit of practice, you’ll be able to implement this very easily within your own work.
All the best,
Sam
***** Learning Power BI? *****
FREE COURSE – Ultimate Beginners Guide To Power BI
FREE COURSE – Ultimate Beginners Guide To DAX
FREE – 60 Page DAX Reference Guide Download
FREE – Power BI Resources
Enterprise DNA Membership
Enterprise DNA Online
Enterprise DNA Events
[youtube https://www.youtube.com/watch?v=7VKU-dvQv3c&w=784&h=441]


