
For this blog post, I want to dive into iterating functions within the DAX language in Power BI. The reason why I want to spend some time showing what you can do inside of iterating functions is because it’s such an important concept that you need to learn very well. You may watch the full video of this tutorial at the bottom of this blog.
You might have only just completed some simple SUMs or potentially used the AVERAGE function, but it’s also important to understand how to use iterating functions that have an X on the end, such as: SUMX, AVERAGEX or COUNTX.
The reason being is because you can get far more advanced within an iterating function than you can with an aggregating function.

What Is An Iterating Function?
If you are still not familiar with what an iterating function is, it is a function in the DAX formula language that generally has an X on the end. You also have table functions which iterate through a table like FILTER or VALUES, but in this case we’re going to deal solely with SUMX.
If you look at our formula for Total Sales, you can this is an iterating function because of the SUMX. Iterating means to iterate through every single row and do a calculation. In this case, for every single row in the Sales table, we are multiplying the quantity by the current price. We’re also going back to the Product table using the RELATED function to get that current price.

I want to show you how you can write really complex iterating functions which extract great insight that you might want to get in your data. For this tutorial, I want to calculate how many sales we make above a certain price. In this case, we are going to select $2,000.
I also want to know what our sales per month for products that are above $2000, but where someone buys more than just one product. We also want to see how well it compares to our Total Sales. This is the sort of complexity that can be achieved by writing just one formula and by using an iterating function.
Sale Price Greater Than $2000
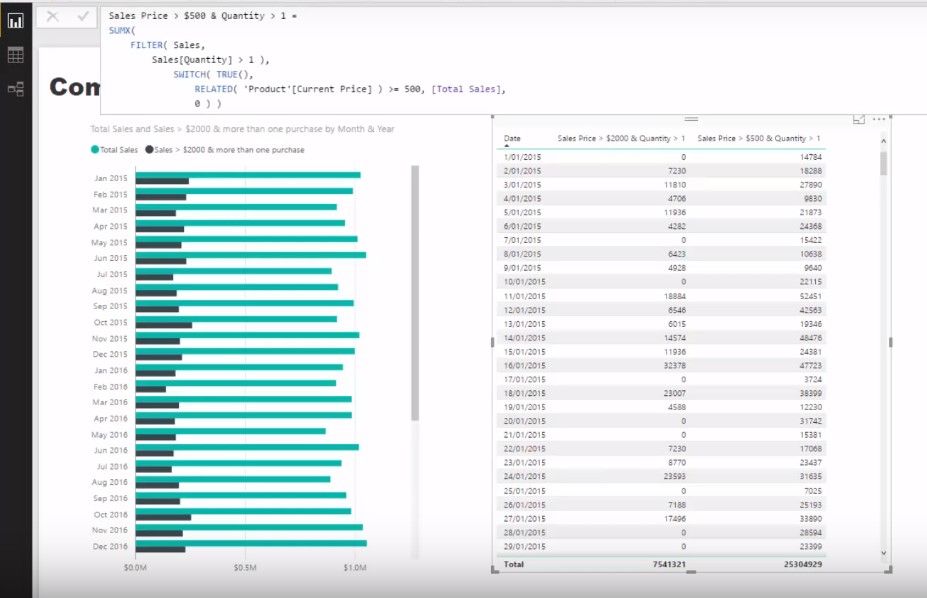
Let’s create a measure and call it Sale Price > $2000 & Quantity > 1. Generally, you’d have to write a few different columns or a few different measures to see the answer here but I’m going to show you how you can actually do it with just one. I’m going to start with SUMX and it says here we need to enter a table, right?

So we’re going to tackle this Quantity > 1 challenge by creating a table which is not the entire Sales table, but a table which has already filtered out anything that only saw once. We will use FILTER here since it is a table function, so you can put any sort of table inside. Then we’ll go with Sales and iterate through every single row in the Sales table within this FILTER function and filter out each row with a quantity that is greater than one.

For every sales above 1, I also want to create an additional logic. I am going to write an expression pattern and use SWITCH here. We’re going to say that if the sale has a current price of greater than or equal to $2000, then I want to calculate the Total Sales. If it is not, then I don’t want to calculate it at all. Lastly, I will put 0 as an alternative result.


This is how you write some quite complex iterating formulas in the DAX language. The key part is just understanding what sort of tables you can put in there and knowing what the actual iteration is doing.
In this case, for every single row in this filter down table, I’m evaluating what is the current price that is greater than $2000. If it is, we count up the sales of that row and if it is not, then it’s just 0.
Once I drag this measure into the table, you’ll see the results are similar to what we achieved in the first chart; the only difference is that this is on a daily basis.

Sale Price Greater Than $500
We can create additional insight here by reusing the same pattern. If we wanted to look at what was above $500, all we have to do is make some small changes here, press enter, and then drag this into the table as well.

Obviously, we can see a big difference because there are more products we’re counting up. This is because we’re not getting rid of as many higher price or lower price products as we were previously with the $2000.
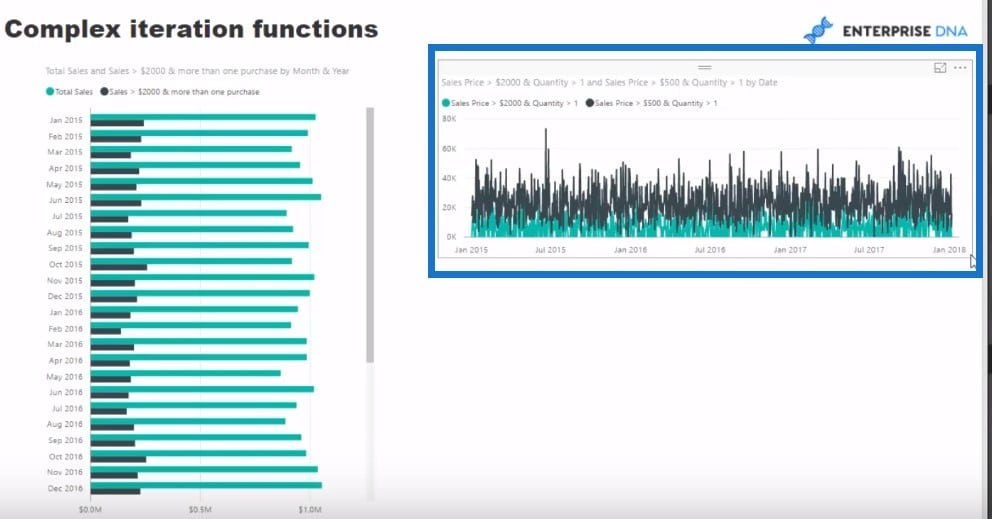
Visualising The Data
We can also change this into a visualization, however, as you can see the chart looks a bit busy so it’s probably better to remain in the table, or we can make the time frame more condensed like the chart on the left.
Hopefully, you can evaluate and understand how far you can go with these iterating functions within the DAX language. You can start to really dive in to any aspect of your data or extract very specific insights. The way to do it is by using this Row Context, which allows you to actually get inside of these iterating functions. You can look at an individual row, put it in or outside your calculation, and use the iterating functions such as SUMX, AVERAGEX, and COUNTX.
Iterating functions give you so much more flexibility in terms of the calculations that you can do at a row level versus aggregations which only allow you to aggregate up an entire column. Now within iterating functions, you first need to input a table reference and then an expression, but certainly expand your mind in terms of what either of these can actually be.
Within iterating functions you can actually put inside any table or any derivative of a table… also any virtual table or reference to table. That enables far more flexibility than you would ordinarily have if you just use an entire table like your transaction table to run some logic through.
The expression (or measure) you input can also be very advanced. You could use advanced IF logic or SWITCH logic, or basically anything that you can do at a row level inside a calculated column. You can actually put it in that expression part of an iterating function.
***** Related Links *****
Using Iterating Functions SUMX And AVERAGEX In Power BI
Advanced Logic Within DAX Iterating Functions – Detailed Example
How To Understand Virtual Tables Inside Iterating Functions In Power BI – DAX Concepts
Conclusion
The key takeaway from this post is that iterating functions are incredibly important to understand and learn well inside of Power BI.
If you do learn this well, then the opportunities to run internal calculations in memory via measures becomes really, really powerful.
Check out the Ultimate Beginner Guide to DAX if you are just starting out with the DAX language and Power BI. Plenty to learn within this free course. You can find this at Enterprise DNA On-demand.


