In this tutorial, I’m going to run through some of the most advanced types of analytical work you can do with Power BI, and that is Basket Analysis. This theoretical concept has lots of applications across Power BI. You may watch the full video of this tutorial at the bottom of this blog.
What I’m going to go into here is how you can use this type of analysis to evaluate cross selling opportunities within your data sets.
I go into quite a bit of detail regarding the DAX formulas that you need to implement. I did say this is advanced and it is very difficult to get your head around all the different elements within each formula.
What I would recommend here though is to gain exposure to it initially, and then review it over time, as you learn more about each individual function. That’s only if it doesn’t immediately make sense how it all fits together.
Inside The Data Model
The first thing that we need to do is to adjust our model. We have to specifically build our model for this type of analysis. There really is no other way to do it.
In this Basket Analysis example, we need to filter a particular product. But then we’ll also filter another product. For instance, if we want to see how many times product 5 has been bought compared to other products, we will filter/select product 5.
So there are two filters in operation here: the filter on the product we select, and the filter on every single other product. We evaluate whether a particular product is bought with another product, and that’s why we have to create this model.
We have our Products table and we have our Filter Products table. Here, we can see that the relationship is ‘inactive’.
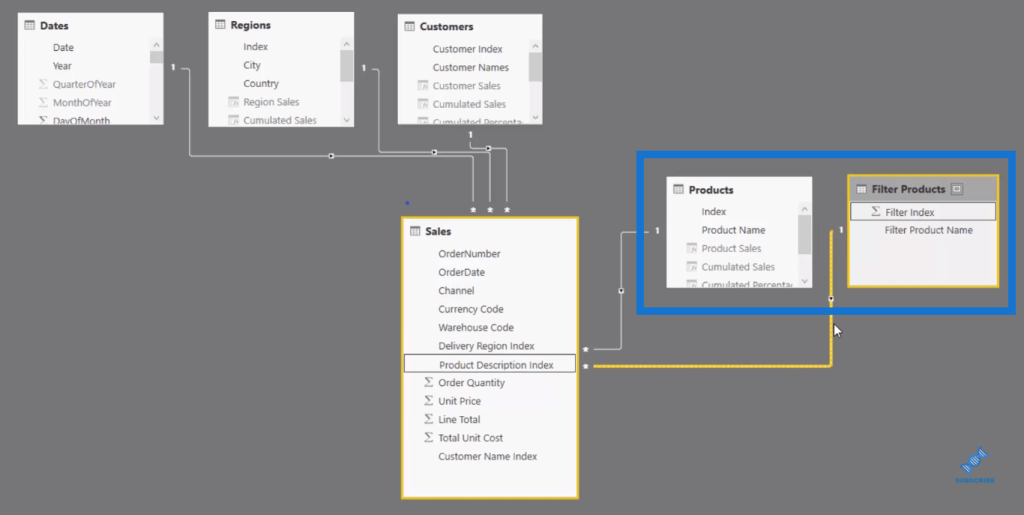
We’re going to work with some different contexts that will be applied from these two tables. It’s how we manage these filters or contexts within a formula that is going to allow us to achieve the result.
Evaluating Cross Selling Opportunities With Basket Analysis
Now let’s look at what the result is actually doing.
The Product Selection table allows us to select a product and see how many times this product has been bought with other products.
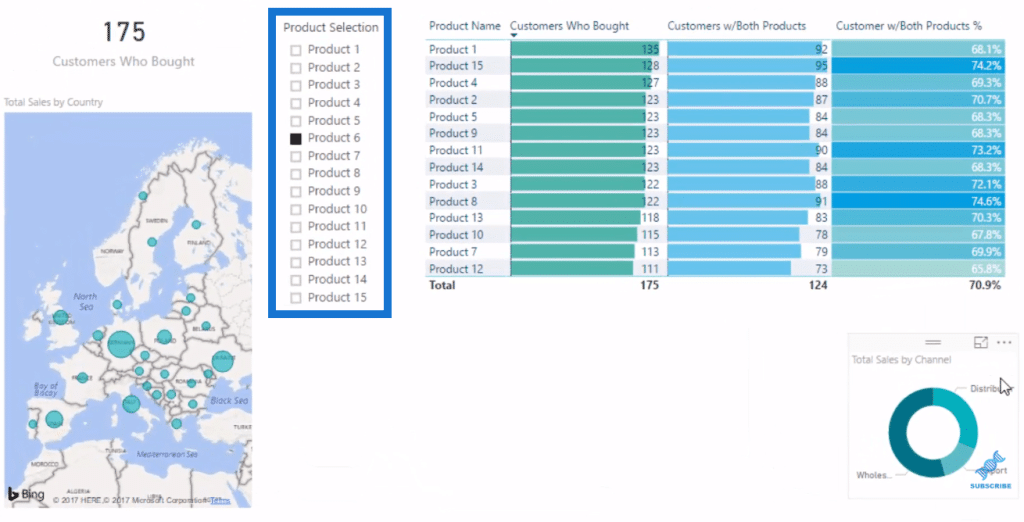
However, this Customers Who Bought table here does not relate to our Product Selection table.
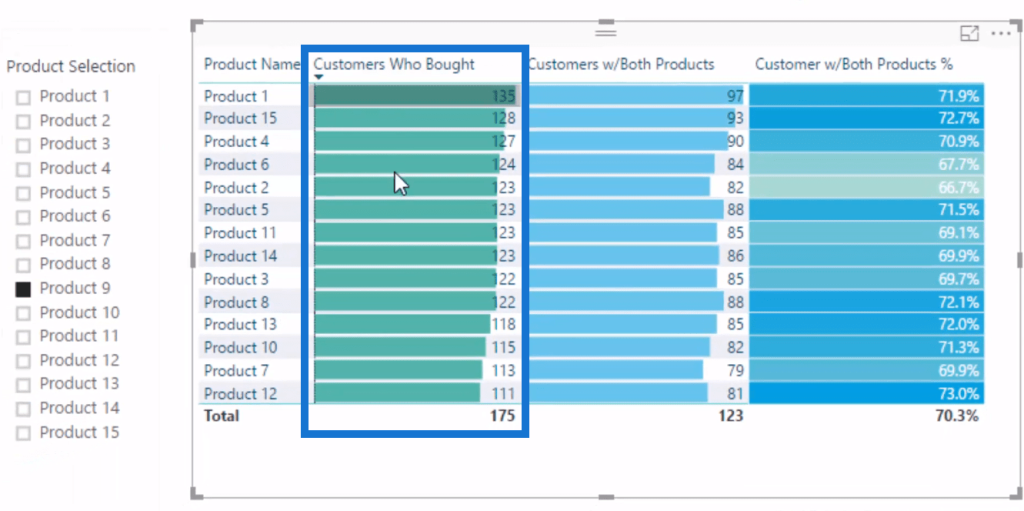
This table simply shows how many people bought the products shown in the Product Name table in 2016, as we have this filtered on 2016.
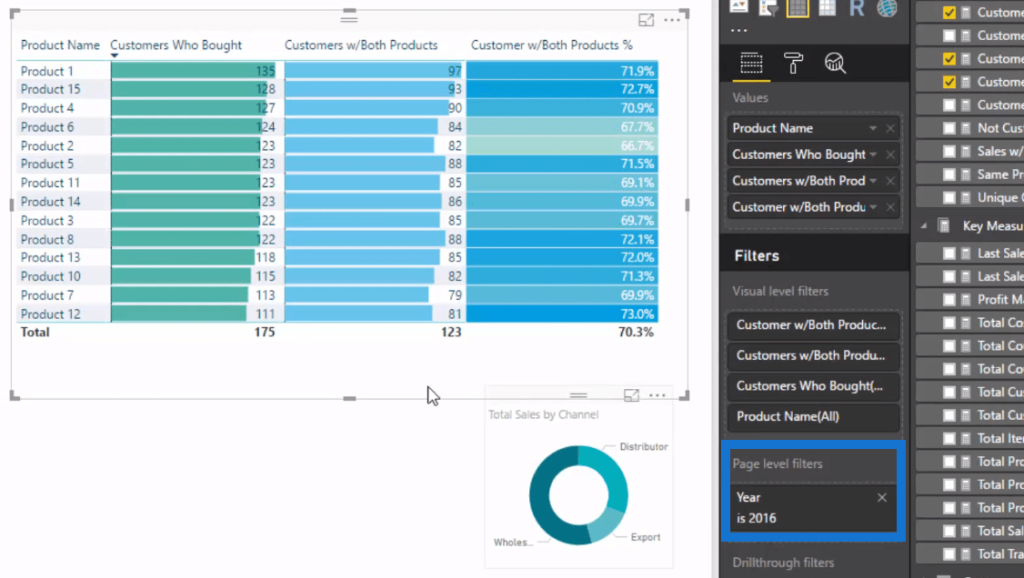
So for product 1, there are 135 people who bought it in 2016 while 128 people bought product 15 and so on.
The Product Selection slicer comes from the Filter Products we have in our model, which has an inactive relationship. So from our initial selection, this does nothing to the Customers Who Bought column.
What changes is this Customers With Both Products table because this formula evaluates the products (Product Selection slicer) and shows how many times it was bought with other products (Product Name table).
Let’s look at the formula behind all these to have a better understanding of the results.
The Formula At Work
There’s a little bit to this formula with complex DAX functions. I’ve used variables as effectively as I possibly can.
I’ve put an entire table filter inside this variable and called it Multi Purchase Evaluation.

We’re utilizing CALCULATETABLE, which is a table filter.
So for instance, we go with product 1, the filter is placed onto the Sales table. What VALUES does here is it creates a column table of all the unique people or customers that have bought product 1.
The ALL Products releases or gets rid of the Products filter, and then USERELATIONSHIP is going to turn on that other filter that has an inactive relationship.
It’s going to iterate through every single customer and see if that customer also bought the product that we select in the Product Selection slicer.
The VALUES function retains the customers who bought say, products 1 and product 6 for this particular result.
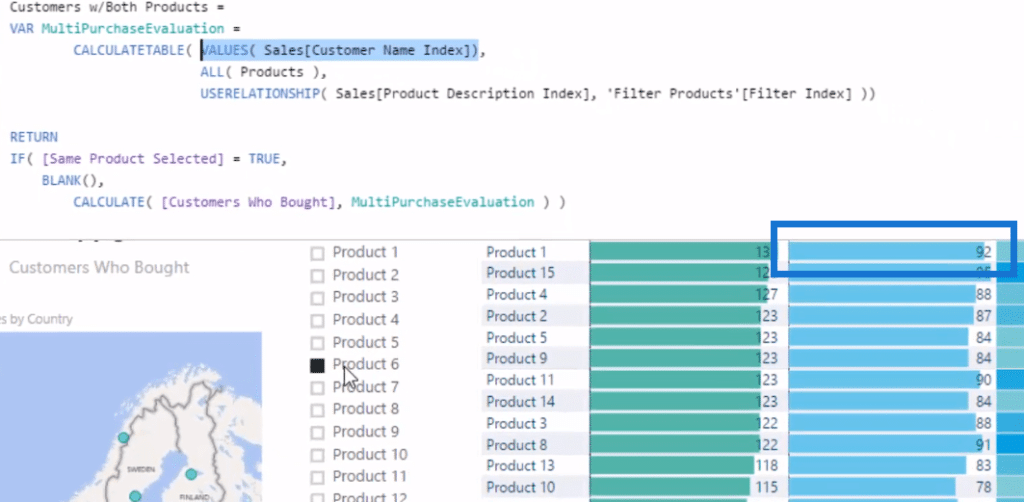
This evaluation here, Customers Who Bought…

is just doing a DISTINCTCOUNT of the customers that remain.

This is probably the one of the hardest things I’ve demonstrated on any video tutorial I’ve done, but it certainly has a lot of applications.
In the past, it probably would cost you tens of thousands of dollars to do this, but with Power BI, you can easily whip this up if you just understand some really advanced DAX formulas.
***** Related Links *****
Basket Analysis Introduction – Best Practice Tips For Power BI Using DAX
Discover The Amount Of Customers Who Purchase Multiple Products w/Power BI
Cross-Selling Matrix In Power BI – Advanced Analysis w/DAX
Conclusion
Think about how valuable this insight is…
Being able to evaluate almost in real-time… You might ask yourself something along the lines of, “Well, should I take this opportunity to upsell our customers based on what they bought previously? Are there any promotions that we can run that might enable us to increase our revenue or profits in the future based on this Cross Selling Analysis or Basket Analysis that we’re implementing?”
I hope you can see and realize the immense power of insights like these.
Learning how to implement this analysis really creates a lot of value for yourself, for your teams, and for your organizations. Definitely go for it and dive into the tutorial and see if you can implement this in your own models and reports.
Good luck with this one!
Sam


