
We’re going to review a unique customer insight in this example. Specifically, we’re going to understand how to work out the number of customers with multiple product purchases. You may watch the full video of this tutorial at the bottom of this blog.
While this might seem like a relatively logical calculation, there’s actually more to it when using DAX.
This is a perfect example of how you can utilize Power BI to help certain areas within an organization, such as sales or marketing teams, drive data decisions around these functions.

In this tutorial, I’m going to demonstrate how you can discover the number of customers with multiple product purchases.
Sample Data Of Multiple Product Purchases
This data is pretty interesting. It allows you to see and track customer trends for a specific products. You can also predict the certain group of customers who will purchase the said products again.
This technique is very important especially when you want to analyze the customers but your initial context is the product.
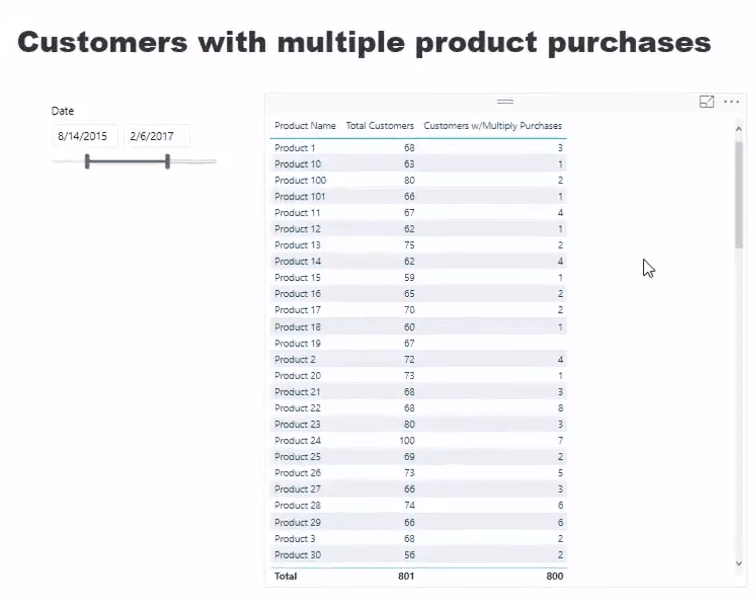
In my example, I created a Total Customers column. This is where you can count the total number of customers who purchased any of the products.

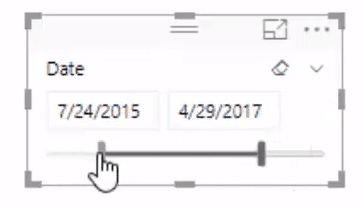
Then, I’ve also created this Date selector where you can control the range of dates in your data.
The data in the table changes automatically when you click through different time frames.

Above all, it is important to find out how many customers have actually purchased a certain product more than once. You can easily view that information under the Customers w/Multiply Purchases column.

In my example here, the first product has a total of 89 customers. You’ll see that out of 89 customers, only 4 have actually purchased the product more than once.

Through this technique, you can evaluate how much of your sales are from repeat customers and brand-new customers. This is a really great insight from a business perspective.
Finding Out The Customers With Multiple Purchases
To find out the necessary data, you should use this formula. This is a combination of COUNTROWS, FILTER, and SUMMARIZE functions.
There are so many ways to utilize this logic in your Power BI.

First, let’s drill into this particular part of the formula. This is where SUMMARIZE comes in and works really well.

The formula can evaluate every customer. After that, it’ll return a virtual table for every single customer and their corresponding number of transactions.
Inside the SUMMARIZE function, you can see that I’ve added a Total Transactions formula.

This formula is just a count rows of the sales table. Therefore, it counts every single transaction from any customer.
It will calculate the number of transactions for each customer, regardless of the product. That is because I put it inside the SUMMARIZE context. Hence, the Customer[Customer ID] in the formula.
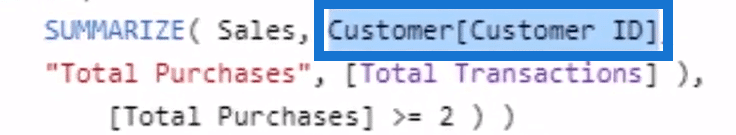
To sum up, the SUMMARIZE function basically creates a virtual table of every single customer and their number of purchases of a specific product.
After that, I’ve placed this virtual table inside the FILTER function by Total Purchases.

If the Total Purchase is equal or more than one, it will retain that particular customer in the virtual table.
Once I have the virtual table that’s filtered for customers with multiple product purchase, I’ll then use the COUNTROWS function.

The COUNTROWS function will eventually give us the data under the Customers w/ Multiply Purchase column.

Working Out The Percentage
There is another interesting thing that you can learn from this tutorial. You can even create another measure and work out the percentage.
To do that, just click New Measure.

You just have to rename the measure as Multiple Purchase %. Then, follow the same formula below.

Basically, I used the DIVIDE function here. I just divided the total number of customers by the multiple product purchases of the total customers.
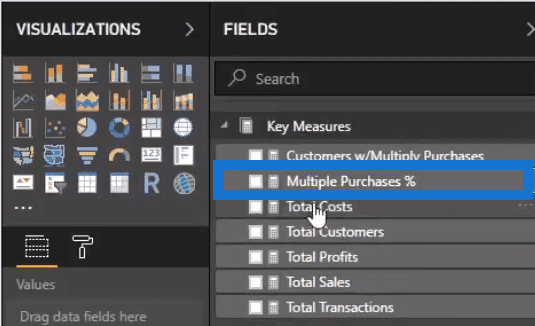
After that, click the Modeling tab, and then move this under Key Measures.
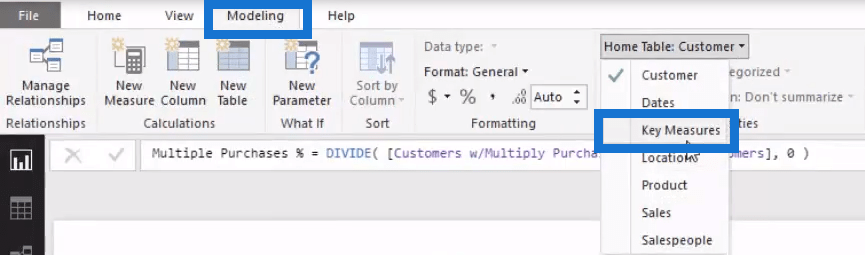
In your Visualizations model here, you can see that Multiple Purchase % is now under Key Measures.
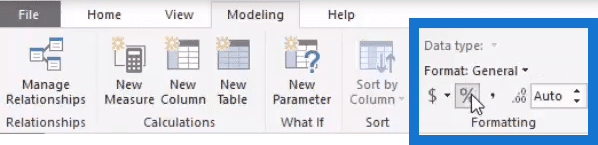
Next, you need to make the format into a percentage.
You have to drag that measure into the table. Just like that, you’ll see which products were purchased more regularly by the same clients.

Since I showed a demo data set, it’s probably more variable when it comes to actual businesses. If you’re a retailer, you’re going to have certain products that you think would be purchased more by particular customers.
***** Related Links *****
Where Are Your Best Sales By Product?
Who Are Your Top 20% Of Customers Based On Any Metric
Find Top Customers Using RANKX In Power BI
Conclusion
In this blog, I run through how to work out multiple product purchase of your customers. I have often mentioned how powerful the insights you can get from virtual tables. But this is another great insight that you can easily extract in your Power BI around multiple product purchase.
Power BI is perfect for calculations on customers. You can easily filter your data into stores, regions, locations, or any type of dimension.
It would be great if could learn and implement this sort of logic into your own models, especially if you’re dealing with customer data.
You can also watch out for our new tutorials in Enterprise DNA TV. I’m really looking forward to getting those out to you.
Enjoy the content!
Sam
***** Learning Power BI? *****
FREE COURSE – Ultimate Beginners Guide To Power BI
FREE COURSE – Ultimate Beginners Guide To DAX
FREE – 60 Page DAX Reference Guide Download
FREE – Power BI Resources
Enterprise DNA Membership
Enterprise DNA Online
Enterprise DNA Events


