This blog will demonstrate the best method of adding a conditional index column on Power BI. Using the Power Query, we’ll add an index number from 1 for each ID in the table and begins in the row after the values in the date columns hit more than or equal to 90. You can watch the full video of this tutorial at the bottom of this blog.
Index Column in Power BI: Group By
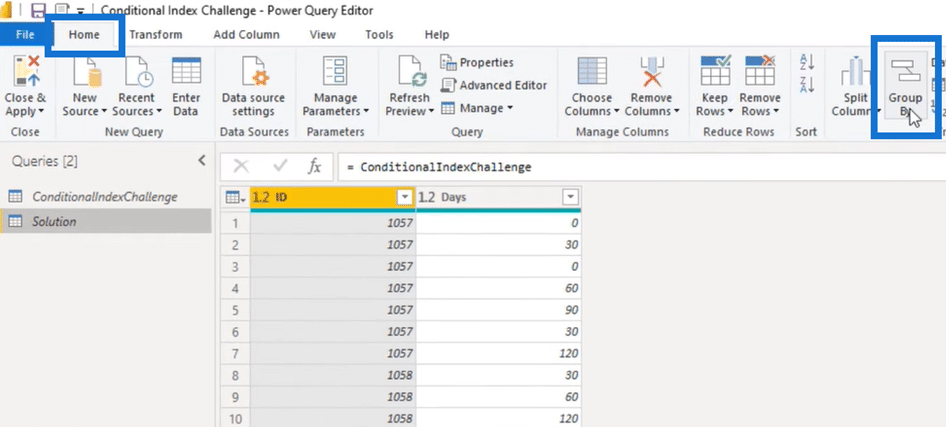
Let’s go to the Power Query Editor and start with a Group By in the ID column. Doing so will return the table with unique ID values.

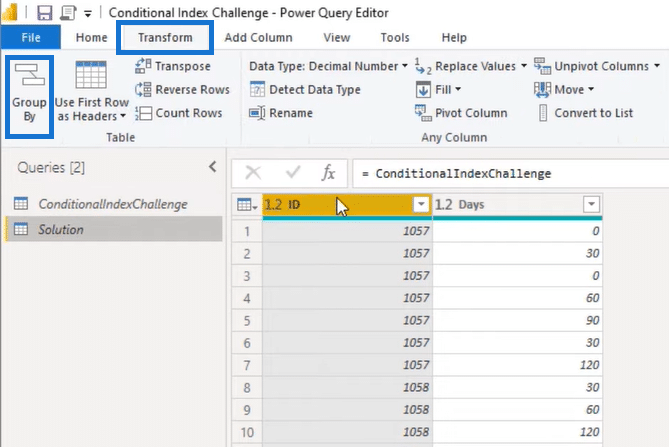
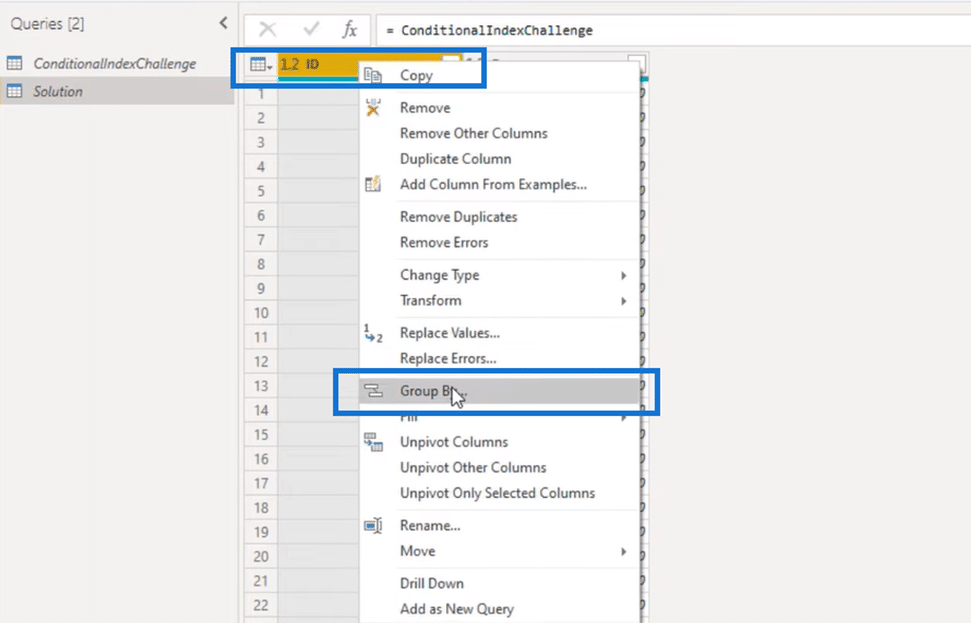
Now there are two places where you can find Group By: in the Transform section of the Home tab and the Table section of the Transform tab. But you can also right-click the column header and find it there.
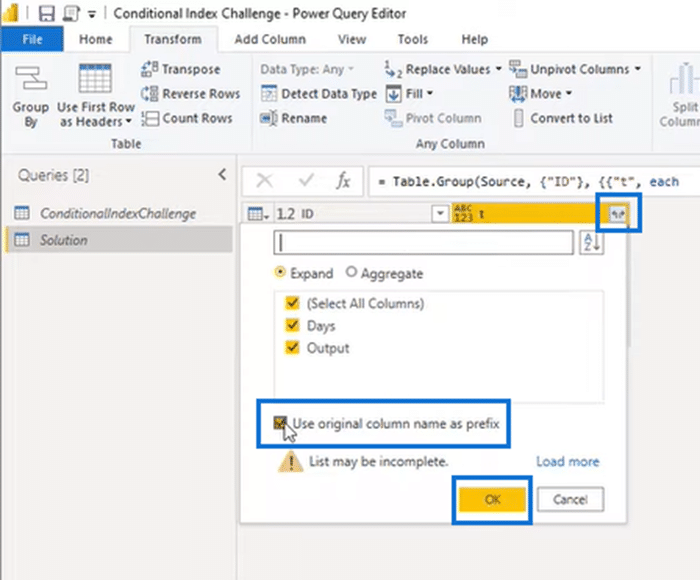
Selecting Group By will open the dialog box below, with numerous aggregations. Because we only want to segment our data, we’ll choose the operation All Rows and rename that column t.
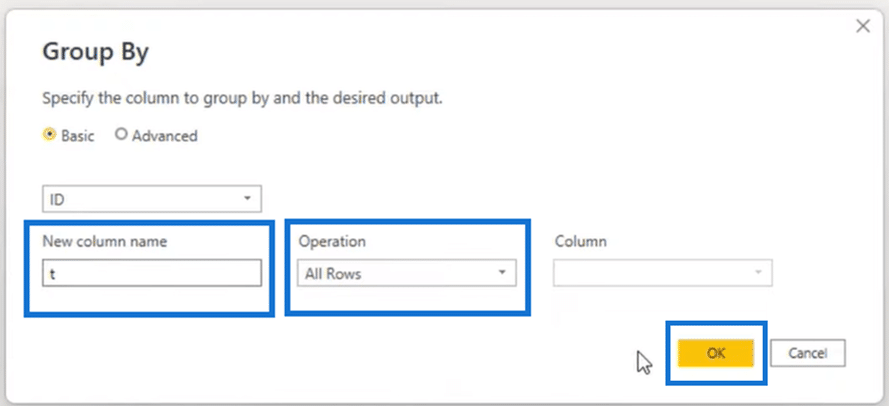
After selecting that operation and renaming the column, we then press OK to complete the changes. This action gives us the table below.
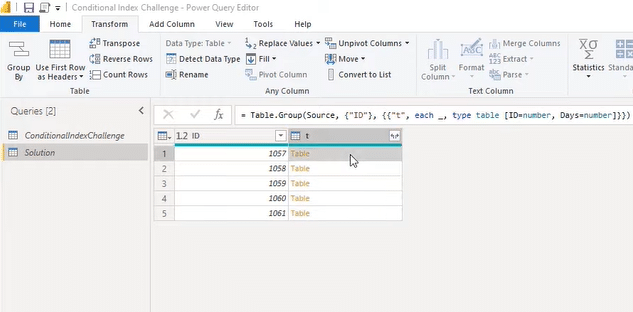
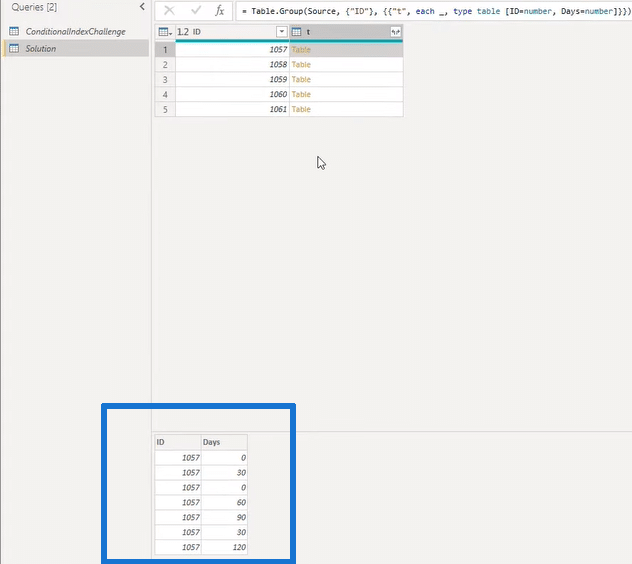
So clicking off in the white space will show another preview section below. Thus, if we click the column highlighted above, it will give us this additional preview section:
Now we know the information that we’re getting. Let’s continue by opening the Advanced Editor window.
Using the Advance Editor
The image below is our table in the Advance Editor of the Power Query. You can find the tool at the top left of the screen beside the Save icon and get access to its extensive array of uses.
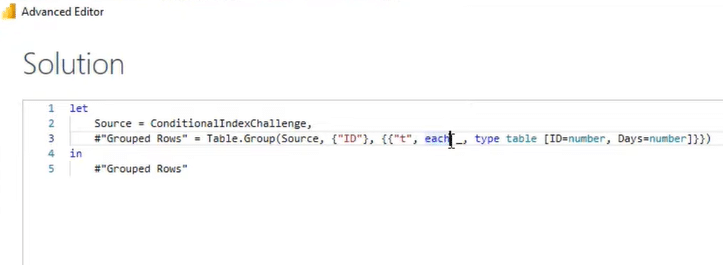
We will create some intermediate calculations to build out our logic gradually. And for that, we’ll need a Nested Let expression to create variables and assign values to them. So after the each word, I’ll press enter and type in that let.

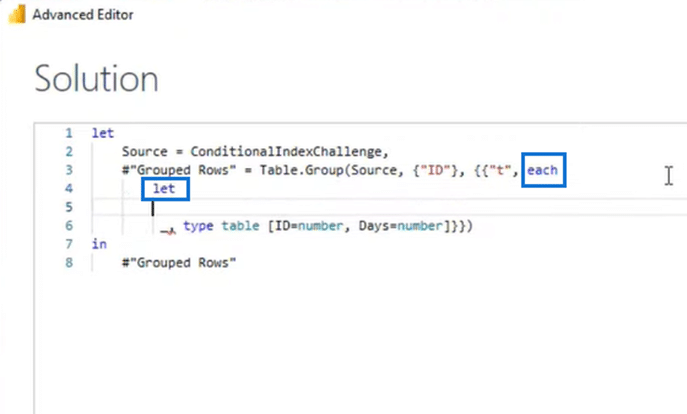
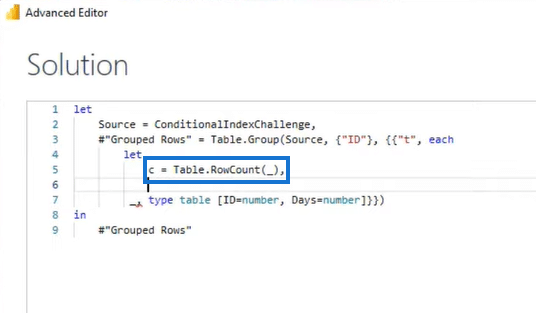
Table.RowCount
The first thing we want to know is the number of rows in our Nested Table. So we’ll create a variable called C and choose between two options. We can either use the function Table.RowCount or List.Count.
Either way, both options are correct so let’s go with Table.RowCount and enter that underscore, followed by a comma.
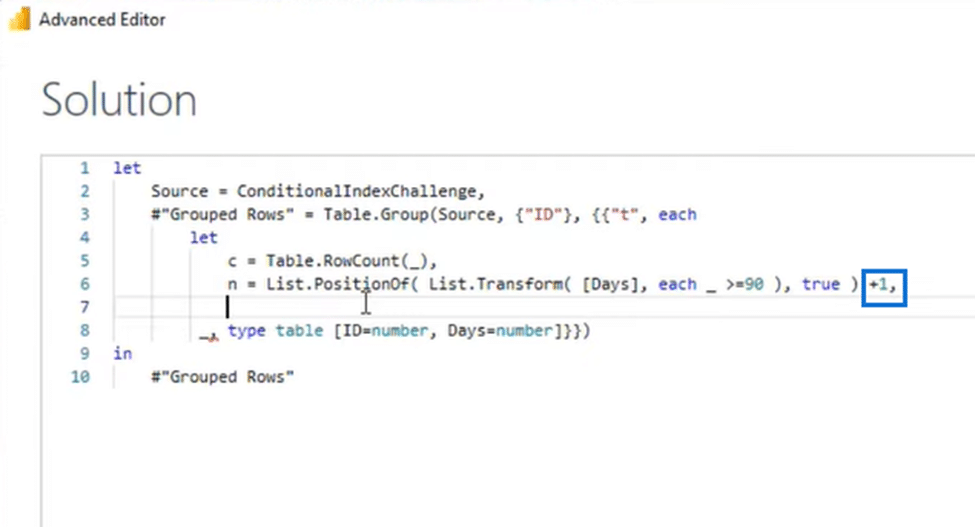
List.PositionOf
Next, we want to learn where in the Days column we are meeting that greater than or equal to 90 days criteria. So we’ll type in n = List.PositionOf, which takes a list as the first parameter and its value to match as the second.
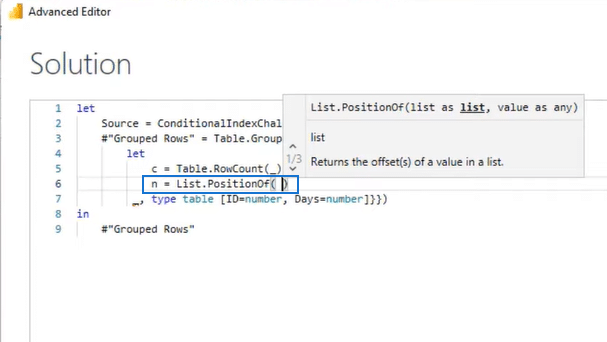
We will be looking in our Days column, so we’ll type in Days inside an open and close bracket. But for the value to match that parameter, it can’t be a fixed value, as we’re looking for anything equal to or greater than 90.
So we’ll use List.Transform to transform the values in our Days column to either True or False based on that condition. So we’ll add List.Transform and work through the Days column by entering each _ >= 90.
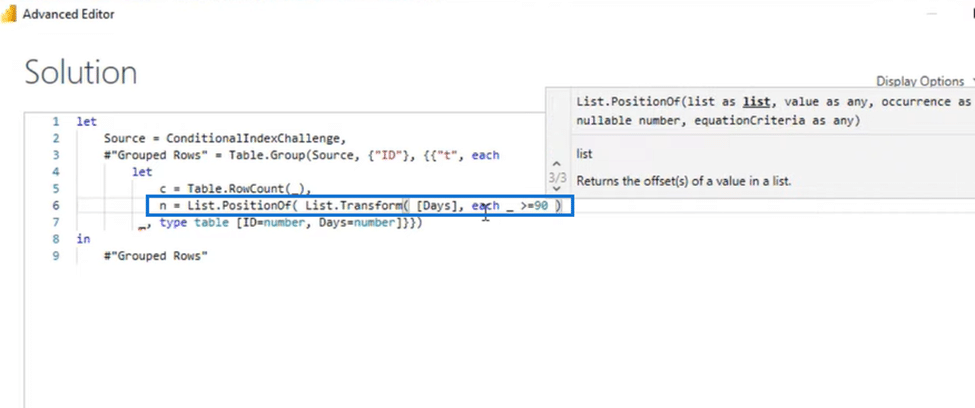
This action will now return a list with Trues and Falses, so my matching condition for the list of opposition is anything that equals true. Thus, we type in true, and press Enter to go to a new line.
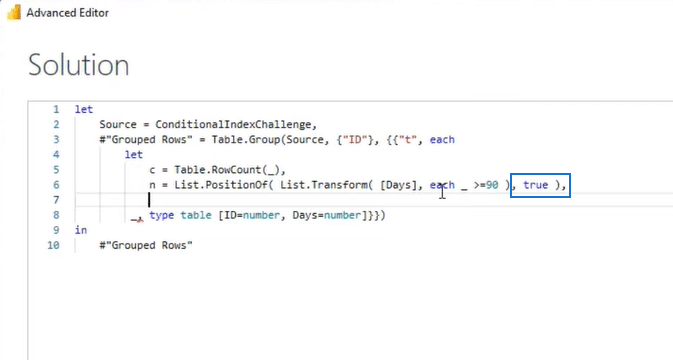
Now we’ll return the position where the value meets that 90 days criteria, but we have to start our index from the row after that. So we’ll add one to the result of this opposition by typing in +1.
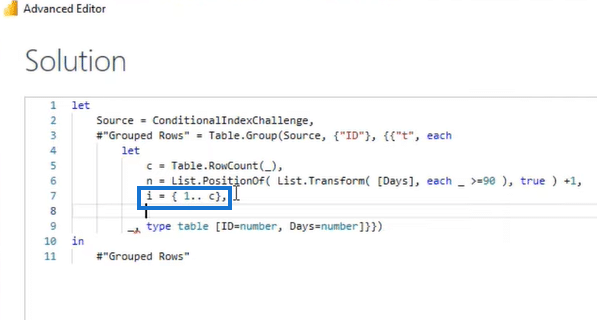
Generic List
We’ll create a generic list with indexes from one to the last row of our table. So let’s type in i = ( 1.. c), and press Enter to go to a new line.
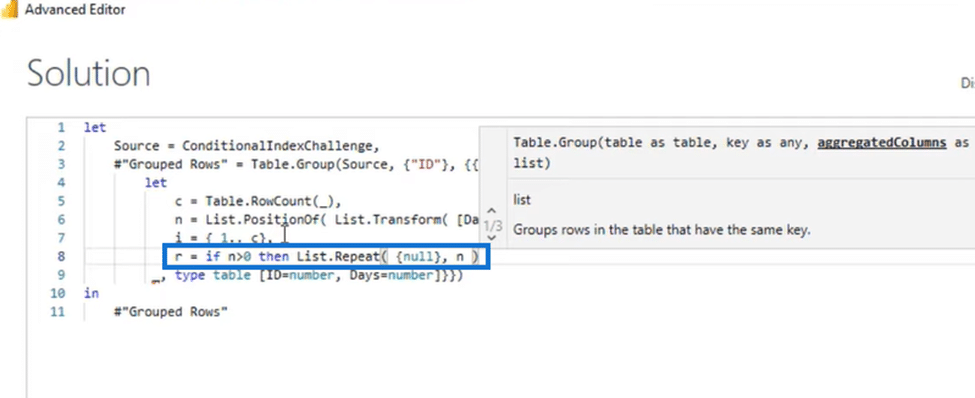
List.Repeat
We will use conditional logic here because the List.PositionOf will return -1 if a condition is unmet. And because we’re adding one back, that -1 will turn into a 0, which is a valid position in a list.
That said, we will create a condition if n is greater than 0, which means we found a value of 90 or above. Additionally, we’ll make a list with nulls until we hit that value of n. Thus, we’ll enter a list with a null value and repeat that n times.
Index Column in Power BI: Restricting Elements
Now, after this point, our index should start. We can combine our list with index values to the list we’ve just created by adding & i into the equation.
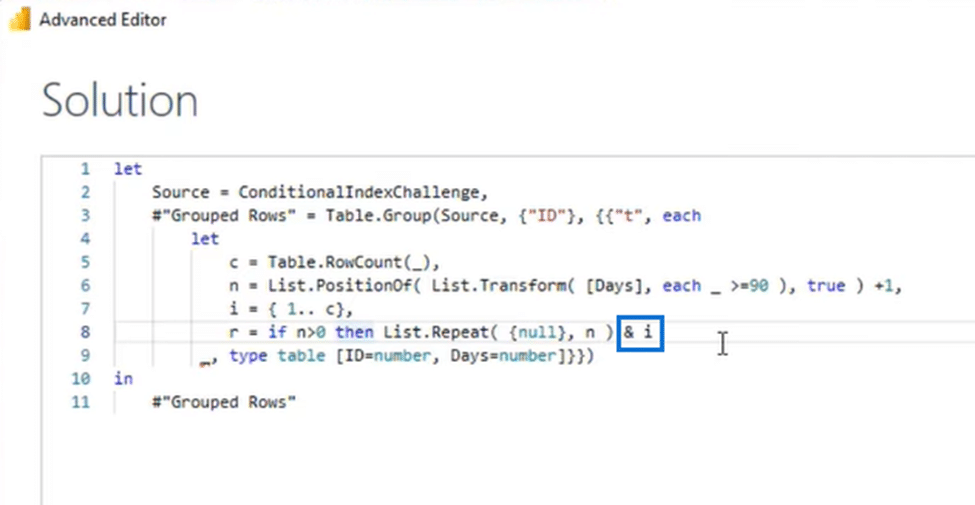
However, this action will generate a list that can be larger than the number of rows we have in our table. Therefore, we need to restrict the number of elements in it. So we will add List.FirstN and a comma plus c just like in the image below.
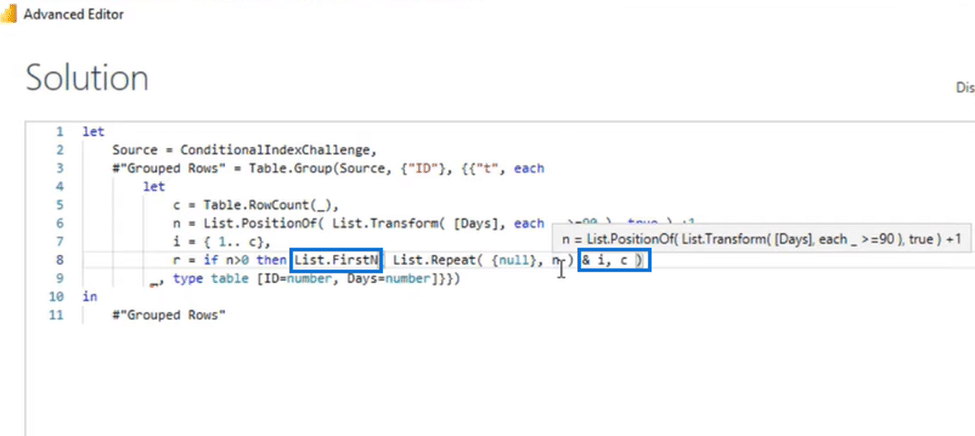
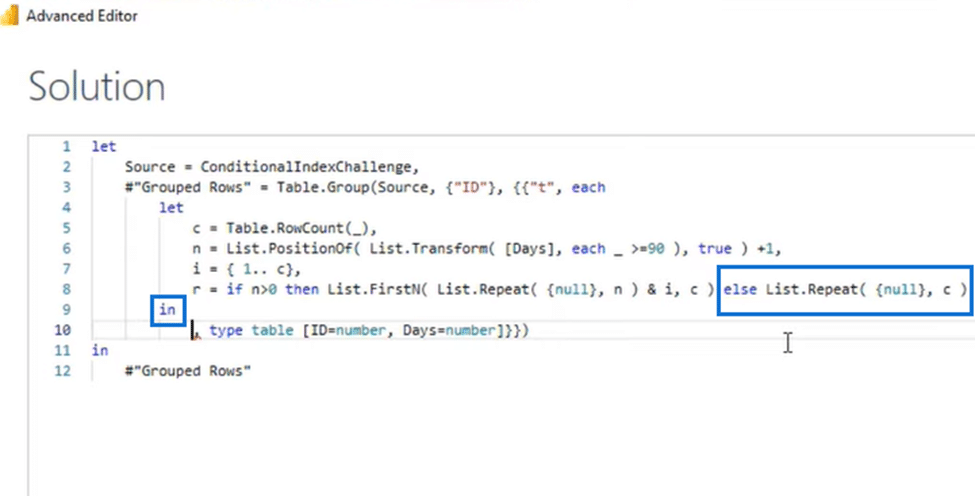
This action ensures that the number of elements in the list we’re creating is never larger than the number of rows in the table. Now, if there isn’t a value for n, we only have to create a list with nulls.
Thus, we enter else followed by List.Repeat (null), c, representing the number of rows in the table. Finally, we press Enter and put an in clause in the next line just like below.
Index Column in Power BI: Construct table
Now we can construct a table with the data we require for the output. So we continue by entering Table.FromColumns in the first part of the last line and add a list for each column inside it.

The first list we want to return from Table T is the Days column, so we’ll put in Days. The second one is the list r, and together with the rest of the equation, it will return a type table.
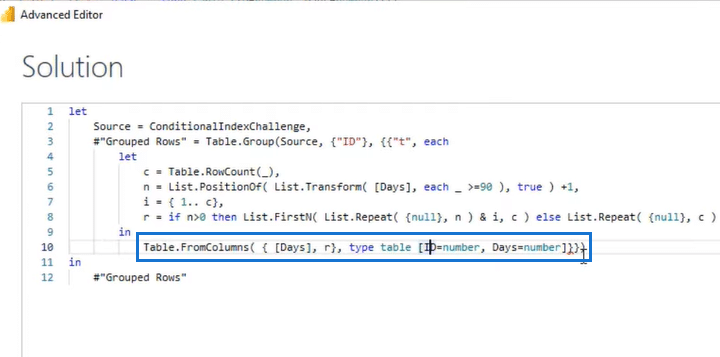
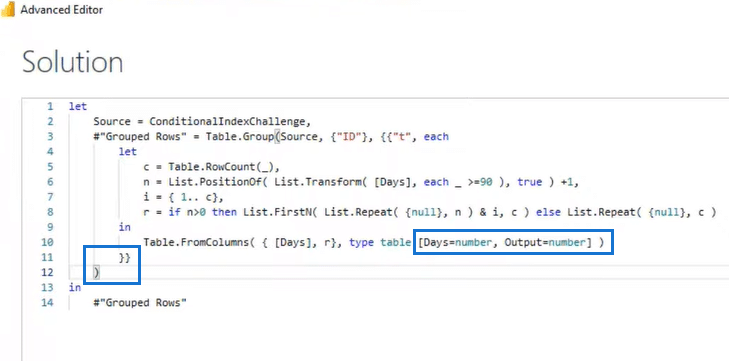
Now our first column (ID), a type number, is our Days column, so we’ll call that Days. Meanwhile, the second column, another type number, will be in the output. Finally, we close our function and press Enter to complete the process.
Now, we need to check and see if it returns the correct results. First, we’ll click off to the side in the white space (highlighted in the above image), and what appears at the bottom will be this:
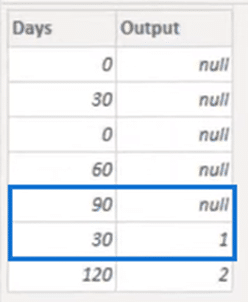
The 5th row is the first instance where we hit 90 and the 6th one is where our index starts. Both are correct, so now we can expand those nested tables, and we are done.
Click on the expand button at the right of the column header, uncheck the Use original column name as prefix option, and click OK.
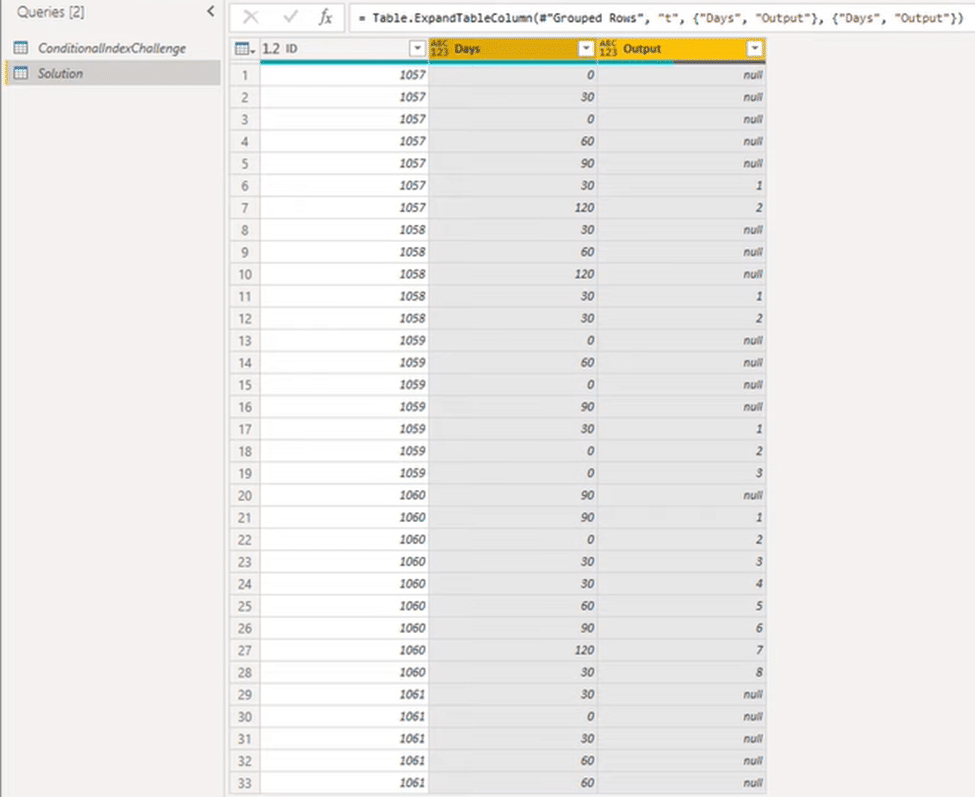
After completing the above changes, we have our final table below!
***** Related Links *****
Power Query: How To Merge Tables W/Different Columns
Custom Columns In Power BI Vs. Conditional Columns
Microsoft Power Query Tutorial On How To Fix Mixed Fixed Column Width Issues
Conclusion
The Index Column in Power BI lets you add a new column to the table with explicit position values, usually for supporting other transformation patterns. The index can start from zero by default or one, but you can choose the custom starting point and the seed.
Today, we took things to another level by adding a conditional index column on Power BI. Through the Power Query, we added an index number from 1 for each ID in the table and began in the row after the values in the date columns that are more than or equal to 90.
All the best,
Melissa de Korte