In this tutorial, we’re going to learn more about the advanced time intelligence feature in Power BI to compare current sales to the previous best month. You may watch the full video of this tutorial at the bottom of this blog.
This is actually a unique question that was raised at the Enterprise DNA Support Forum. And as soon as I heard it, I thought wow! We can actually do this in Power BI.
This is a very unique piece of analysis that will give you more insight into what leads to successful outcomes within your organization.
As we already know, successful businesses often compare their revenues for this month to their best month throughout their organization’s history. This is because it’s very important to understand what specific factors were at play and also how these factors interact to create strong results in the revenue.
It’s truly amazing how we can get this insight about advanced time intelligence in Power BI.
Comparing Total Sales To Previous Best Month
Here in this table, you can see what should be our end product. This is how it’s going to look like when we try to compare current sales to the previous best month in Power BI.

As we can see in the table, we should be able to have a calculation that’ll allow us to continually evaluate the current month in every month prior to that. When we can see what is the highest amount up until that point, we can consider that as the highest sales so far.
In the table, the first result we have under the Highest Previous Sales Month column is in February. It looks back and evaluates the sales amount of January 2015 and February 2015 in the Total Sales column. Then, it returns the highest number which is 1,024,700.

As we move down the table, we can see that in July 2015, the result is now higher than the previous one. That is because between the previous months up until July 2015, the highest total sales was 1,049,952.

A pretty cool insight, right? This comparison can totally give us an indication of how well the business is performing. Now, let’s get down to the advanced calculations.
Calculating The Best Previous Month
Now, the challenge here is how to create a calculation that could really compare the sales effectively. As soon as we can calculate the numbers in the Highest Previous Sales Month column, we can easily compute the percentage in the Comparison vs Best Month column.
First, this is our formula.

To calculate the total sales, we need to totally change the context of the calculation and rank the sales from highest to lowest.
To return the highest amount, we need to use the TOPN formula.

With that, we can change the context from a ranking perspective. But we also need to specify only one row in the table, so you need to enter 1.

Now, the result of that row is going to be determined by the logic that we place within it. To achieve that, we should use the FILTER function, with SUMMARIZE function inside of it.

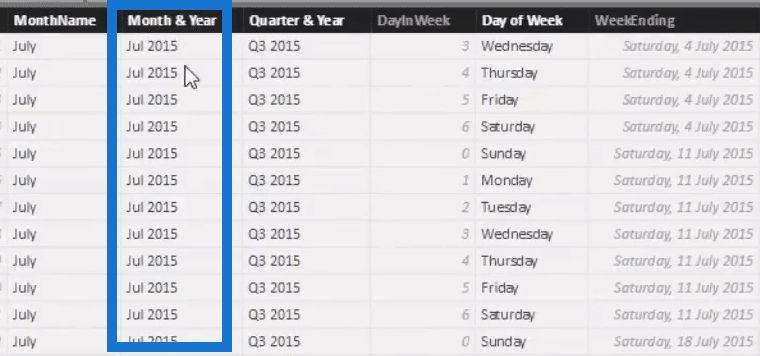
By using the mentioned formula, we are returning a table for every single Month & Year,

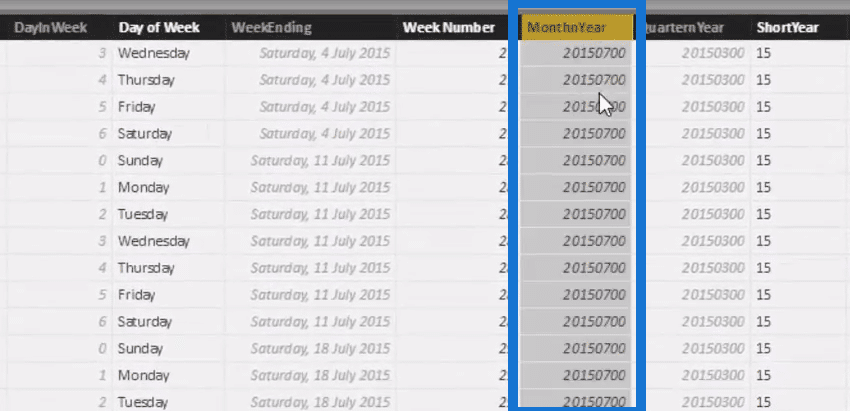
and also the MonthnYear column as well.

In my data table, the MonthnYear column is a numeric field.

Meanwhile, the Month & Year column is actually a text field.

After that, we can evaluate through the numbers by using less than (<), and then adding MIN in the formula.

The formula returns the corresponding month and year index. But because it’s within a filter, we’re going to rate through every single month and year to create a dynamic table.
To finish off our TOPN formula, we need to rank every month within the virtual table based on a particular measure. Since we only want to return the top sales up to that point, we need to put that measure and enter Total Sales.

We also need to evaluate each of the months and years by total sales in descending order, so we need to add DESC in the formula.

When we look back on the table, we can see that June 2015 has the new highest number after 1, 024, 700. So that’s our highest previous sales month.

Working Out The Comparison
Lastly, I created a simple logic for comparison with the best month.
To compare current sales to previous best month, I used a simple logic with the DIVIDE function. Subtract the Highest Previous Sales Mth from our Total Sales and then divide the difference by the Highest Previous Sales Mth.

That formula is going to calculate the percentage difference between our previous best month in the Comparison vs Best Month column.

As we can see by now, using DAX calculations in Power BI can bring about very unique insights. It is a great technique to really get ahead of your business. Personally, I love how powerful this analysis is in Power BI.
***** Related Links *****
Using SAMEPERIODLASTYEAR To Compare The Difference Between This Year & Last Year Showing Actual Results vs Targets Only To Last Sales Date In Power BI
Dynamically Compare Current Totals To Last Years Totals
Conclusion
Sometimes, it’s not only worthwhile to analyze historic months, quarters, or years. Many times, it might actually be helpful to focus on that one dynamic month where the best performance was achieved.
We can efficiently complete these calculations using Power BI to compare current sales to the previous best month. Certainly, there are many ways to combine various different DAX functions and logic within the formulas. Additionally, we can learn to effectively use CALCULATE and FILTER functions together.
Cheers,
Sam
***** Learning Power BI? *****
FREE COURSE – Ultimate Beginners Guide To Power BI
FREE COURSE – Ultimate Beginners Guide To DAX
FREE – 60 Page DAX Reference Guide Download
FREE – Power BI Resources
Enterprise DNA Membership
Enterprise DNA Online
Enterprise DNA Events


