The possibilities of using the What If parameter in Power BI is deemed endless. It gives users and businesses the flexibility to design a solution for the critical answers and insights that they need. You may watch the full video of this tutorial at the bottom of this blog.
In the recent Enterprise DNA learning summit, we had a successful session regarding the usage and implementation of What If Parameter in Power BI.
As a result, we’re able to create this dashboard that we’ll be using as an example for today’s tutorial.

For today’s tutorial, I will only do a review on how you can get started with the What If Parameter in Power BI.
This might be a good opportunity for us to solely deep dive into how I incorporated What If Parameters into my data models in Power BI reports, and how we can also overlay it into different visualizations.
However, you may want to look at how we were able to create this dashboard and incorporate those visualizations. In that case, just click the link below for the full session of our recent learning summit regarding the usage and implementation of the What If Parameter in Power BI.
Understanding The What If Parameter In Power BI
A What If Parameter is mainly used for the visualization and analysis of the effects of a change in a variable.

When utilizing the What If Parameters, you can run varying scenario analysis on your data. With this, you can historically look up and analyze what would have happened if a different scenario had occurred.
What If Analysis Implementation In Power BI
The key point in doing the What If analysis is to identify the variables that you need to shock or adjust in your data sets.
These variables should be the ones that can significantly affect the performance of a particular scenario that you might want to overlay on your results. It could be pricing, demand, costs, sales, or competition.
Then, you need to think about how you can incorporate the What If Parameters into those variables, and analyze how you can effectively implement the analysis that you’re trying to do.
Here’s a look at the Sales Table that we’re going to use for our examples.

First Scenario: Demand
To give an instance of a What If analysis, let’s first think of or identify the variable which can significantly affect the data sets from the Sales Table. In this case, we will consider Demand.

Now, let’s try to run a scenario by considering the Demand. The Demand will serve as the main variable that we’ll shock or adjust to predict potential Sales or transactions in both the future and the past.
Identifying The Parameter For The Demand Scenario
As we look at the Sales table, we need to isolate or identify the measure which will serve as the parameter. This parameter is what you will integrate into the variable (Demand Scenario).
For this Demand scenario, the measure that we’ll mainly consider is the Order Quantity column.

This Order Quantity column would definitely cause changes in demand. This is due to the fact that if demand goes up, we’d definitely sell more orders; and if it goes down, we’d sell less.
Second Scenario: Pricing
The next scenario that we’ll be running will be dependent on the Pricing. We need to keep in mind that pricing can affect every aspect of your business. It could be sales volume, market share, and customers’ perceptions of your company.

Therefore, the main variable that we’ll be considering is the Pricing. This will be used to predict the impact of price fluctuations in our Sales for both future and past transactions.
Identifying The Parameter For The Pricing Scenario
For the Pricing scenario, the measure that we’ll mainly consider is the Unit Price column.

This Unit Price column or measure is what we’ll be using as a parameter that we can integrate into the variable (Pricing Scenario).
In reality, demand doesn’t increase or decrease for no reason. There will always be factors at play that will trigger it. Some could be changes in price or perhaps it could be competition etc.
In that case, there will be a need for us to combine various parameters all at once. And the only way for you to effectively perform the What If analysis is by overlaying or incorporating the correct What If Parameters to the identified variables inside an iterating function.
Importance Of Iterating Functions In What If Analysis
Understanding iterating functions is also a key point in performing scenario analysis using What If parameters in Power BI.
Iterating functions are the functions that have an X at the end. These functions evaluate logic at every single row of a table that you place inside the function.
Since we used these scenarios to predict potential Sales, our benchmark or standard point of measure will be the Sales, otherwise known as Sales forecast.

By using the iterating functions, we’ll be able to overlay the individual parameters on our specified variables. This will be helpful in forecasting every single potential transaction in both the future and the past.
Analyzing The Sample Measure
Now, let’s try to analyze this logic or measure what I’ve created.

In this measure, I used SUMX as the iterating function for my What If analysis measure which is the Sales Scenarios.

The SUMX function returns the sum of an expression evaluated for each row in a table.
In this case, we’ll iterate through every single row in the Sales Table using the SUMX function.

Then, multiply the value from the Order Quantity column by the sum of 1 and the value of the Demand Scenario.

In this case, the current value of the Demand Scenario is 6%. So, we’re going to add 1 to 0.06, which will return a value of 1.06.

Afterwards, multiply the result of the previous calculation by the results of the highlighted calculation from the image below.

Here, you need to multiply the value from the Unit Price column, which is also multiplied by the sum of 1 and the value of the Pricing Scenario.
As simple as it is, that’s how we integrate our What If parameters into our actual results. We can also dynamically change them to produce forecasts or predicted results.
Dynamic Selection Of Different Scenarios
After the integration of the What If Parameters, we can now dynamically select a range of different scenarios and place additional context on our results.

For instance, aside from displaying the results from all the states of the USA, we can also select a certain state of the US from the selection box. This allows us to display varying results and information on our report page.
Locating The What If Parameter in Power BI
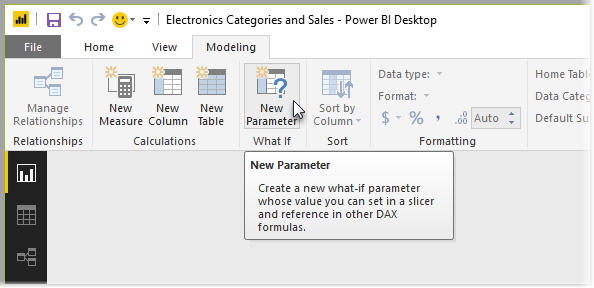
The What if Parameter is on the Modeling tab in Power BI Desktop.

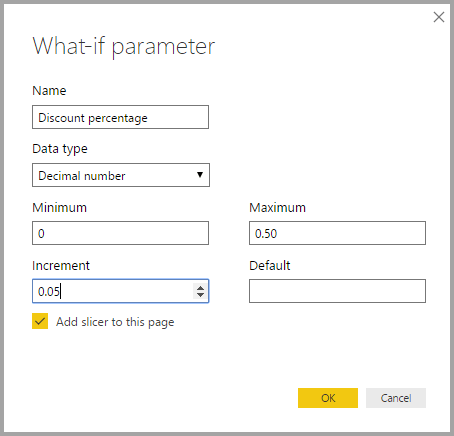
When you select it, a dialog where you can configure the parameter will appear.

In the given image, we’ve created a parameter called Discount percentage and set its data type to Decimal number. The Minimum value is zero, and the Maximum is 0.50 (fifty percent).
We’ve also set the Increment to 0.05, or five percent. That’s how much the parameter will adjust when integrated within a report.
Consequently, that’s how you can set up a What If Parameter in Power BI.
As I mentioned, I won’t be diving deeper into how you can exactly do it. However, you may check out the link that I provided earlier for the full session of my discussion during our recent learning summit.
Bookmarking Scenarios In Your What If Analysis
There are several ways how you can produce various predictions or forecasts with your What If analysis. One exciting way of utilizing the full potential of your analysis is by using its bookmark feature.
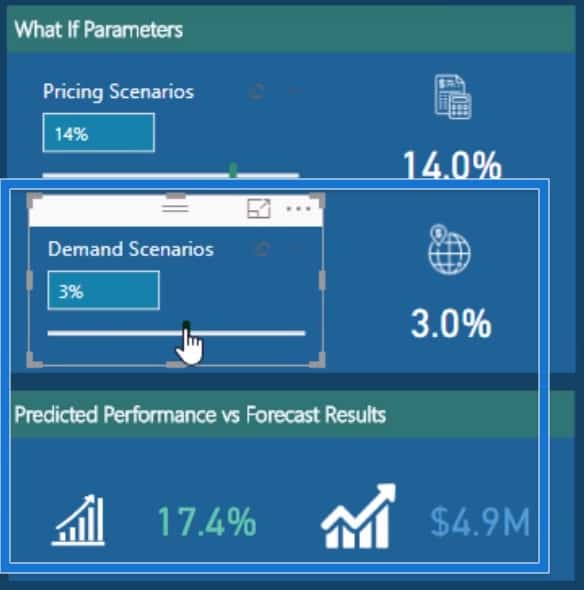
Let’s try to construct a sample of a best-case scenario by adjusting the parameters. We’ll do this by setting the Demand to a higher percentage like 3%, then save it.

You can also adjust the parameter to construct a worst-case scenario by resetting your parameters into a lower percentage value.

Then, you can bookmark the scenario so you’ll be able to easily check on it whenever you need to.
And those are some of the many ways on how you can generate interesting stories with the What If Parameters.
***** Related Links *****
Running Sensitivity Analysis For Power BI Using DAX
Multiple What If Parameters In Power BI
Power BI ‘What-If’ Parameter Feature
Conclusion
To conclude, you can almost predict things that might have happened or will happen in the future by properly using this What If Parameter.
Take it from me, if you can combine all of these things, this is some of the most powerful analysis that you can do inside Power BI.
Above all, it can easily give you the ability to dynamically transform your data. That is to say, it can help you demonstrate how your data can change under various scenarios.
Being able to complete this type of analysis at scale within Power BI is certainly indispensable. I highly recommend diving into how you can utilize not just this feature, but also those other techniques that go around implementing What If Parameters inside your analysis.
All the best!
Sam


