In this Power BI Showcase, we focus on reports that provide analysis on retail management, specifically, individual store sales and demands. You may watch the full video of this tutorial at the bottom of this blog.
The key indicators or metrics presented in these reports are great sources of analysis that help improve the overall performance of a business’ retail chain.
This showcase is divided into four reports.
Store Summary
The first report provides a summary of the data on the company’s retail stores.
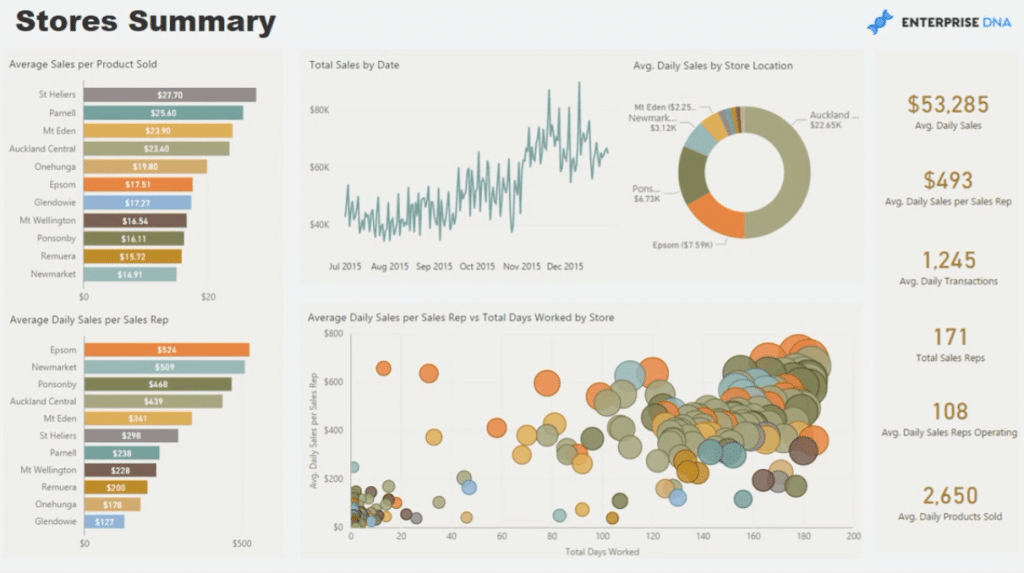
This is a quick dashboard with all the key metrics, such as Average Sales. We can also look at the data through time and per region. Furthermore, there’s data on how our sales representatives are performing.
The great thing about this report is how the sales data can be updated in real-time.
Store Performance
The next report focuses on the sales returns per store.
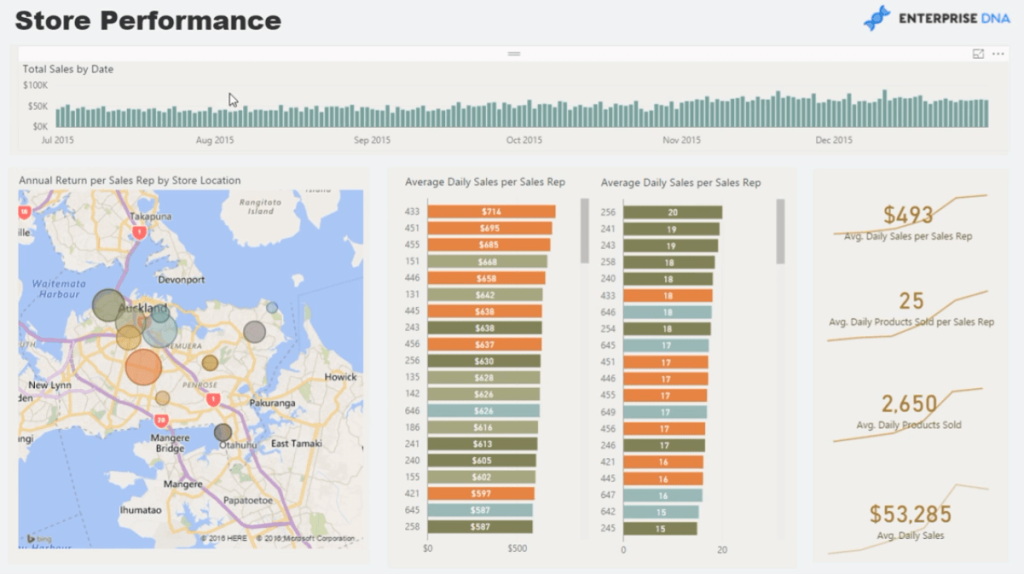
We can see the sales return per day and identify sales representatives who are performing well.
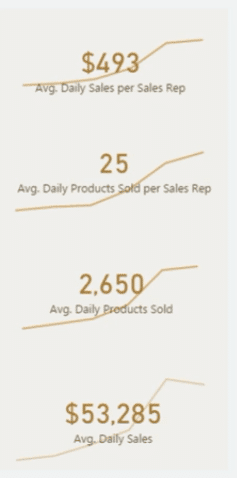
The charts shown on the right-hand side of the report show a summary of the key metrics and how they change through time.
Store Traffic
The third report in this showcase presents data on store traffic based on the transactions of the products being sold.
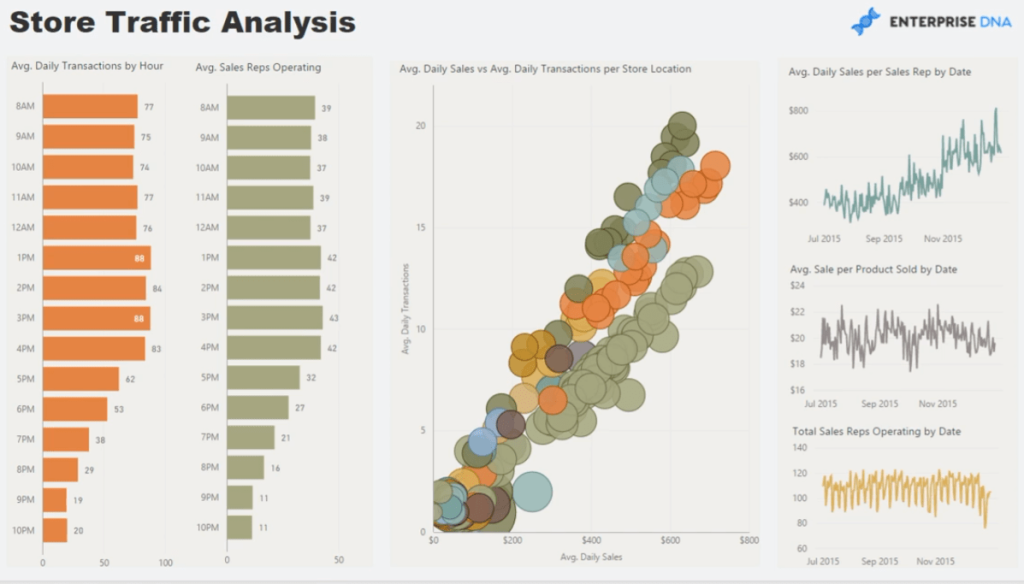
With this, we can premeditate the fast-moving products for specific time periods per store based on historical analysis.
We can see the number of transactions occurring per day and how this complements the data of the sales representatives working within those hours.
By clicking on a specific hour, we can see the updated version of the charts in the report.
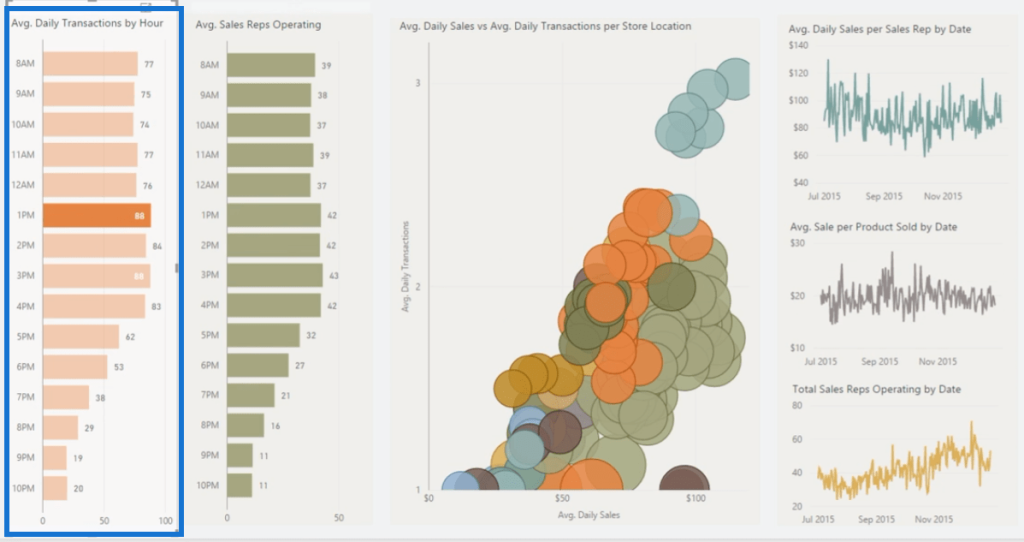
We can then see the trends in our store traffic and understand the reason behind store clusters.
In this example, we’re able to understand that the bulk of our Sales occurs in the afternoon or during lunchtime.
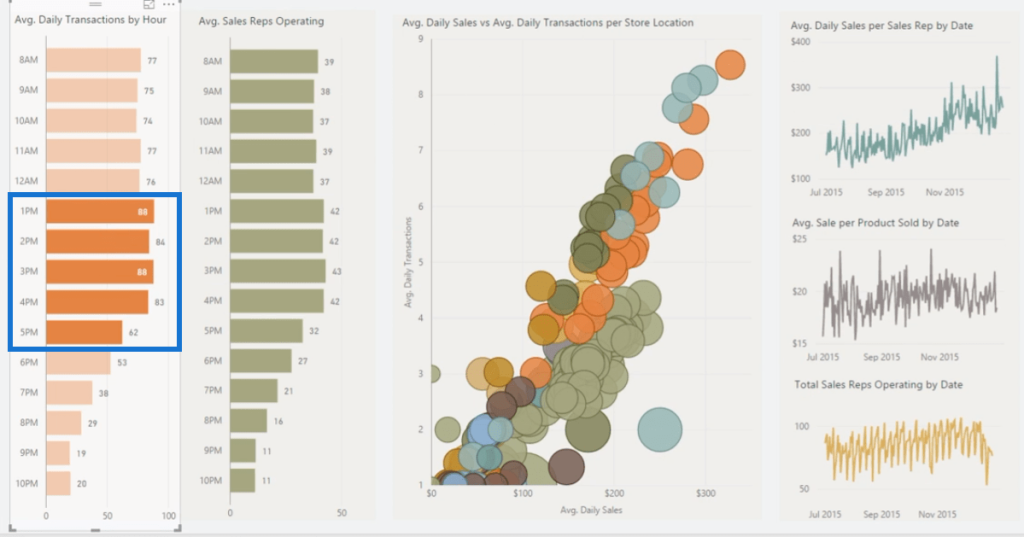
This information can then be compared to the performance of the sales representatives present during that time period.
It can be clearly seen that there’s a correlation between store traffic and the number of active sales representatives. With this information, we can then implement improvements to boost the company’s Sales.
Daily Demand Forecasting
The last report in this showcase drills into daily demand.
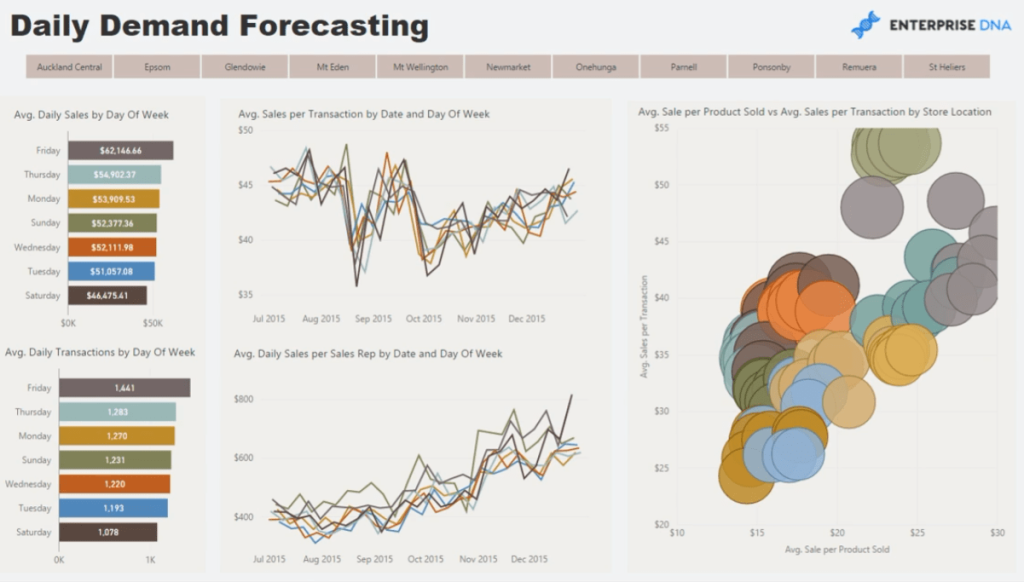
In this example, Fridays have the highest daily Sales for the week. We can also look at this data using the per store filters.
***** Related Links *****
Discover Multiple Product Purchases Using DAX In Power BI
New Vs Existing Customers – Advanced Analytics In Power BI
Automatically Find Your Top 3 Salespeople Per Region Using DAX In Power BI
Conclusion
The reports presented in this Power BI Showcase provide great insights on effective retail management, such as how we can position our business to maximize staff and increase sales.
We can easily anticipate when and where sales are going to happen and how we’ll get the most value out of our stores.
All the best,
Sam


