Not everyone’s year runs over the calendar dates or the calendar year. It’s very likely that you will want to showcase your reports by financial year in Power BI instead. You may watch the full video of this tutorial at the bottom of this blog.
For instance, your financial year might start in July or in April. Not only that, your quarters will also be in a different order too because Quarter 1 might not be January to March but July to September.
So you need to somehow figure out how to sort your date table to manage this.
You may think that you require a new date table to do this, but you actually don’t.
You can use exactly the same date table and just include a column that allows you to sort date dimensions by financial year rather than the standard calendar one.
In this post, you will learn how to sort your dates by financial year in Power BI.
Sorting By Calendar Date
There are different ways to sort dates from your date table. They can be sorted alphabetically or by calendar year or even by financial year as already mentioned.
Before we proceed to sording the dates by financial year, let us first take a look at how to sort a column by calendar year if it has been sorted aplhabetically like this one below.
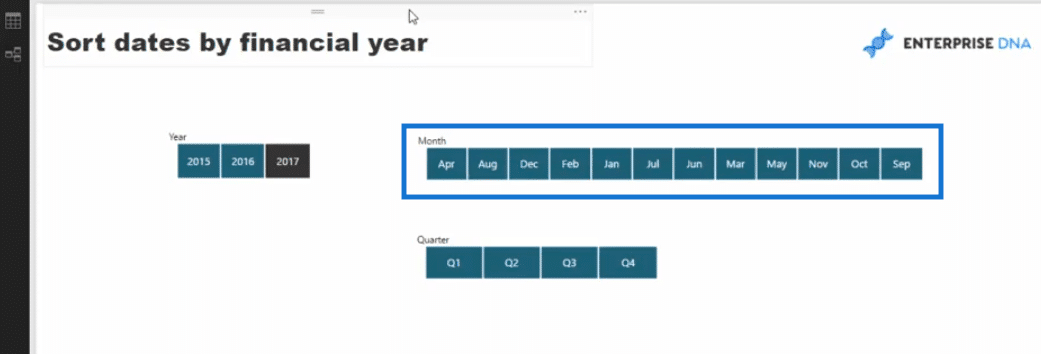
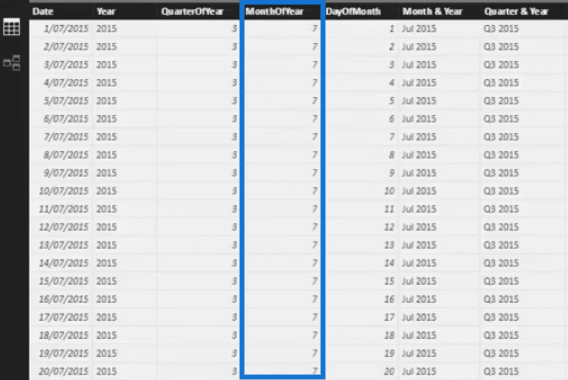
Let us go and check what we have in our date table.
You can see that we have a MonthOfYear column which has the number of the month for each row. In this case, the number is seven which represents July.
If we go down further, you would see the other months such as August which is number eight, September which is number nine, and so on.
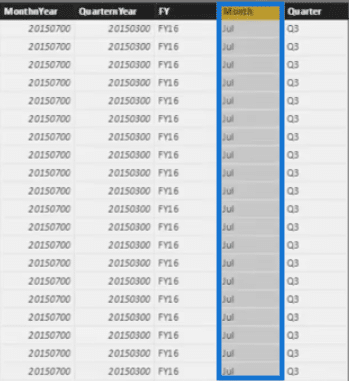
We also have a Month column which contains the actual months.
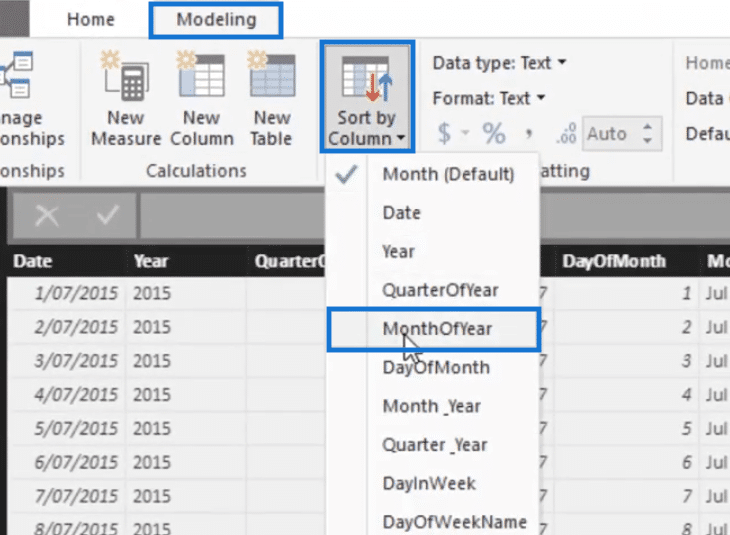
What we want to do is to sort our Month column by the MonthOfYear. So, we need to go to our modeling tab, click Sort by Column and then select MonthOfYear.
You’ll see now that we have already sorted the months by calendar year.

Now, let’s move on to actually sorting the dates by financial year.
Sorting By Financial Year In Power BI
To sort our dates by financial year, we need to create a column similar to the MonthOfYear that will sort the order of our months.
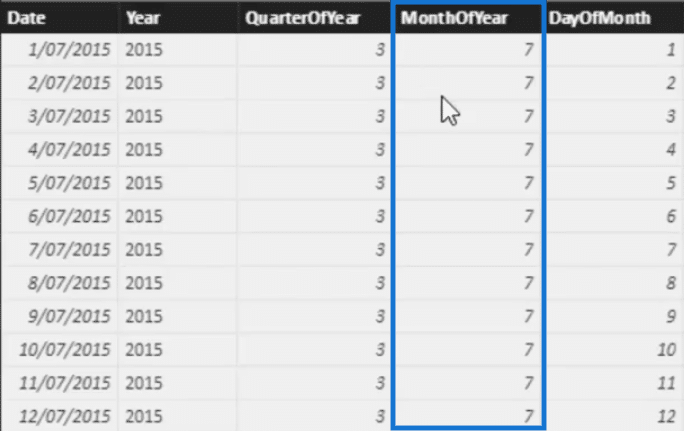
To do this, let us go back to our modeling tab and then click new column. This will allow us to create a logic that will make July the first month of our financial year.
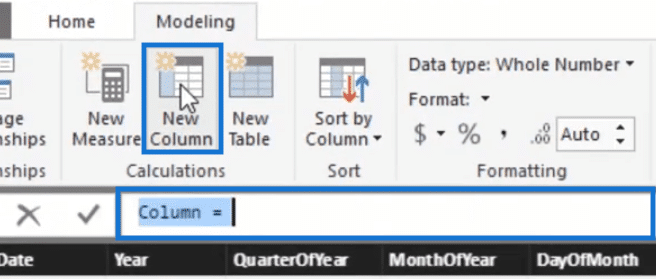
Let us call this FinancialYrSort. Then our statement will be if the month of the date is greater than six, make it to equal to the month of the date minus 6, and then if it is six or less, make it to equal the month of the date, plus six.
The formula will then be like this one below.

Note that we’re using six in our formula because we want to start our financial year in July which is the seventh month in the calendar year.
If in case we want it to start in April or October, we would need to change that number to correspond to either of those months so that the logic would be correct.
Now, take a look at this table below. You’ll see here that each row in the MonthOfYear that shows seven corresponds to one in the FinancialYrSort column.

If we go down this table further, of course you’ll see other months and each month now corresponds to its new number based on the FinancialYrSort.
So August will be number 2, September will be number 3, and so on.
Then, to actually sort the months by financial year, we’ll go to the modeling tab and click on FinancialYrSort.
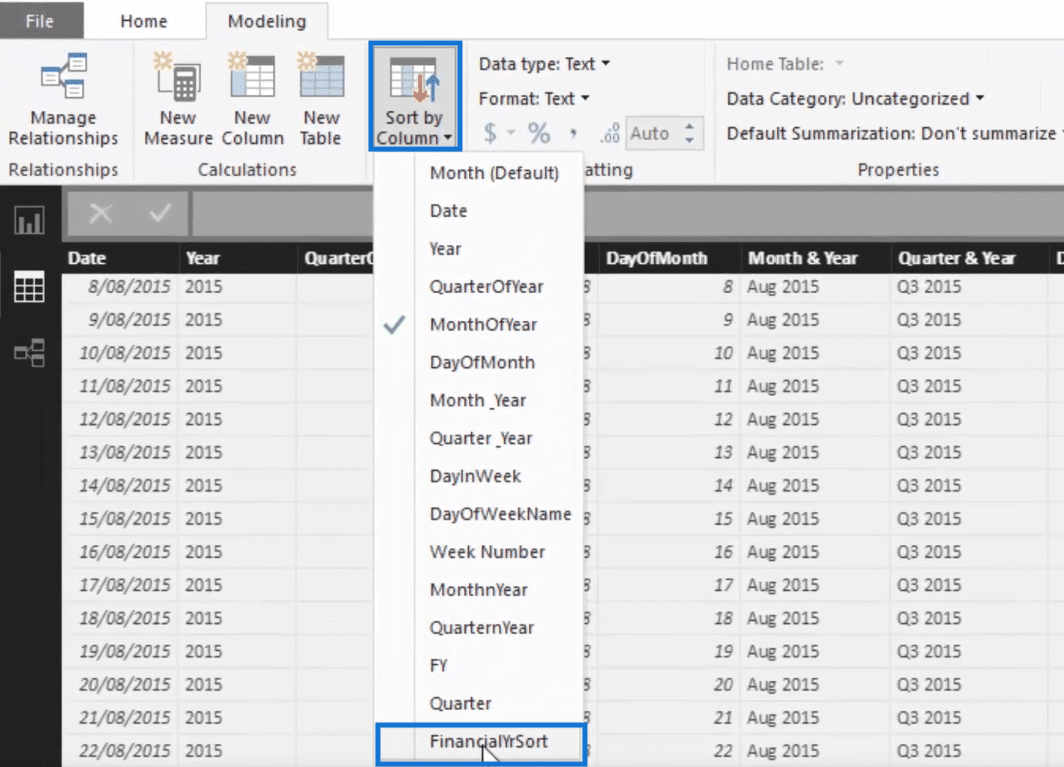
This will now sort our months by financial year. So you see that our first month now is July then followed by August, September, and so on.

Now, we’re able to fix the order of our months.
Sorting The Quarters
Looking back at our canvass, however, you’ll notice that our quarters are still sorted by calendar date.
Since our months are arranged by financial year, of course, our quarters should be sorted accordingly as well.

If we go back to our date table, you will see that we have a QuarterOfYear column and a Quarter column.

Again, we need to add some logic so that if a quarter is three we will make it equal to one, for instance.
So let’s create a new column and call it QuartersSort.
Let us add a statement such that “If the quarter of year is greater than two, then I want the number to be the QuarterOfYear minus two, and if it’s not then I want it to equal QuarterOfYear plus two.”
The formula will then look like this one below.

After entering the formula, we’re going to select this Quarter column.
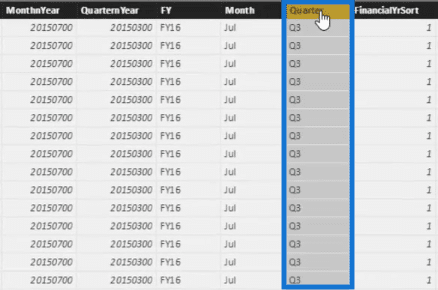
We will then click Sort by Column and select QuartersSort.
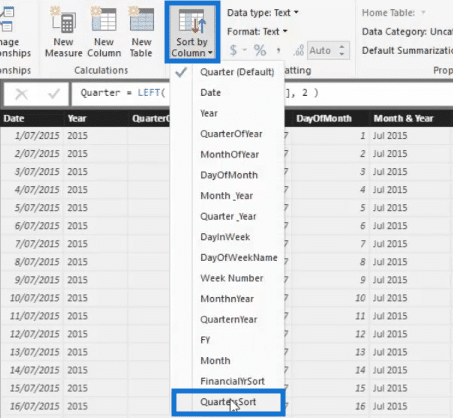
You’ll see now that our first quarter here is Quarter 3 which is the correct one because July falls under the third quarter.

***** Related Links *****
How To Create Unique Financial Year Quarters In Power BI
Filter Your Data By Unique Financial Years & Quarters – Power BI Modeling Technique
Calculate Financial Year To Date (FYTD) Sales In Power BI using DAX
Conclusion
In this post, we have covered the different ways that we can sort our dates. We can arrange them alphabetically, by calendar date, or by financial year.
To sort the months and quarters by financial year, we simply created a column using some logic instead of creating a new date table.
So definitely try using this technique in your reports.
You might actually discover other ways where you can apply this technique such as in creating custom calendars where your weeks and months are aligned differently from the standard calendar year.
I hope you enjoyed reading this post!
Cheers,
Sam


