In this article, we will explore how we can use the TOPN function in Power BI. You will really enjoy seeing the immense amount of ways that you can utilize this function. You may watch the full video of this tutorial at the bottom of this blog.
TOPN is such a powerful function and there are so many little nuances in how it operates in different contexts.
I’m going to walk through some examples and you’ll see how I’ve applied TOPN to these very unique calculations or the insights that I want to showcase.
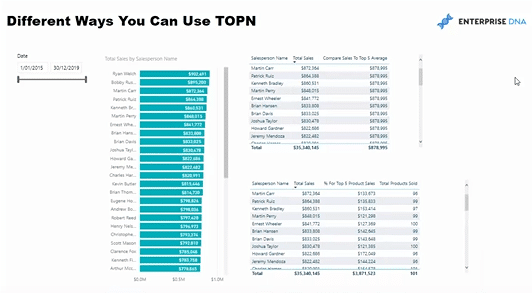
I’ve got a setup here where I am trying to analyze the sales people.
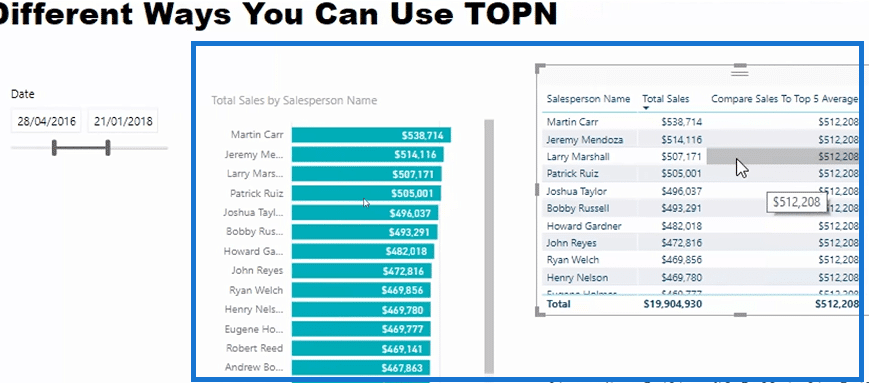
We’ve got our salespeople in the table, and the chart below is representing the Salesperson Name and the Total Sales columns. So it shows the revenue generated over the particular time period.
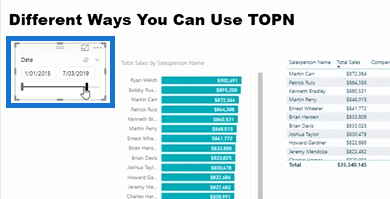
We can also change the timeframe that we analyze our customers on.
Using TOPN To Compare Sales Versus Top 5 Sales Average
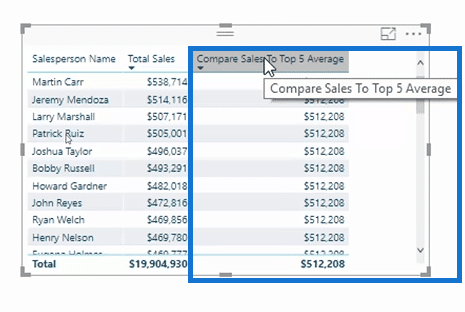
We’re trying to compare the sales per salesperson to the average of our top 5. This example is a perfect insight for using the TOPN function.
TOPN enables us to manipulate a virtual table based on a ranking and then run a calculation based on that virtual table.
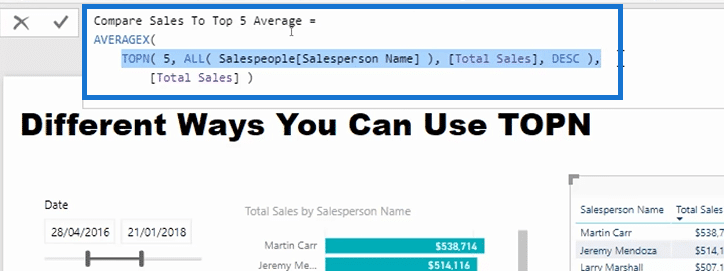
You can use TOPN in a couple of ways, but in this particular case, I am placing the TOPN virtual table inside of an iterating function.
So within each individual result, I want to create and shape a virtual table that I want to iterate through. And then I want to produce a result based on that.
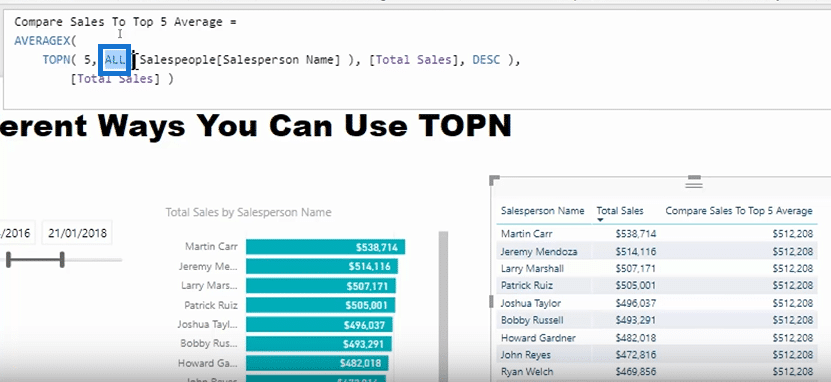
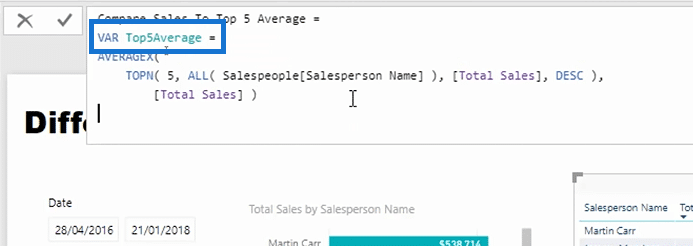
If we want to analyze the top five salespeople within our context, we need to utilize the ALL function within TOPN to remove any context from the Salesperson Name. We are expanding a virtual table of all of our salespeople here.
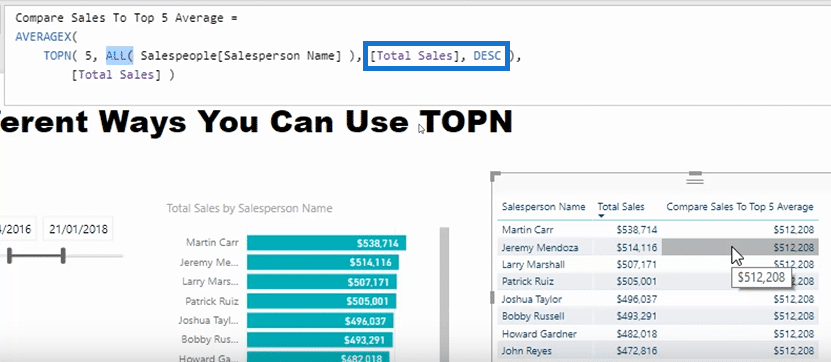
Then we are running a ranking and only leaving the top five because we’re using Descending (DESC) here and Total Sales.
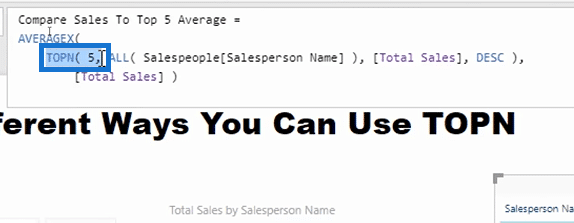
Basically, TOPN is iterating through every single salesperson, but we are only returning the top five.
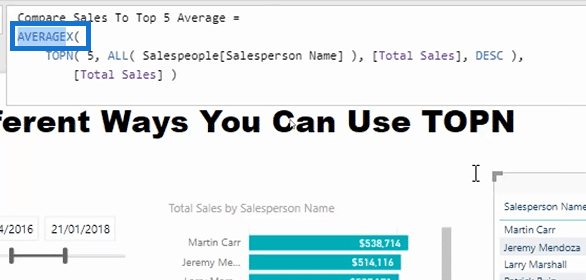
So this particular iteration, AVERAGEX, is only iterating over five salespeople at every single row.
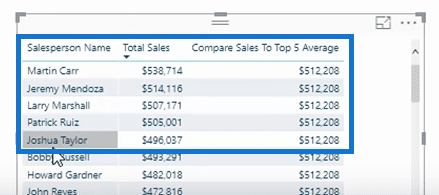
And theoretically, those top five salespeople would be the following:
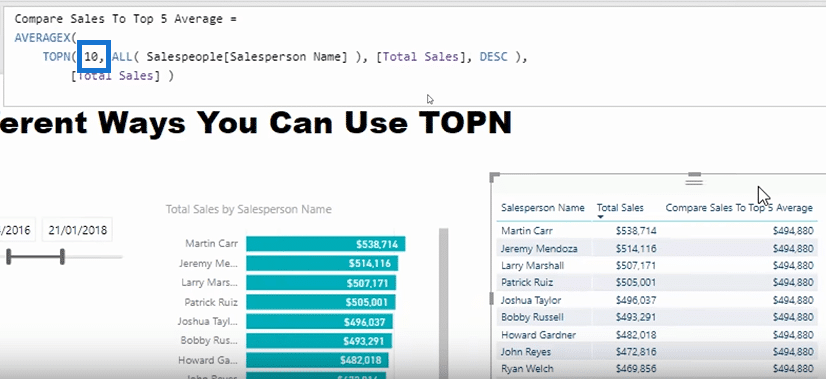
You can manipulate this expression quite a bit. We can do the top 10 by just changing the number to 10, and then we would be getting the average of the top 10.
Comparing Sales To The Top Five And Converting Results Into Percentage
For this scenario, we want to compare sales to our top five and we want to see a percentage. To get this result, we can do the following steps:
- For this scenario, we will be utilizing variable, which is the Top5Average in this case.
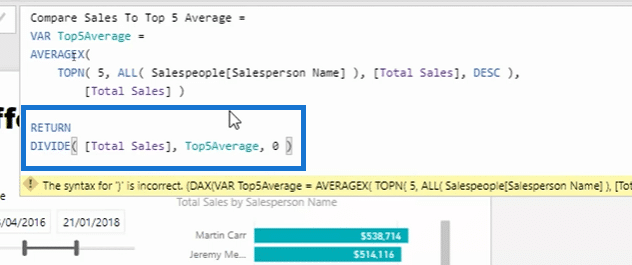
- Put in RETURN, and then DIVIDE the Total Sales by the Top 5 Average, and use “0” as the alternative result.
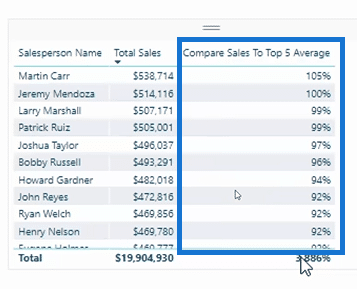
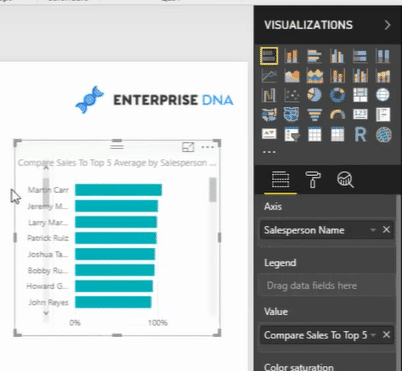
- Format the Compare Sales to Top 5 Average values into a percentage.
- We will get this result:
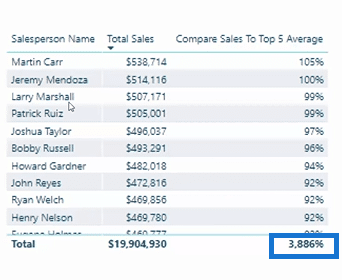
- Optional: Remove the total percentage since it would be meaningless there.
- Optional: Use the results for visualization.
Using TOPN In Getting The Percentage Of The Top 5 Products Sold
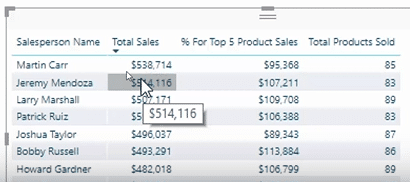
This example is another relatively nuance way to use TOPN. In this particular case, I want to see the percentage of the top five products that the salespeople sell.
So based on all the sales they’re making, let’s break out the top five products they sell and what is the corresponding percentage of that.
We will be able to identify if a salesperson is really focusing on particular set of products or if they’re favoring a particular set of products versus other salesperson who might be too widespread.
This could really introduce some great conversations if you want to really nail down into how people are actually selling your products.
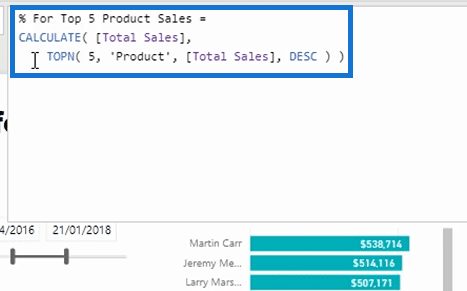
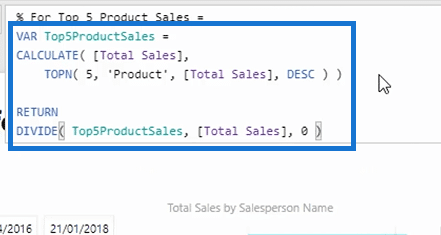
We can use TOPN here as an additional context in the CALCULATE function. The virtual table is evaluating over every single product that every sales person have sold.
This would work out what the total sales of that product was, and then only returning the top five because we’re using Descending (DESC) and we placed “5” in the expression.
Interestingly, we do not need to use an ALL function in this scenario. This is because the current context of the calculation is salesperson so there is no impact on products.
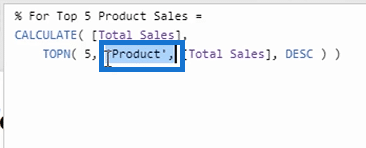
This virtual table has created every single row in this particular table, and then the sales of the top five products are returned.

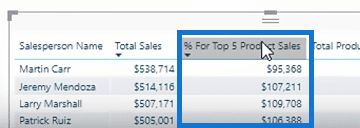
Deriving The Top 5 Product Sales
You can follow the step-by-step process below to get the top 5 product sales:
- Use the variable Top5Product Sales and follow this formula:
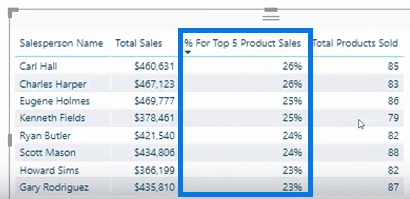
- Update the values of “%” for Top 5 Product Sales into percentage.
- Now we have the percentages and then we can sort our table based on those percentages.
We can now see why there is a huge divergence between the salespeople. Is it regional? Is it manager-focused? There’s a lot of great things that you can derive from this.
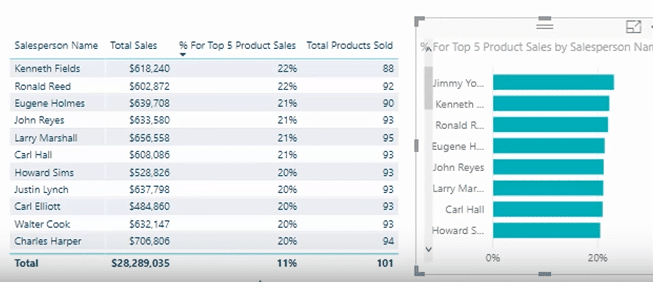
Creating a visualization out of the results is also a great idea to see where the divergence is occurring.
***** Related Links*****
RANKX Considerations – Power BI & DAX Formula Concepts
Find Your Top Customers Through Time Using RANKX in Power BI w/DAX
Create Dynamic Visuals Based On Ranking in Power BI w/DAX
Conclusion
There’s so many different ways to manipulate TOPN so you can find these really unique and interesting insights that involve some sort of ranking.
Also,you can evaluate how these things change through time as well. There’s nothing stopping you from incorporating time intelligence calculations or time comparison calculations on top of these new calculations that you have created with TOPN.
If you enjoyed learning about TOPN, you can browse through these links to get more information on this topic:
When To Use TOPN In Power BI – DAX Formula Review
When & How to Use TOPN in Power BI – DAX Function Tutorial
Discover Unique Insights Using TOPN in Power BI
Enjoy working through this one.
Sam
[youtube https://www.youtube.com/watch?v=hEUbzIcCp5w&w=784&h=441]


