I’m going to cover some great functions here in Power BI that are very useful across a variety of analytic scenarios. Some of these functions can help us work out the last three customer sales. You may watch the full video of this tutorial at the bottom of this blog.
What I want to show you is how to work out the sales from a specific customer, but by only looking at the last three sales rather than all of their sales.
In order to do this in a dynamic way inside the formulas, I need to structure them so that the filtering naturally occurs for every single context that the formula is applied to.
This is where it can get a little more advanced inside Power BI. I had to start utilizing functions which create filtered virtual tables to generate the results that I need. Thus, I need to work out how to create a filtered table of only the last number of sales, which in this case was three.
Sample Report Showing The Last Three Customer Sales
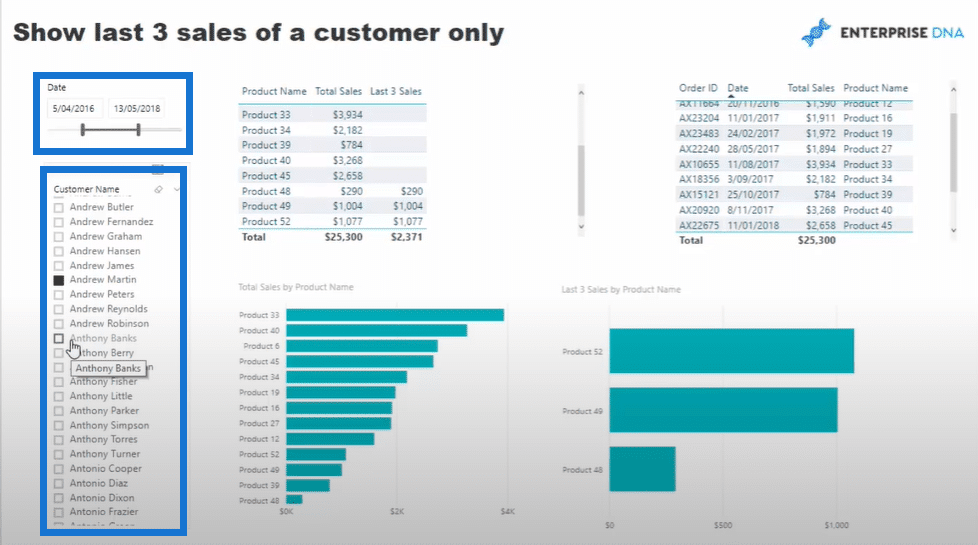
In this sample report, you’ll find interesting insights about how to structure tables or table functions inside Power BI. I’ll be showing the last three sales of a customer and showing it by product using a chart.
First, you can adjust the time frame here in the date selector. Secondly, I have added a customer selector here where you can select any customers or group of customers.

After that, I want to evaluate their last three product purchases and find out how much those product sales are.

The goal for this tutorial is to dynamically work out the last three products that the selected customers purchased. Somehow, I need to rank the sales by purchase date and figure out the last three products. Furthermore, I also want to calculate the total sales for all these last three purchases.
Calculating The Last Three Customer Sales
Let’s look at the formula for computing the last three sales of the customers.

I need to work out what were the last three purchases of the customer by using the TOPN function. It is inside an iterating function so it will go through rows and tables. But instead of going over an actual table, it will iterate through a virtual table determined by some ranking.

Basically, that’s what TOPN does to find the three last sales based on the purchase date. Additionally, the DESC function sorts the results in descending order.

Within any particular context, I’ve created a table of all the purchases that were made using the SUMMARIZE function.

To sum it up, when I select a customer, the formula iterates through every single purchase that the customer has made. Next, it’s going to evaluate the purchase date, and then rank the purchase dates accordingly in descending order. Lastly, the TOPN function returns a virtual table of only the last three purchases.
After figuring out the last three purchases, I’m going to calculate the three rows and count the total sales.

Now, the calculation I made is a bit tricky. I’m gonna show you how this could go wrong especially if you take out the CALCULATETABLE function.

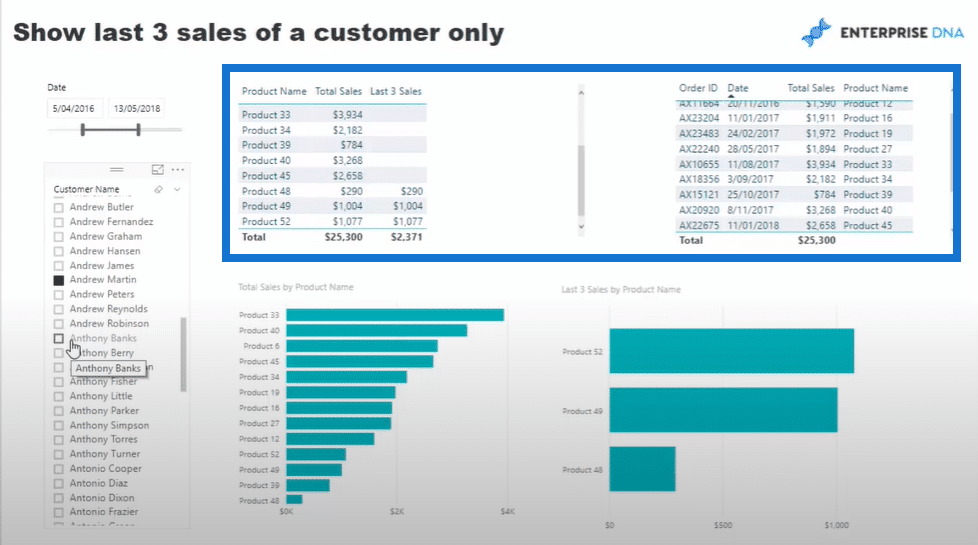
When I drag the Last 3 Sales Wrong formula into the table, you’ll see that I got results for every single row for this particular table.
But you can see in the bottom part, the total for the Last 3 Sales column is correct. But the total under the Last 3 Sales Wrong column is incorrect.

This is where you can test your deep understanding of the context. How do you think the results under Last 3 Sales Wrong are showing up?
A basic explanation is that every single product is filtering a particular result. If a product is selected, the formula is going to find the last three purchases of the product. But all the products are evaluated at the table and it’s going to add them up.
For example, if I select Product 5. You’ll see that it’s always going to rank number one because it’s the only one in the context. It will be evaluated in the table and it’s going to be calculated for total sales.

So in the formula, I need to do wrap the SUMMARIZE function inside CALCULATETABLE so that it’s going to remove the context of the product in the particular results. As a result, it’s going to evaluate through every single product for the selected period. Then, it’s going to rank based on all those sales using TOPN. If it’s not present, it’s going to rank in the top three because there aren’t enough sales for the particular data set.
Moreover, I have put this table on the right for a reason.

I need to evaluate through the entire table versus the filtered table. The table above evaluates the entire table to the correct result. As you can see, it ends with the last three sales from the 22nd of June, 7th of March, and 27th of August in 2017. Then, it counts the particular sales under the Total Sales column.
In the Last 3 Sales By Product Name table, you can see a visualization for the top three products and its corresponding sales.

You can also select any other customers or group of customers and the results will change dynamically.
This is certainly an advanced tutorial. But hopefully you understand how great the insight is when you combine a lot of these DAX formulas. You can quickly see the last three customer sales by product and put it into a visualization.
***** Related Links*****
When Did Your Customers Make Their Last Purchase?
Show Results Up To Current Date Or A Specific Date In Power BI
Counting Customers Over Time Using DISTINCTCOUNT
Conclusion
As you can see in the formula, there are a lot of functions within a function. These are functions like TOPN, CALCULATETABLE, and SUMMARIZE.
What I’ve done is I’ve combined all of these functions into one formula. I’ve combined them all to enable us to extract this great insight.
This is why DAX formulas are immensely powerful. If you understand these functions, you can put all these together and get amazing results. Historically, it wasn’t possible by using such tools like Excel. But being able to combine all these together using Power BI and create incredible visualizations, you can achieve the desired result.
If you want to learn more about what can be achieved with other techniques just like this one, check out the Business Analytics Series module at Enterprise DNA On-demand.
I hope you enjoy going through this process.
Sam


