
I’d like to share with you a development strategy or concept in Power BI called measure branching. You may watch the full video of this tutorial at the bottom of this blog.
This is one of my favorite topics in Power BI especially around DAX formula. I personally use this technique and you’ll see me apply it often in many of my tutorials. It’s how I build high quality and intuitive Power BI models.
Measure branching is really key to getting really advanced in Power BI.
This tutorial is from a training workshop that I did in Enterprise DNA, which was about discovering advanced insights in Power BI. It’s through Power BI strategy, measure branching that we can discover these advanced insights really fast.

We’ll look through the report and I’ll show you how I derived some of the calculations that I created.
What is Measure Branching?
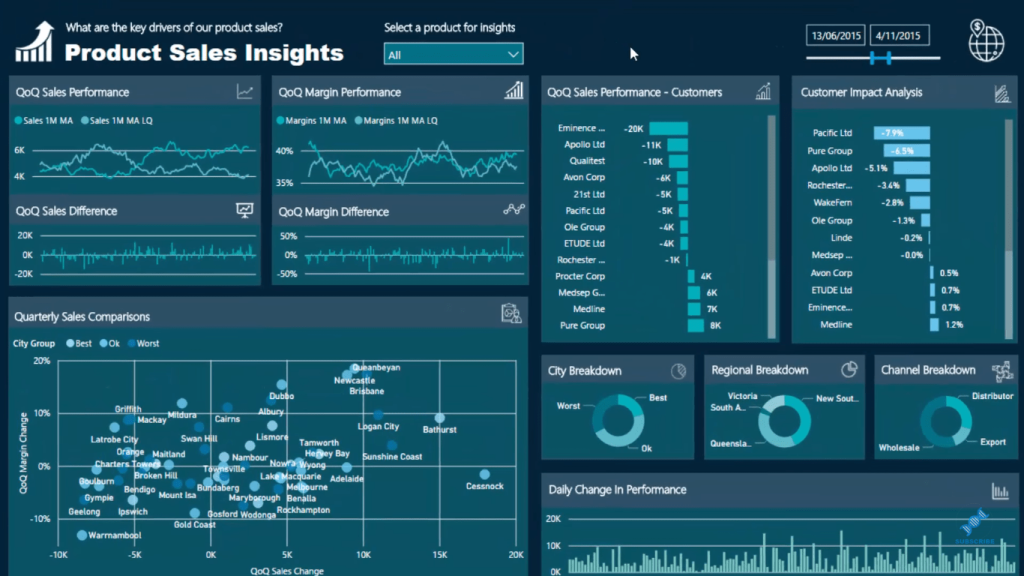
In this report, I have QoQ (quarter on quarter) Sales Performance. But then from that I derived a moving average or trending analysis based on QoQ Sales Performance.
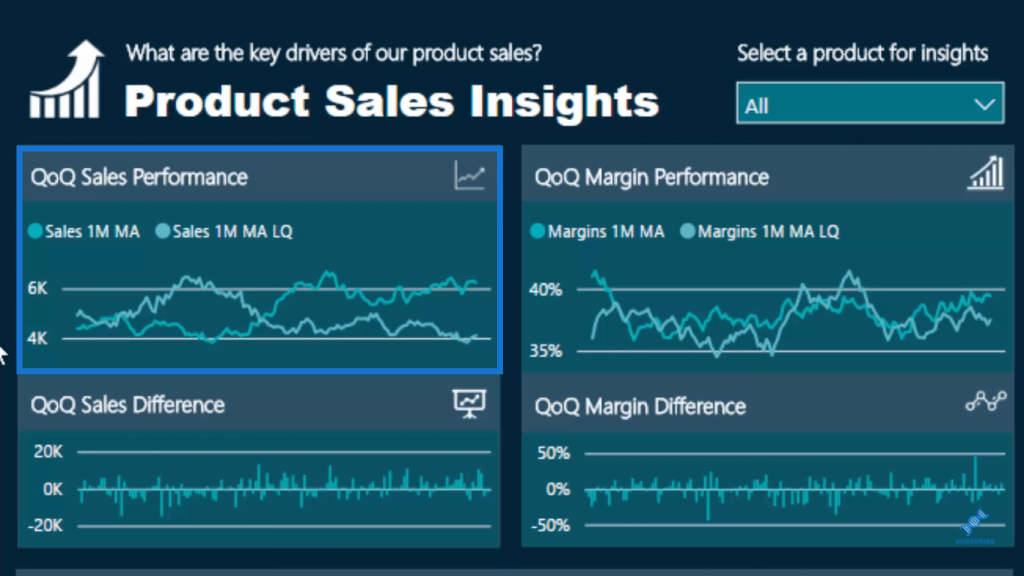
I didn’t just look at quarter-on-quarter sales, but I also looked at the moving averages of sales versus the previous quarter. This enabled me to look at the trends a lot easier.
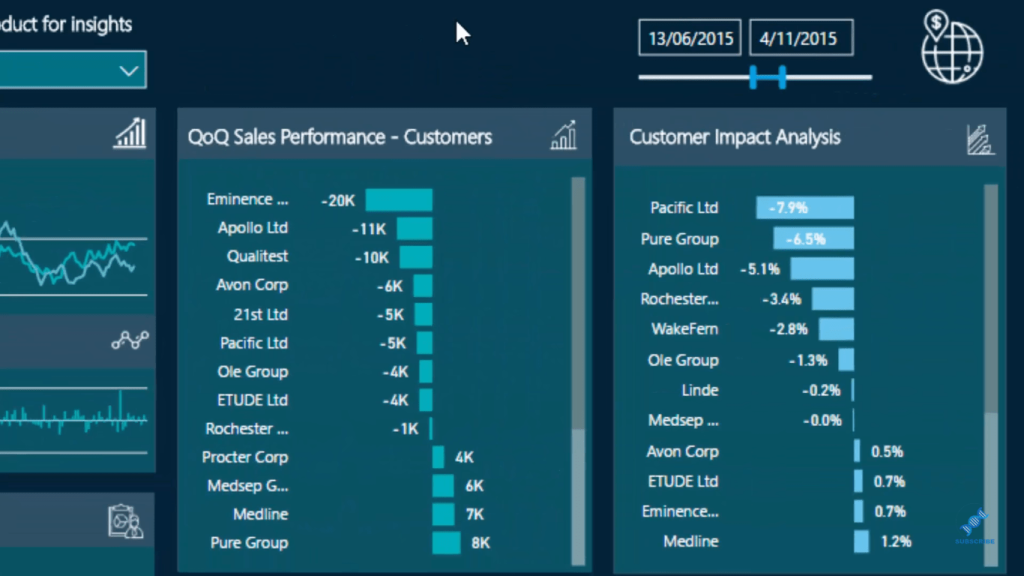
Then from that I even derived QoQ Sales Difference. I also did the same for margins and for customers across sales performance and marginal performance as well. This is what measure branching is.
Nothing is really simple here. We’re actually getting to a much deeper level of analysis when we utilize measure branching. In this example, I’ll show you just an overview of how I set up my models to incorporate this strategy.
Incorporating Measure Branching Into Your Model
The way I replicate these branches in my models is I create measure groups or measure tables. If we look here on the right hand side, I have my Key Measures, which are all the core calculations. Think about them as the “trunk” of a tree.


Then you can see I have branches off my core measures. I have my Time Comparison branch or measures in this table, my Moving Averages branch, and my Cumulative Totals branch.

We can have many different measures inside these branches. We can go even deeper and get multiple layers of branches as well.
This is how I set it up my models and I find this very beneficial from a structuring perspective. I can easily reference certain measures, drag them into my reports, and then create my visualizations. This is how I can create more advanced visualizations, have a much better understanding of what’s being overlaid on my model, and ultimately get some really great insights.
Core Calculations And Measure Branching
I always start with core calculations because simple DAX is the beginning of anything advanced, any branch, or layers of measure branching. In this case, I have a very generic Total Sales.

But from this core measure, we can derive so many different things. We can branch out into time comparisons, for example. If we look at all these formulas, we can see they have Total Sales.


If we look at the Moving Average branch, Total Sales appears in there as well.

The core calculation, which is Total Sales, branches out in all these different measures.
However, this is just the first layer of the branch and we can even branch out further from here. We can jump into another layer, where we reference the core measure Total Sales as well as the first layer of branch – Sales LQ (last quarter).

So, you see here that there’s no reference at all back to the core table. It’s only referencing measures. When we structure our models like this, things can become relatively intuitive.
How Measure Branching Works In Power BI
Power BI is so smart; it understands what sits underneath all of these branches of measures. There are no columns of the data reflected in the branched out measures but Power BI remembers what’s sitting underneath them.
In other words, in this particular measure for example, it will remember Total Sales and reference that particular column in the Sales table and look at Sales LQ as well.

We can just keep going layer upon layer, depending on the analysis that we’re doing. We don’t need to write complex formulas to get great insights.
***** Related Links *****
Use Power BI Measure Branching To Check If Your Margins Expand As Revenue Grows
Forecasting In Power BI: Compare Performance vs Forecasts Cumulatively w/DAX
Advanced DAX For Power BI: Implementing Ranking Logic Across Unique Insights
Conclusion
This Power BI strategy or technique simplifies things a lot especially the formulas. As you can see in this tutorial, none of the formulas are complex or overly difficult. It’s all about overlaying simple patterns of formula and putting the correct core calculation or branch of measure inside it.
You only need to start with setting up a simple core measure. After that, you can branch out to more advanced calculations by means of iteration.

Consequently, you’ll come to an important realization. You can actually have multiple branches from this one core calculation that you’ve created. You won’t need to write overwhelming formulas that are difficult to understand.
All the best!
Sam


