
I’m going to show you how to use the offset function in Power BI. It’s one of the most dynamic tools you can use especially in your date tables.
Once you master how to apply it in your time intelligence projects, you can get more in-depth insights that you won’t get using any other approach. You may watch the full video of this tutorial at the bottom of this blog.

Understanding The Mechanics Of The Offset Function
I’ll start off by showing you the mechanics of the offset function.
Offsets show the difference between today’s date and the other dates in your data.
As you can see in my date table below, I focused on Quarter & Year so that I can see actual data movement.
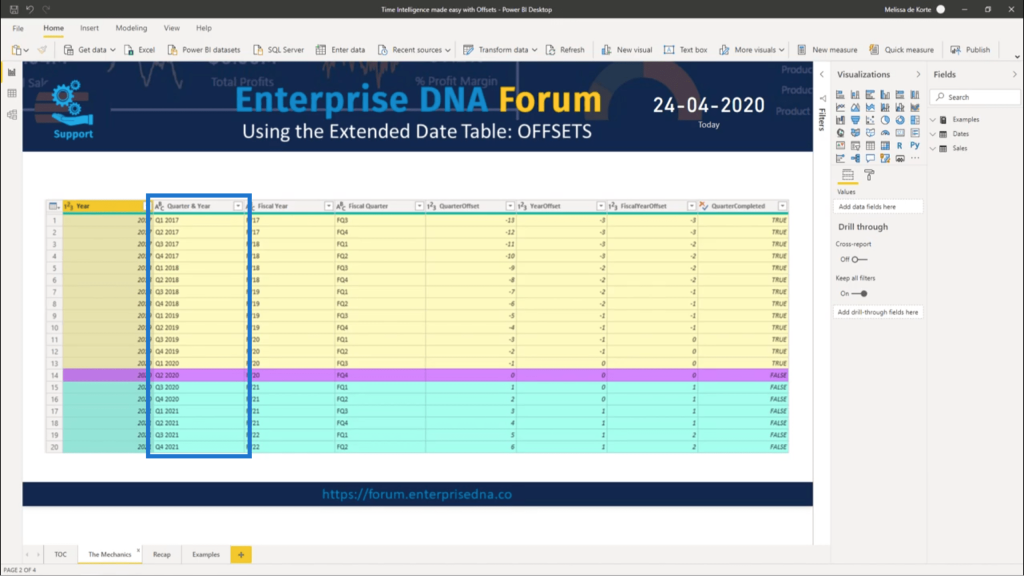
The purple row shows the current period. Note that the current period always has an offset value of 0.
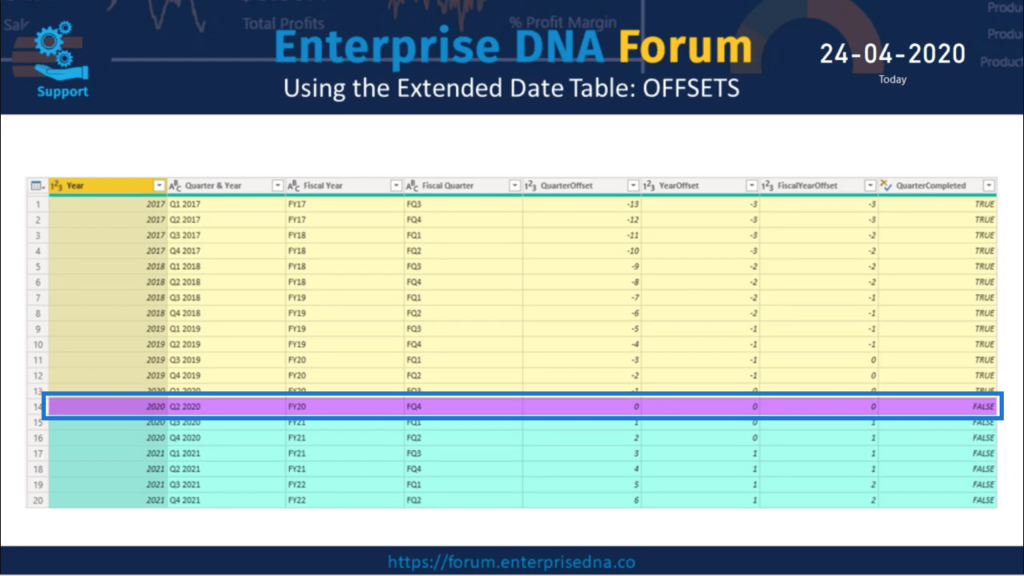
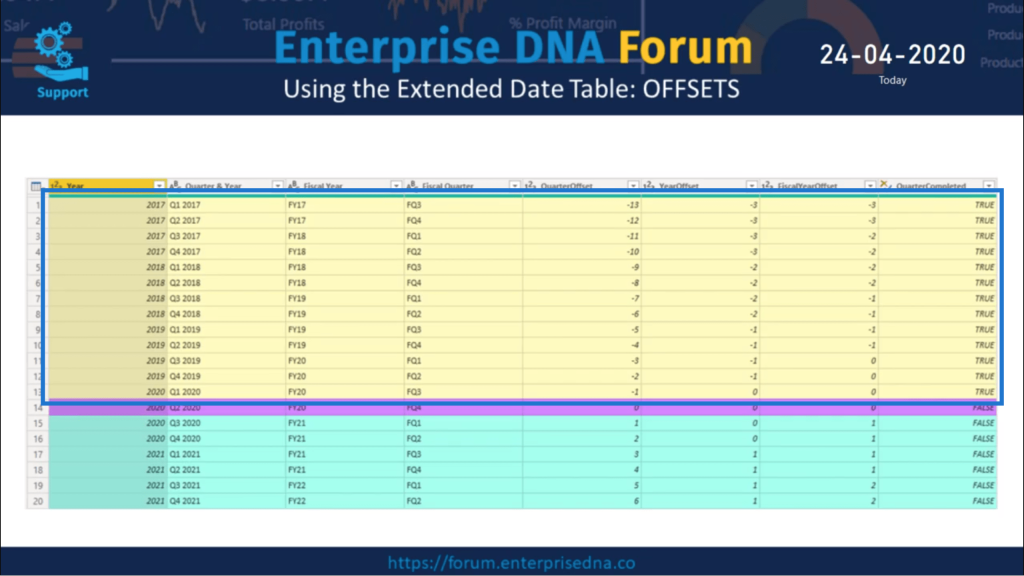
Above that, in yellow, shows all the data coming from the past. You’ll see that the figures here are either 0 or less than 0, represented by the negative data.
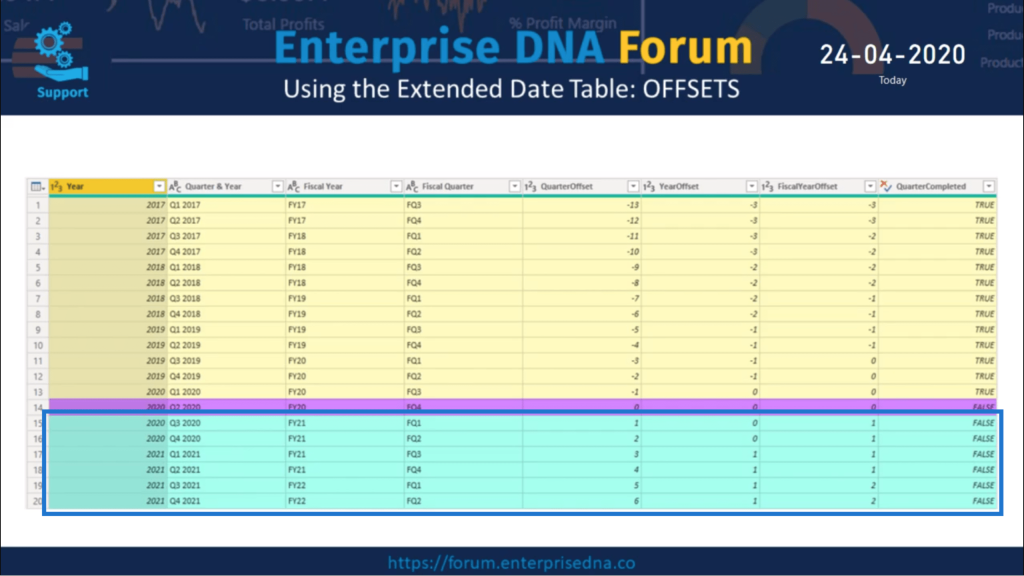
This means that for data from the future, these will show positive values. Depending on the granularity of the column, it may also contain a 0.
So what makes offsets powerful?
Offsets may be sequential numbers representing the difference between different data in the table. But what makes offsets great is that they don’t have boundaries.

For example, quarters will run from 1 to 4, representing the 4 quarters in a year. Months run from 1 to 12 while weeks can run from 1 to 52 or 53, depending on what year it is. But once I reach the last number, I have to start over.
This is not the case for offsets. When it comes to offsets, they will always show a relative position to the current date and the other date being referenced.
So each time the date table is refreshed, the logic that make the offsets work is also updated. This means that an updated value will also be shown in the date table.
Example Of A Week Offset Column
To give you a clearer picture of how the offset function works, I’ll give you an example of how it’s applied.
In my sample data, it shows today’s date as the 24th of April, 2020.

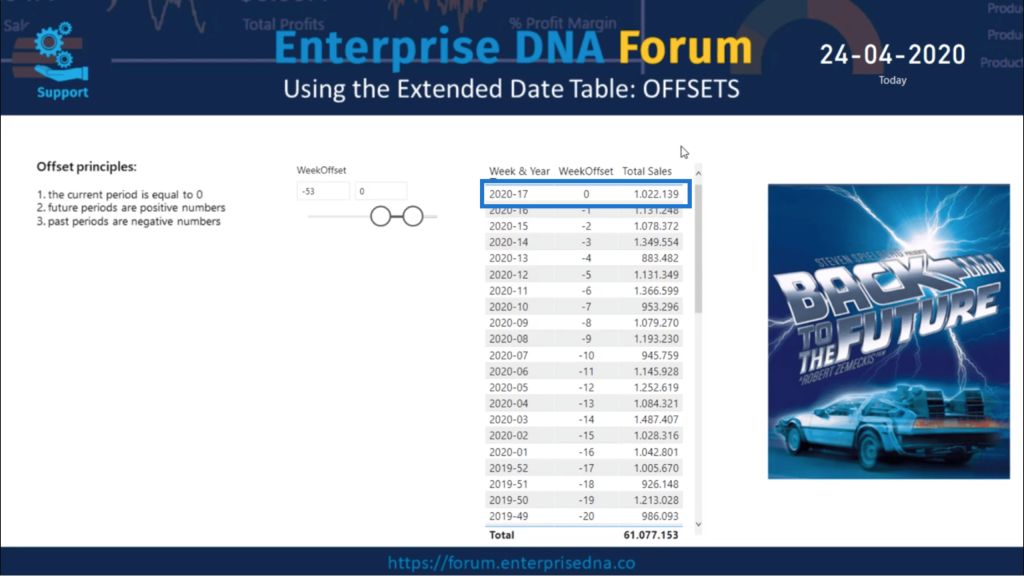
Again, the offset principles state that the current period is represented by 0, future data is represented by positive values and past periods are represented by negative numbers.
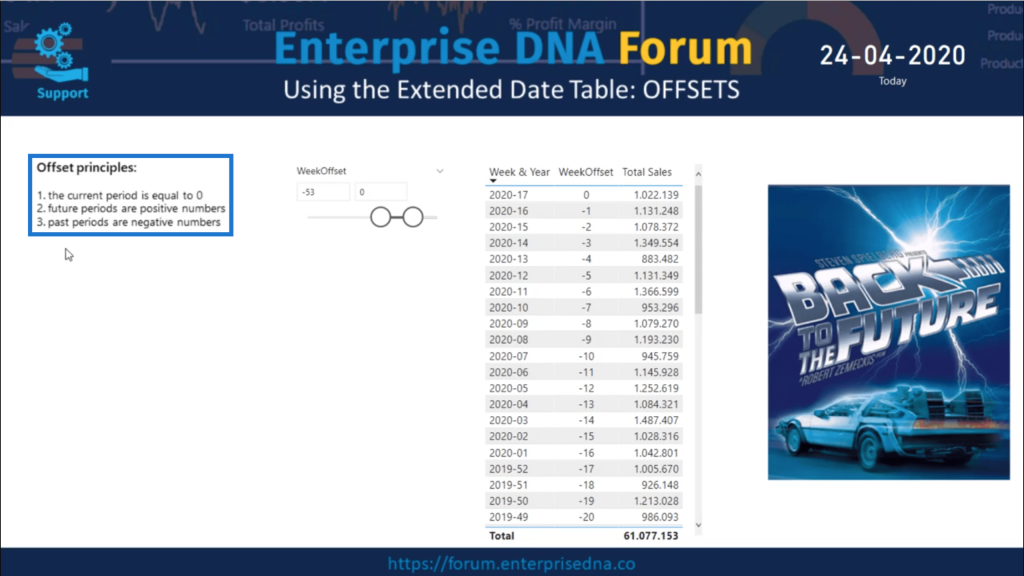
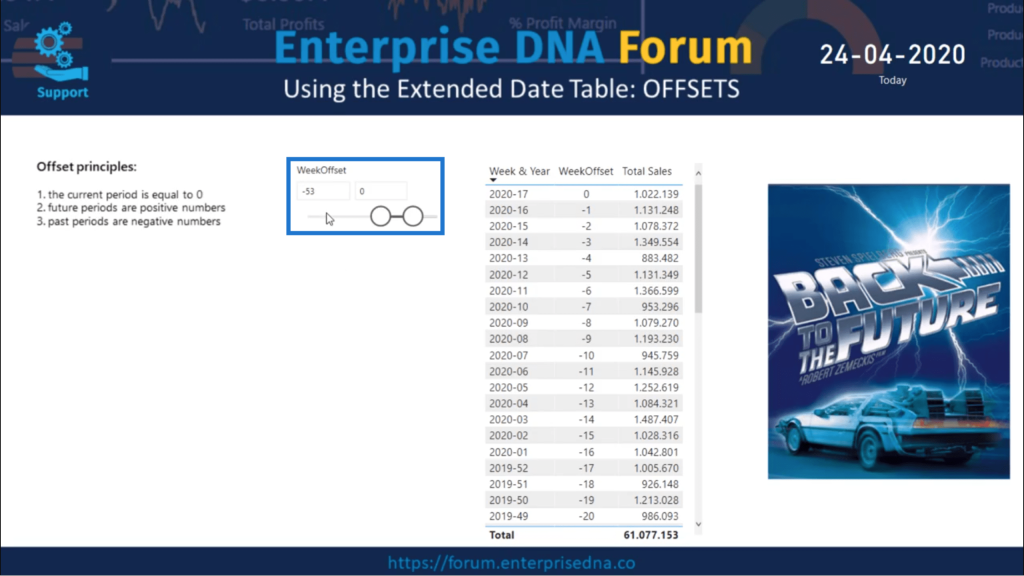
I also have a slicer on my page which contains the WeekOffset value. Currently, it shows all values from -53 to 0, with 0 representing the current week.
April 24th (which is today) falls on week 17.
This extended date table only covers the ISO week numbers. This means that weeks start on a Monday. This also means that a week will always contain 7 days.
But there are a lot of custom week requirements that do not follow the same logic. You can find out more about these cases in various topics covered in the Enterprise DNA Forum.
Also, you could consider using Month & Year instead of Week & Year if that better applies to your situation.
Going back to the sample data, you might have noticed that the WeekOffset values are in a perfect sequential number range.
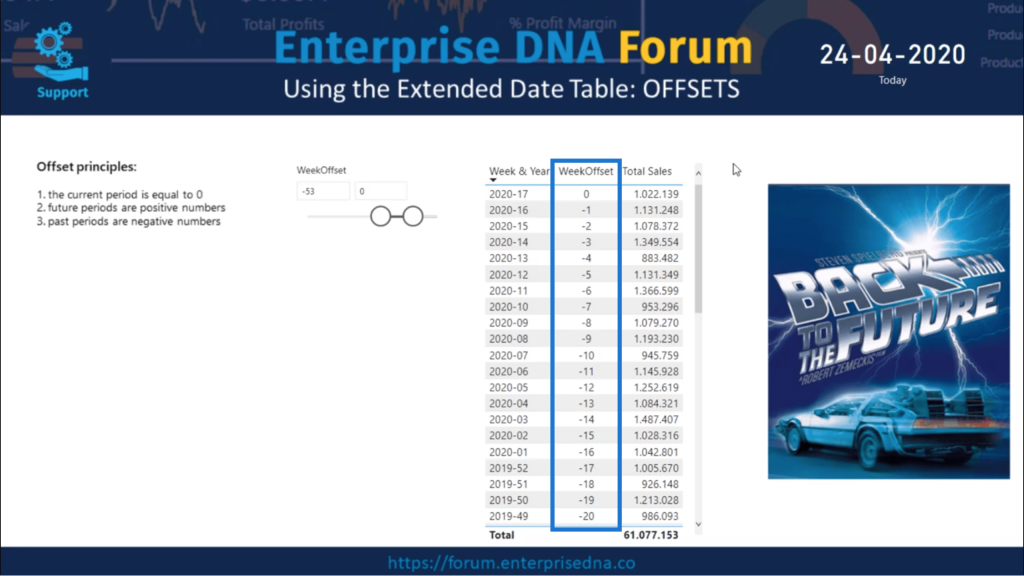
This is because they share the same granularity all throughout. There are no duplicate values and no missing values.
Of course, the Total Sales measure used here is done in the usual way, with just a regular SUMX over Sales for the Quantity times the Price. Then, it all gets aggregated to get a weekly value.
But what if I only want to see the last 4 weeks of sales?

I just have to change my slicer into a range of -3 to 0.

Now, my table only shows those last four weeks of sales.

So as I move through time, my date table gets updated. The same thing happens if new sales results are loaded into the fact table.
Using Offsets In DAX
This time, I’ll show you how the offset function can be used in DAX measures.
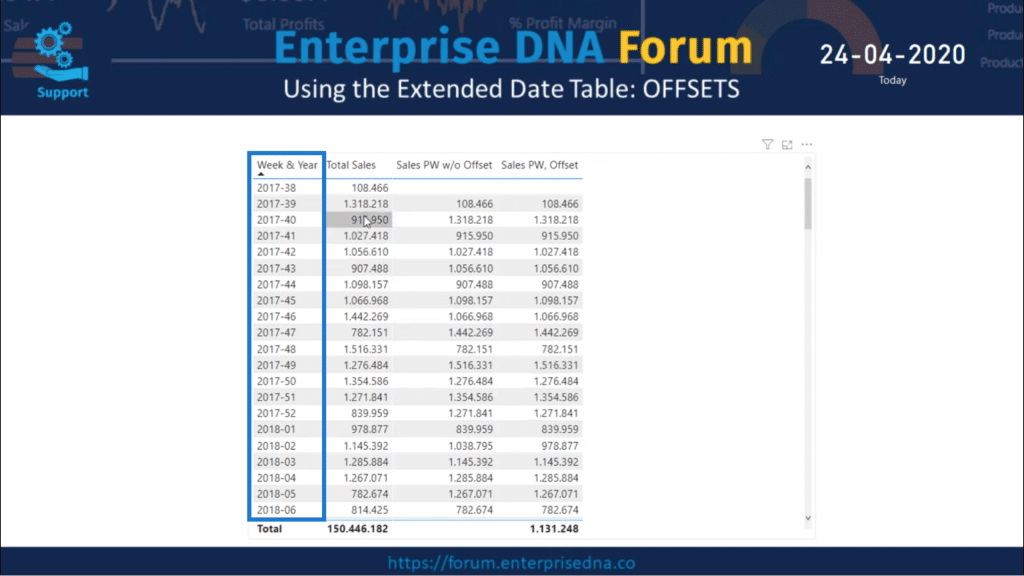
I have a table with the Week & Year and Total Sales.
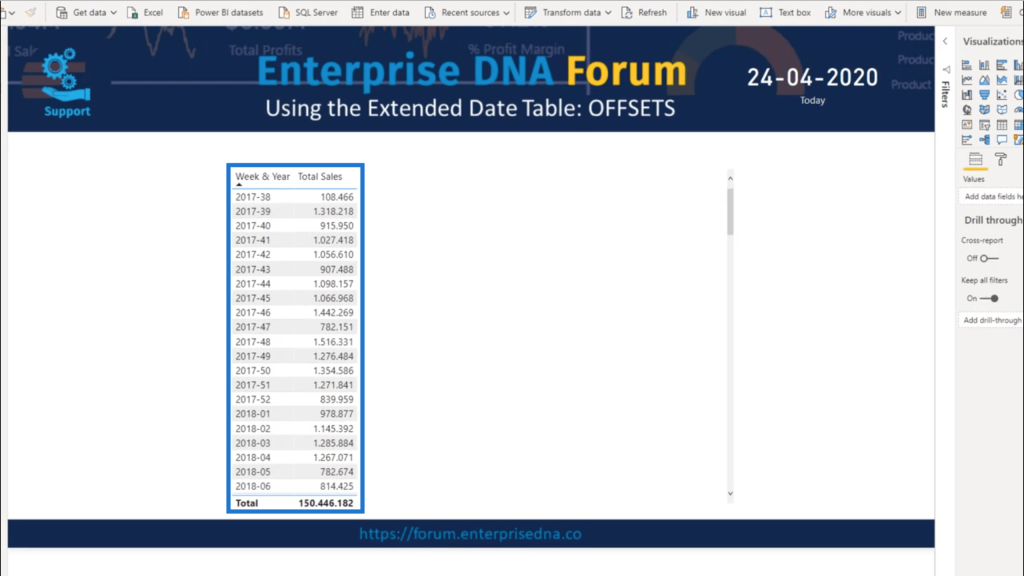
So, if I want to calculate the previous week’s sales without offsets, I would first have to extract what the CurrWeek number is, then check what the CurrYear value is.
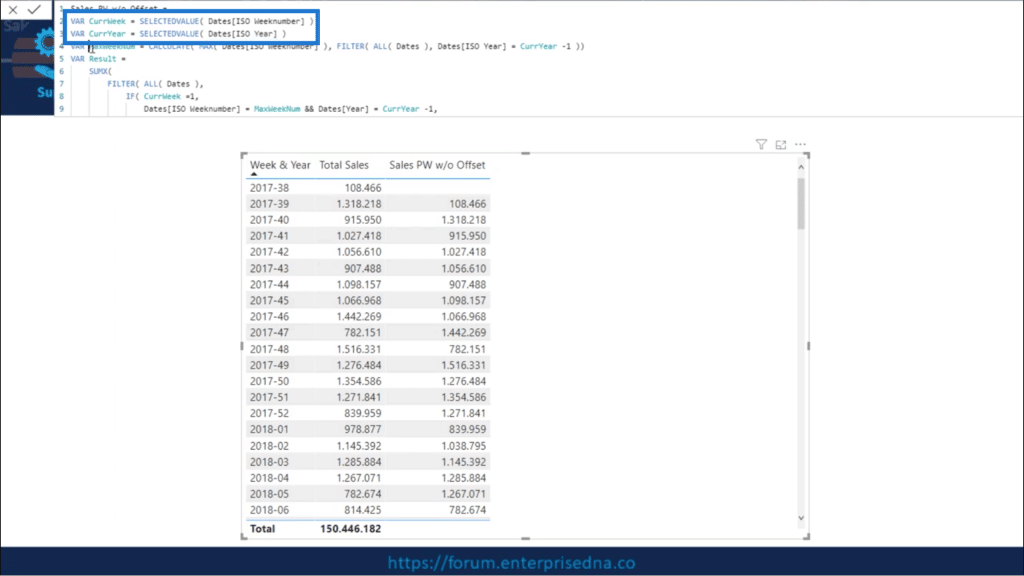
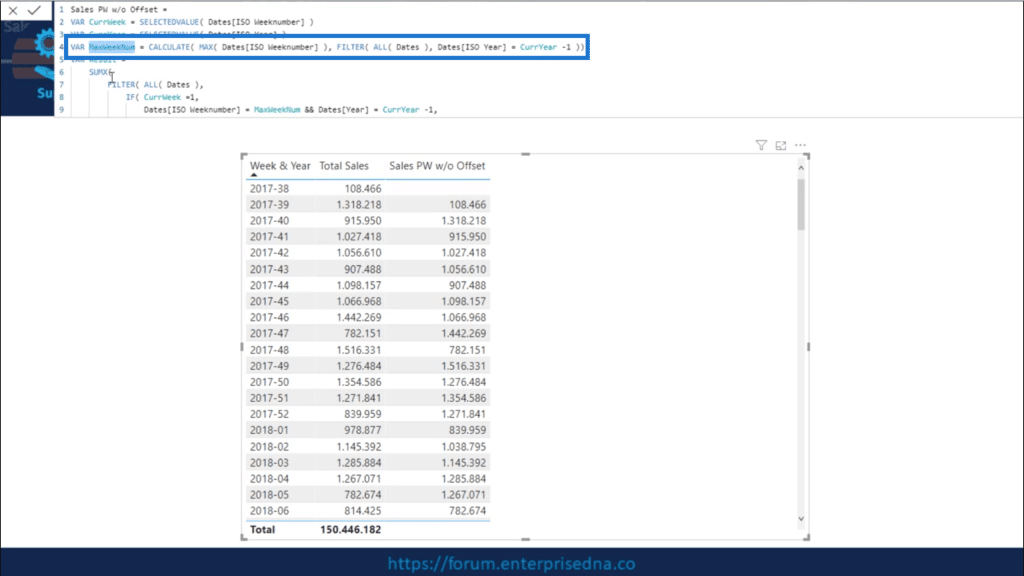
If I need to skip past a year boundary, I’ll have to calculate what the MAX Weeknumber is for that last year.
From there, I would use SUMX as an iterating function on the date table. I would also have to check if the CurrWeek is week number 1.
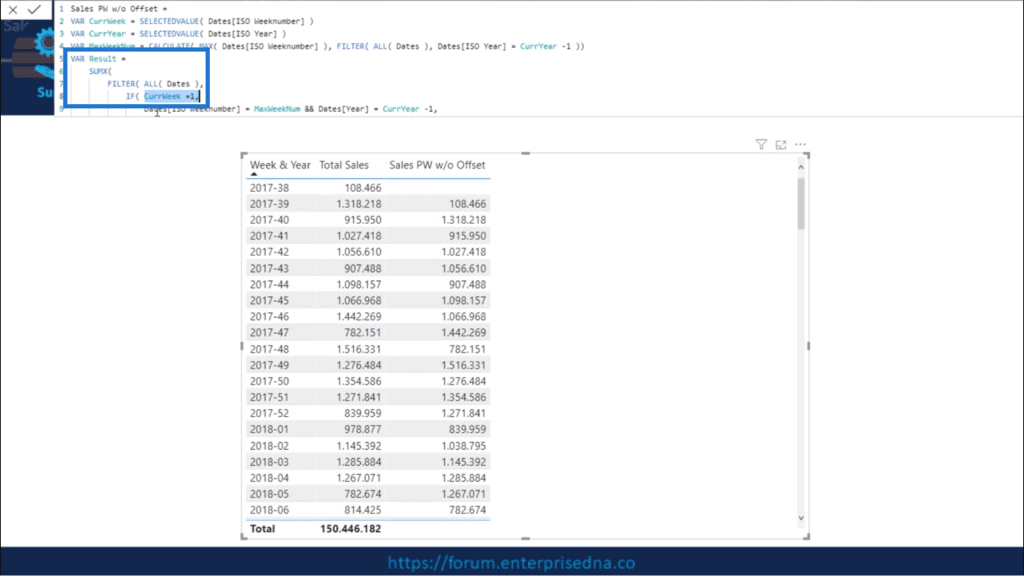
If it’s not week 1, I just need to subtract 1 from the CurrWeek value for the CurrYear. After that, the Total Sales can finally be summed up.
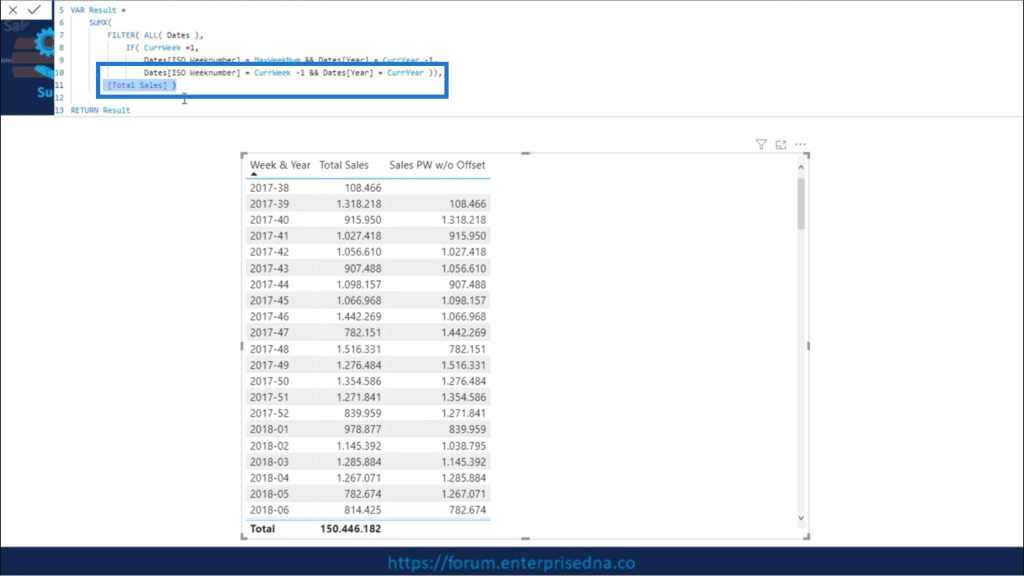
Looking at the table below, you can now see that all the values are perfectly aggregated. The values showing up under Total Sales is simply carried over to the following week.
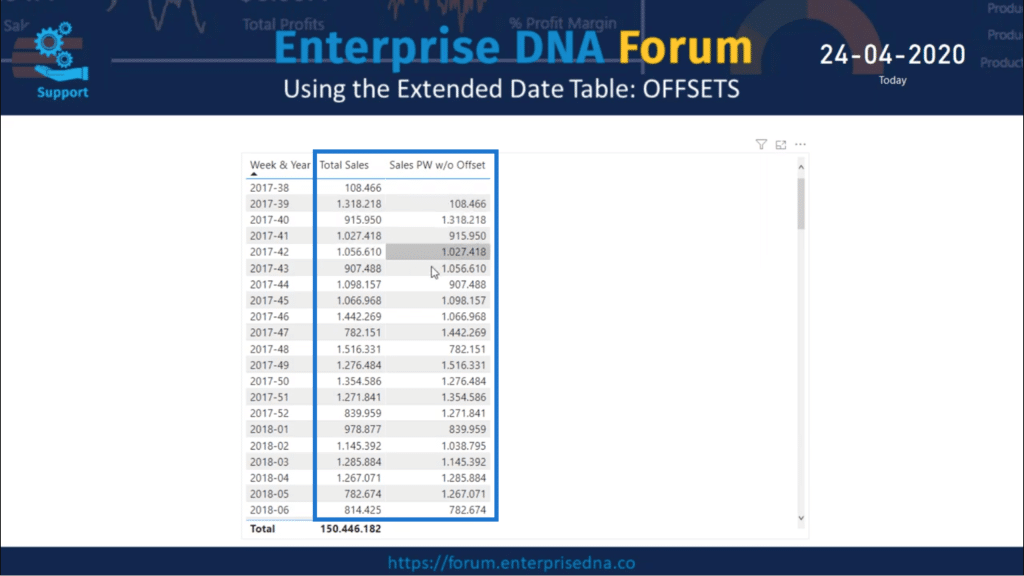
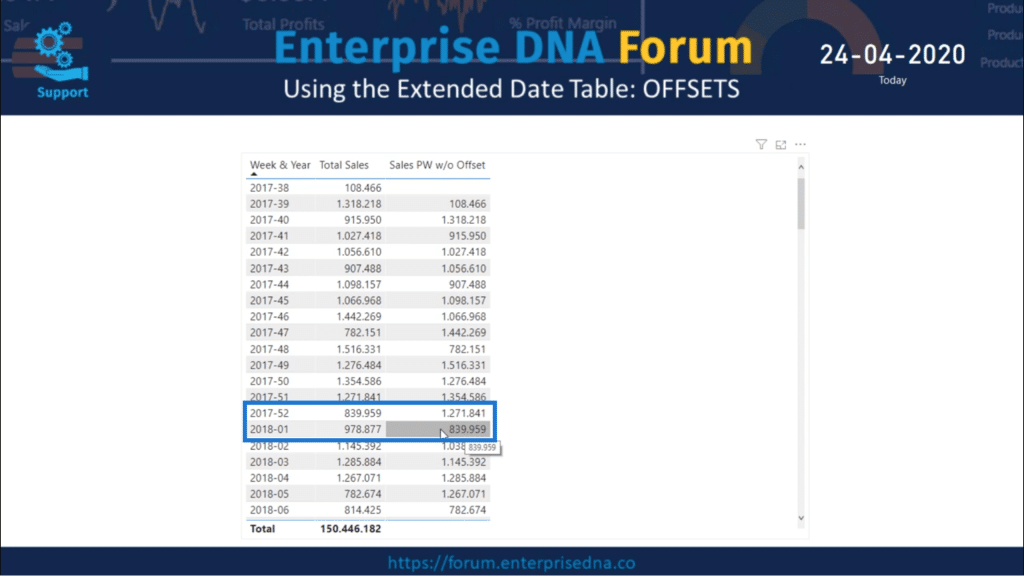
Even if I move past a year boundary from 2017 to 2018, the pattern doesn’t break. The Total Sales from the last week of 2017 is still perfectly calculated for week number 1 of 2018.
This time, I’m going to do the same calculation, but with date table offsets applied.
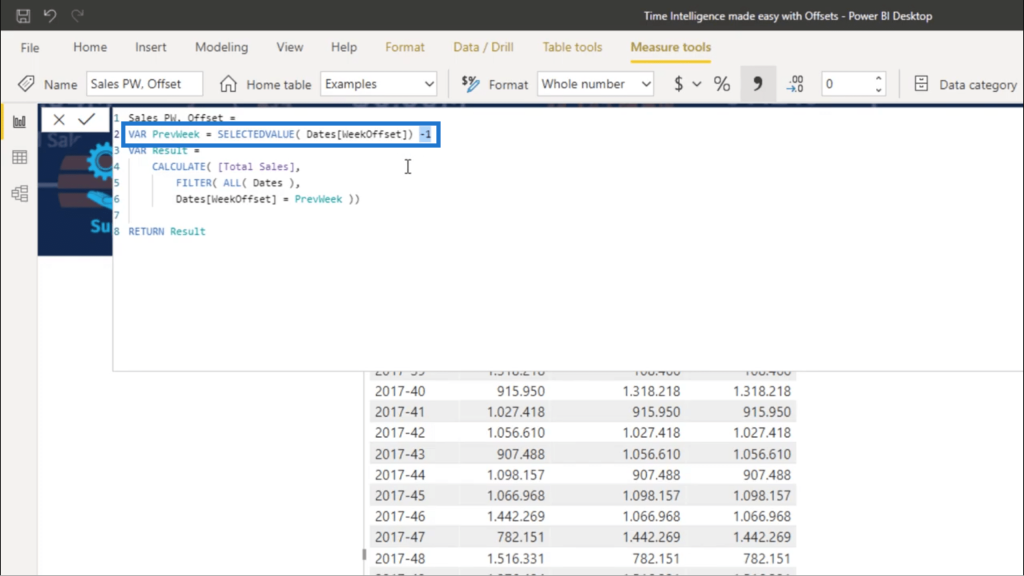
This is what that measure looks like when I use offsets.
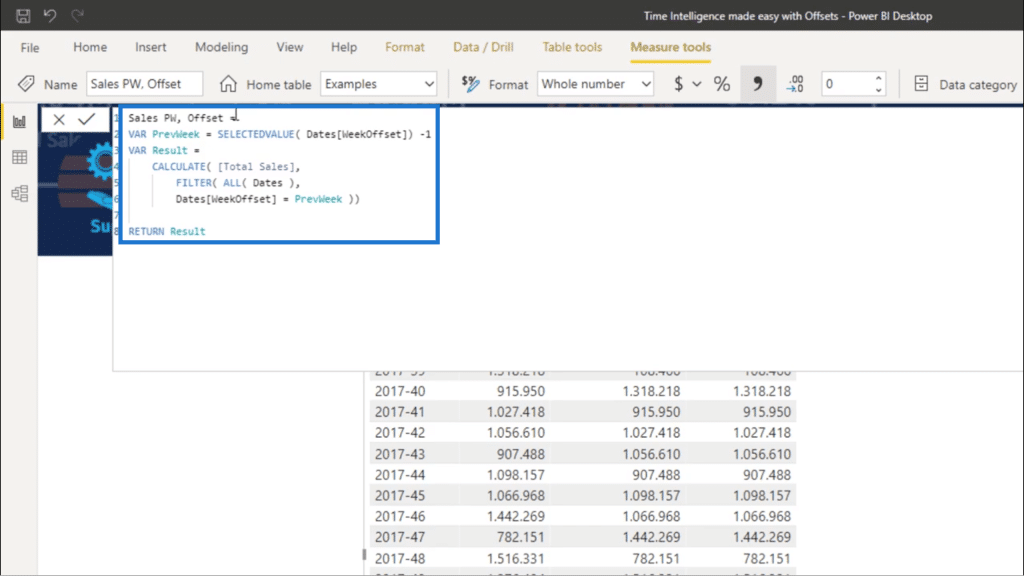
So to get the PrevWeek value, I just need to reference the selected WeekOffset and subtract 1.
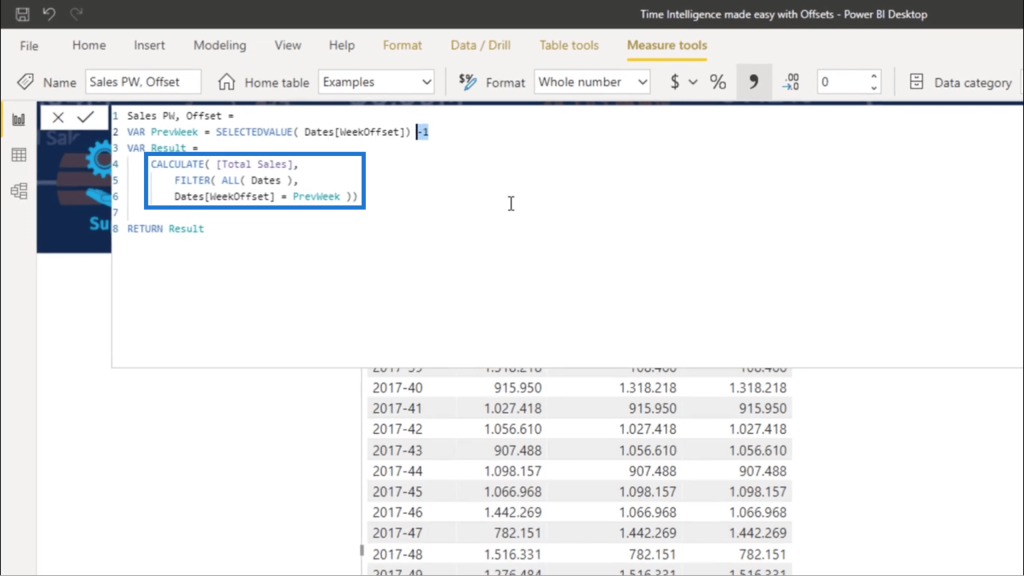
Then, I’ll use the CALCULATE function for Total Sales over ALL Dates where the WeekOffset is equal to the PrevWeek value.
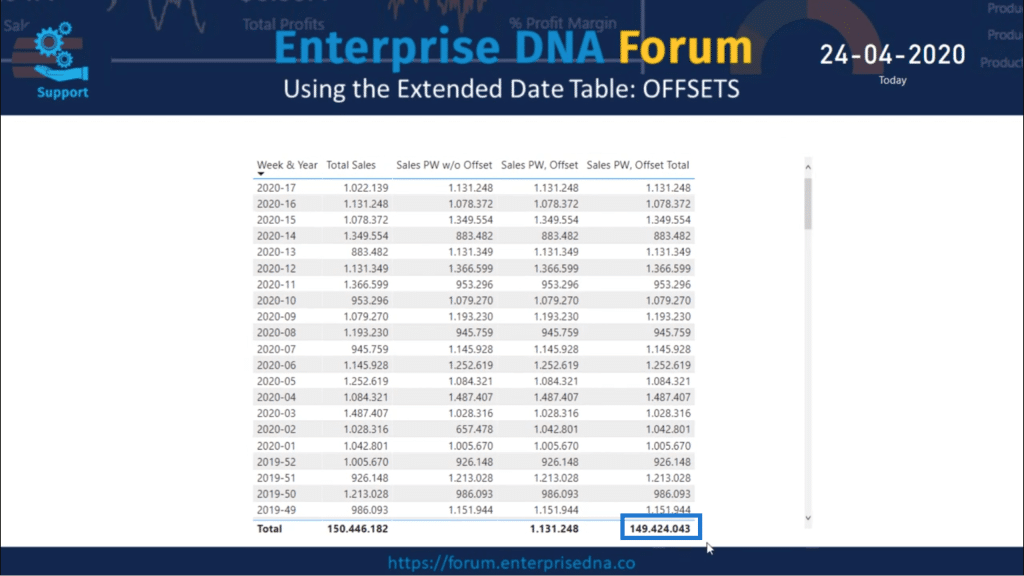
Looking at the results, the results seem to be perfect, even in the transition from 2017 to 2018.
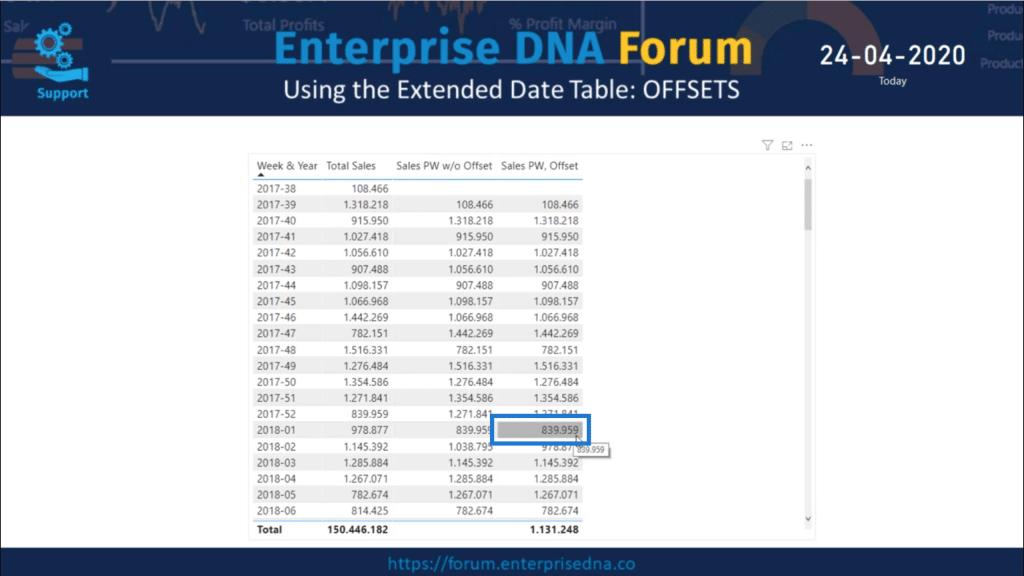
The issue, however, is in the Total. Evidently, this is not the correct value.
Here’s how I’m going to fix that.
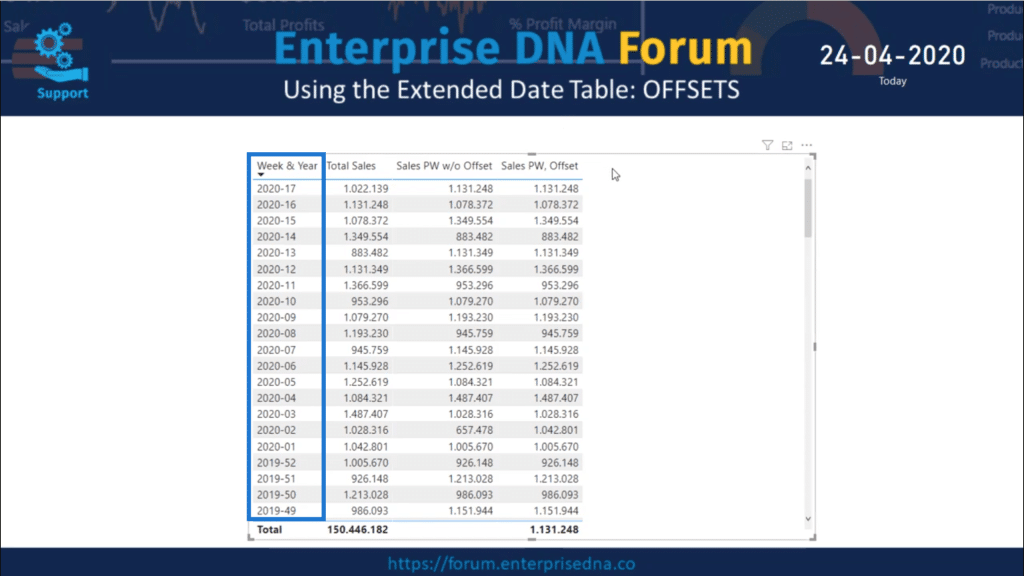
First, note that the Week & Year column is in ascending order.
I’m going to change that and sort the column into descending order instead, with 2020 at the top.

Because there is no context coming from the Week & Year, it doesn’t identify the current week’s offset value but is still subtracting 1. But what I can do is apply a cumulative total to adjust the total.
This is what the measure will look like:
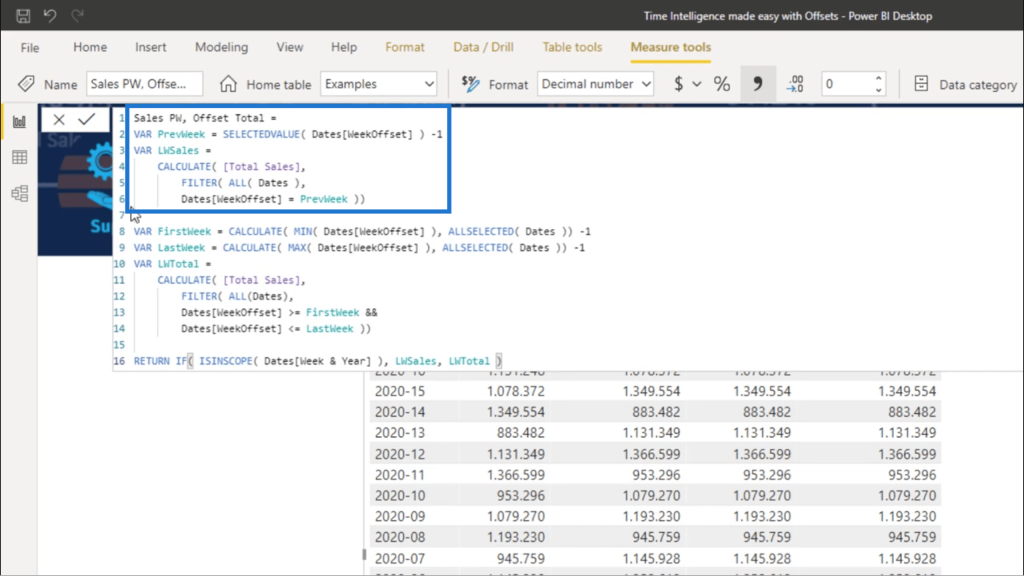
The beginning of the measure doesn’t change. It’s exactly the same as the previous measure I applied.
But since I need to use a pattern similar to cumulative totals, I have to use the CALCULATE function on the FirstWeek over the ALLSELECTED Dates with 1 subtracted from it.
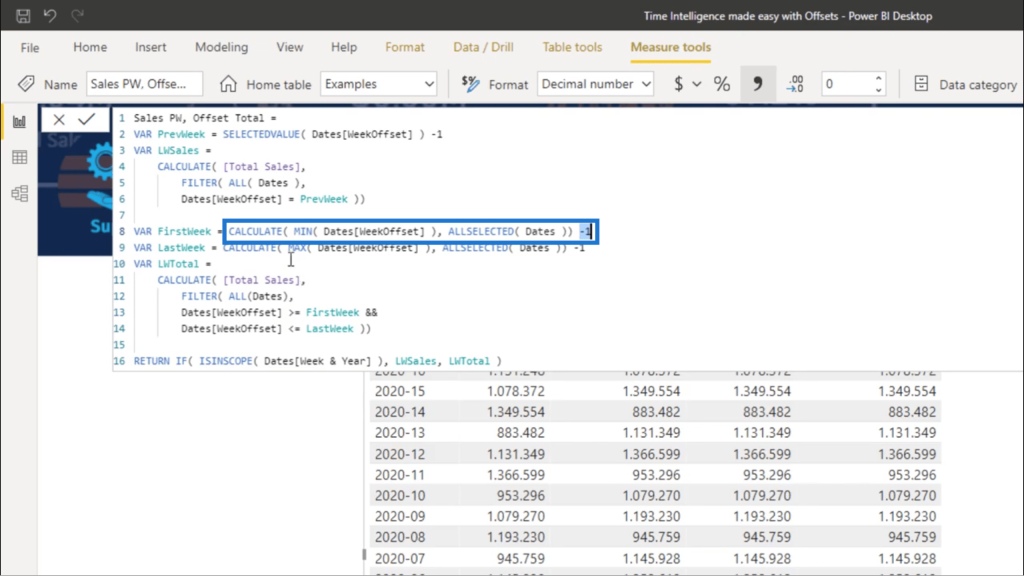
I also have to identify the MAX WeekOffset value from the ALLSELECTED dates and subtract one from that as well.

Then, I’ll use the CALCULATE function again for the Total Sales. I’ll use the FILTER function to include ALL Dates. The WeekOffset value should be greater than or equal to the FirstWeek and less than or equal to the LastWeek.
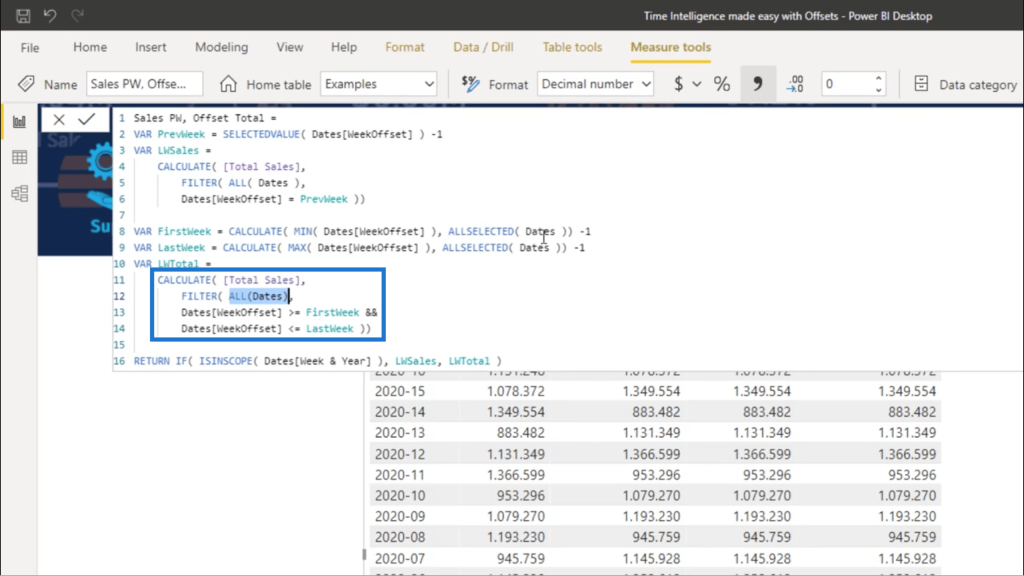
Again, this follows the basic pattern for cumulative totals.
Then I can proceed to checking the grand total by using the IF ISINSCOPE patterns.
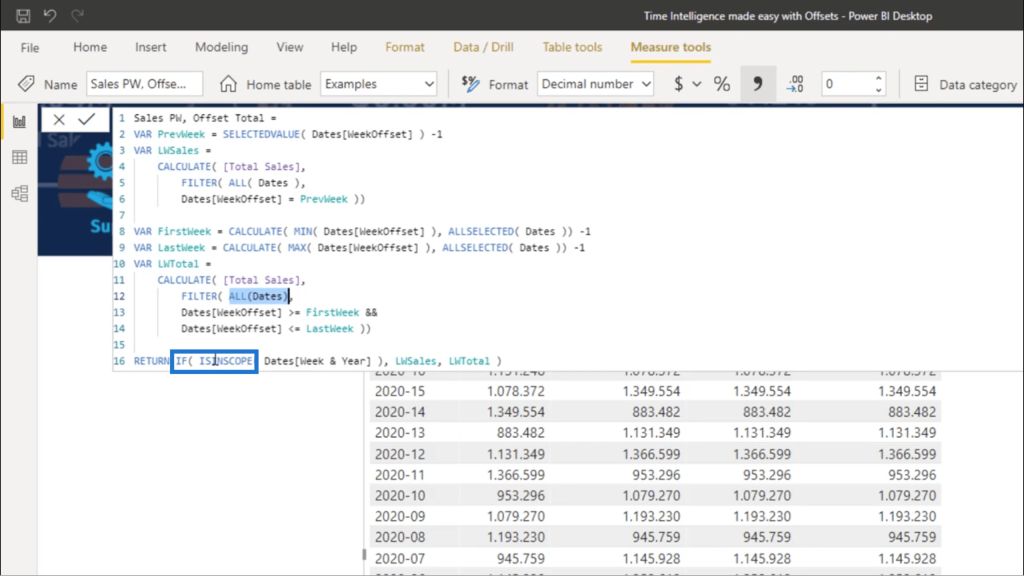
So IF the Week & Year ISINSCOPE, I expect the results to show the LWSales. But if it’s not, I expect the LWTotal to show up.
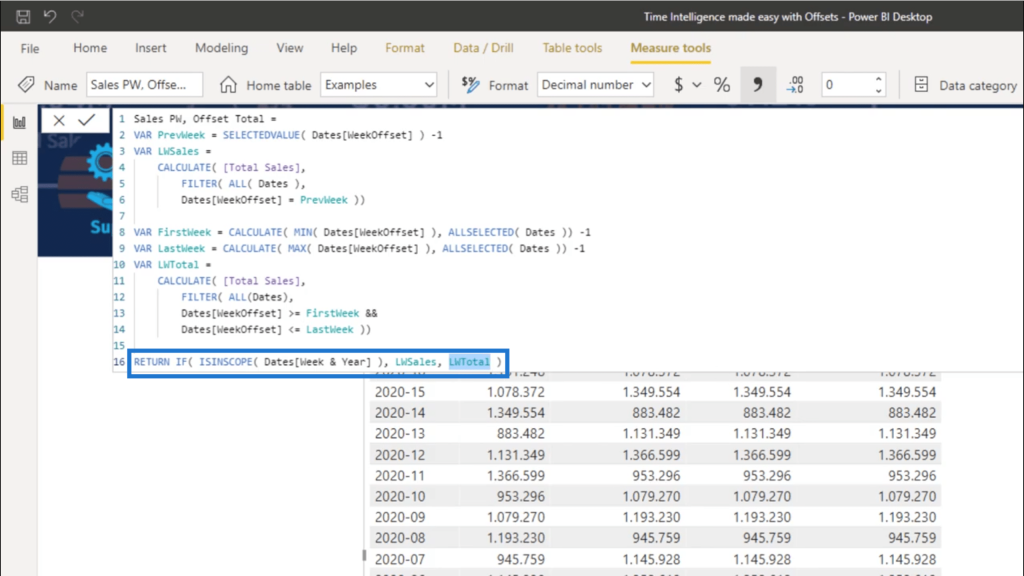
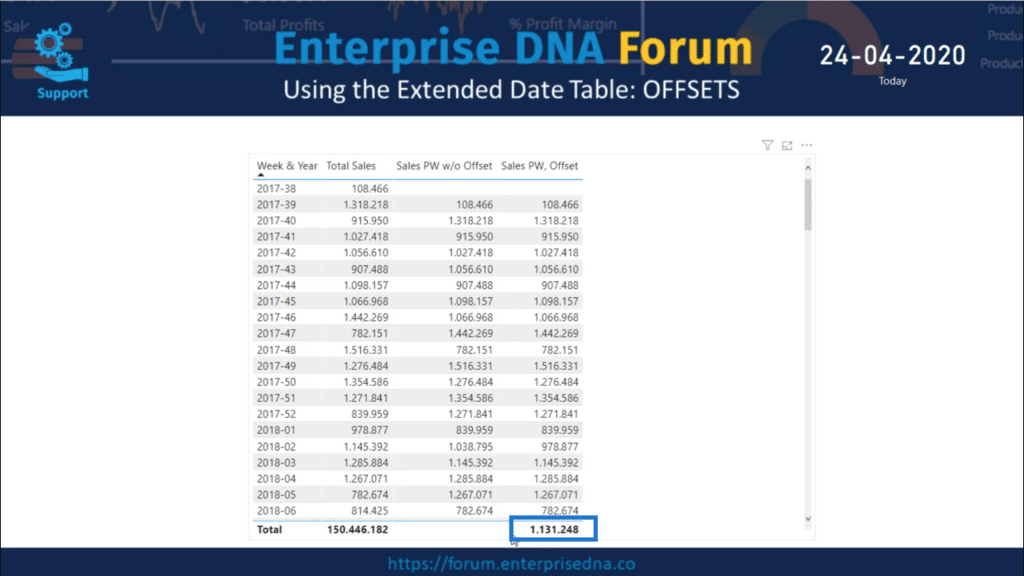
So, if I go back to my table, it will now show the correct Total.
Offsets For Specific Weeks
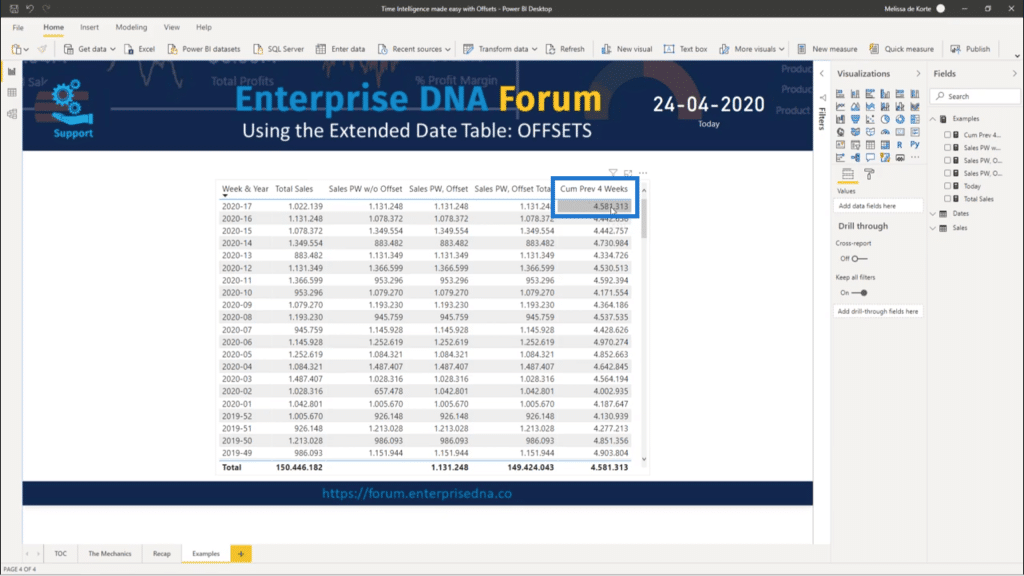
Let me go back to the example I used earlier where I filtered the data to only show the last four weeks.

If I go into the measure, I can come up with the same results using offsets. This is what that would look like.
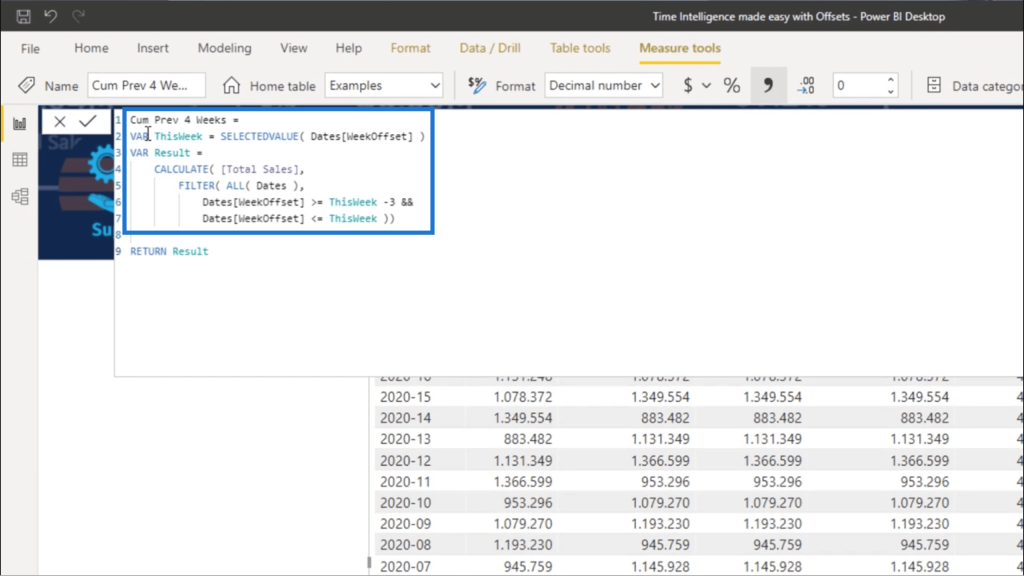
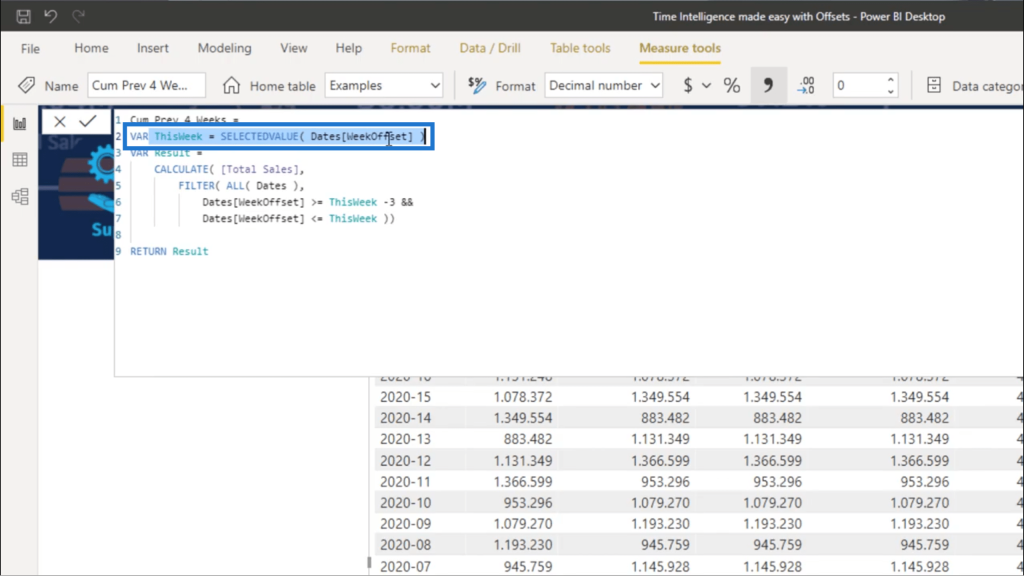
I just had to identify the current WeekOffset value for the context coming from the rows.
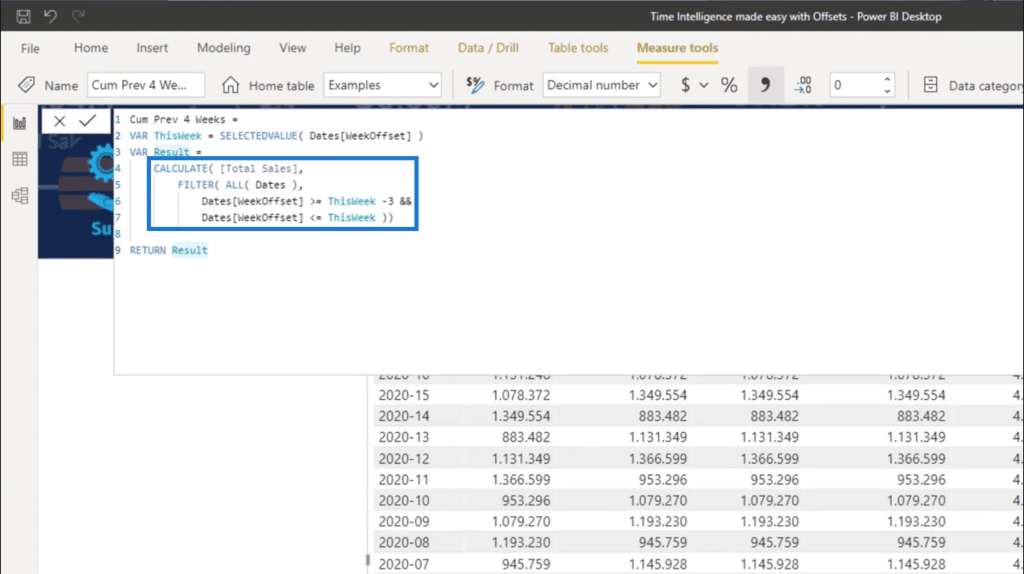
Once I have that, I can apply the CALCULATE function on the Total Sales of ALL Dates where the WeekOffset is greater than or equal to ThisWeek minus 3, or less than or equal to the value for ThisWeek.
This returns exactly the same value as the example I’m trying to replicate.
***** Related Links *****
Cumulative Totals Based On Monthly Average Results In Power BI
Data Normalization in Power BI for Different Days Results
Build A Comprehensive Date Table In Power BI Really Fast
Conclusion
The examples I showed you above prove how dynamic offsets really are. You can use them in filters, slices, and even in DAX calculations.
Offsets can also be used in extended date tables for weeks, months, quarters, years, and fiscal years. They give a lot of flexibility and can easily help you get the results you want.
Just continue playing around with offsets and see what other uses you can have for them. You can also check the Enterprise DNA Forum for other cases where the offset function proved to be useful.
All the best,
Melissa


