
For this blog post, I want to demonstrate the CROSSJOIN function. I’m going to show an example of how I used it, and then explain when and where you can use it as well. You may watch the full video of this tutorial at the bottom of this blog.
CROSSJOIN is a really effective function that you can utilize inside of Power BI to essentially bind two tables of data together.

Using CROSSJOIN To Simplify Formula
It’s not just about selecting any two tables from your data sets. You can manipulate the tables inside of the CROSSJOIN function so they can be joined in a more meaningful way.
There is a lot of analysis that you may want to achieve inside of Power BI and this function will simplify it immensely for you.
It simplifies the functions or measures that you need to write to create these calculations and ultimately visualize them in a compelling way.
How To Use The CROSSJOIN Function
In this example, I wanted to automatically create budgets, but didn’t want to create generic monthly or yearly budgets. I wanted to create budgets by product and by month.
If you look at this model, the products are in one table while our months are located in another table.

We don’t have a table where both the products and budgets are in it. It doesn’t exist so we need to create it. What I need to do is to mesh together these columns from these individual tables to create one new table and use some logic based on these two particular elements within my data model.
This is where CROSSJOIN comes in. It allows you to mesh together two columns or a range of columns from different tables and make them as one. Using CROSSJOIN, I managed to create the Product Budgets table.


There are probably other ways to do this, but this is the most effective way to recreate a table out of nothing.
To achieve this table, I used other table functions as well, which I’ll briefly run through but I will focus on CROSSJOIN for now.
This function enabled me to create the MonthName column which came from the Date table, and the Product ID column which came from the Product table. So that’s two totally different tables that I merged to create another table.

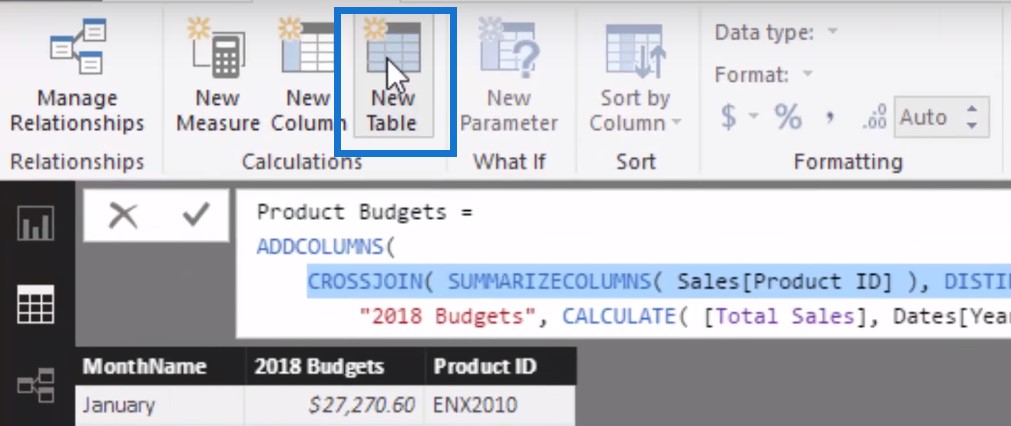
How did I do it? Let’s create a brand new table by clicking this icon and using DAX formula.
I’m going to create a demo table here and use the CROSSJOIN function. As you can see, IntelliSense is pretty good at code completion; it tells us what we need to know about the function we just typed.

It informs us that CROSSJOIN “returns a table that is a crossjoin of the specified tables.”
So basically what this means is that the function will merge two tables.
I will start with VALUES, which allows us to easily extract or create a table of a particular column.

Then I’ll add MonthName. Then I’ll add VALUES again, then my Product ID.

Remember that this doesn’t have to be a single date column. It can be multiple columns in a table. A table can be created virtually using a formula and a range of different table functions. So these are all a derivative of all these DAX formulas, while VALUES will just bring one column of information.
Using the CROSSJOIN will give me every single product and month.
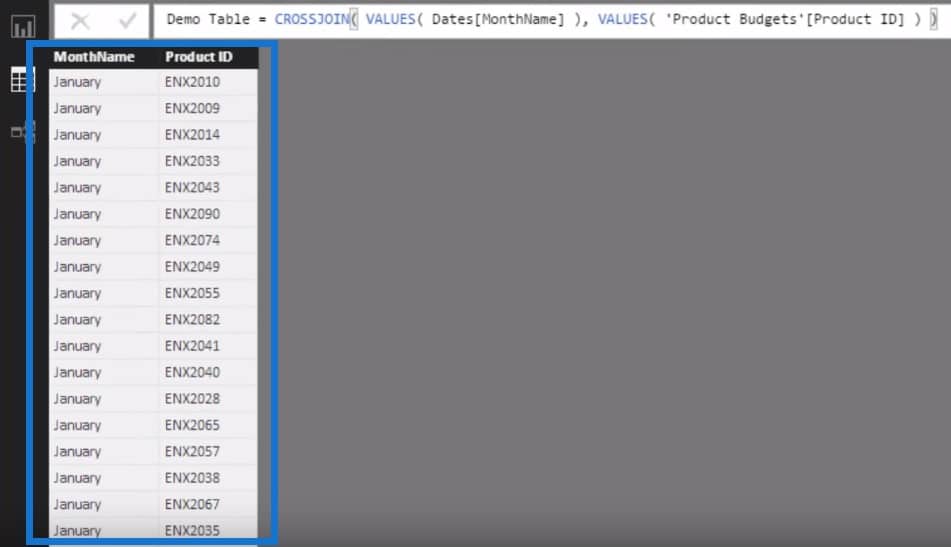
This is how you utilize CROSSJOIN – to create these brand new tables that didn’t exist before and effectively incorporate them into your models. Remember that these are from two totally different tables – the Dates and Product Budgets tables.
Using DISTINCT And SUMMARIZE Functions
Let me jump back to my Product Budgets measure here. Obviously, this is more complex because instead of using VALUES, I’ve utilized different functions.

You don’t have to use VALUES if you can use DISTINCT, which does the same thing, however there are a few slight differences.
The SUMMARIZE function also offers a lot more flexibility. You can add a lot more columns with this function compared to VALUES and DISTINCT.

In this particular scenario, I wanted to create my budgets for a particular year by taking in last year’s results. I’ve added a 7.5% growth factor to it and showcased it within this one particular table.
Instead of going through the crazy process of getting all the budgets together and making a guesstimate, I’ve automatically created them by utilizing historical information, putting a factor on it, and then putting it into one table using CROSSJOIN.
Other Ways To Use CROSSJOIN
If you think about it, you can utilize CROSSJOIN in different ways. In this case, I’ve used it on products.
But you can use exactly the same technique with CROSSJOIN while working on your regional budgets, salesperson budgets, or customer budgets.
***** Related Links *****
Advanced Budgeting Insights in Power BI – FREE Training Workshop
How To Calculate Actual Results To Budgets Per Product – Power BI & DAX
Managing Seasonality In Your Budget Analytics – Advanced Power BI
Conclusion
CROSSJOIN will utilize the two tables that you place within it and bring them together.
If you can get your mind around how this technique actually works, you’re going to be in a great position to run this type of analysis in your own models.
I also demonstrated the CROSSJOIN function in a recent Enterprise DNA webinar series workshop, where I covered many other techniques to use when analyzing budgets and forecasts versus actual results.
Good luck!
Sam


