There are many instances with financial analysis wherein we need to integrate exchange rates, and we can do this easily in Power BI. You may watch the full video of this tutorial at the bottom of this blog.
I have actually shown an example of how to do this using the LOOKUPVALUE function in Power BI.
However, I found one slight issue with the particular function that I went through in the initial video that I didn’t realize at the time.
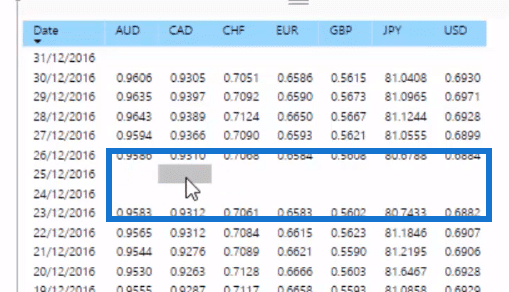
The problem was that the exchange rate table did not have any exchange rates listed on the weekend, but we did sell goods on the weekend.
What was happening was that the amount sold was being divided by a blank number. As a result, we were getting this infinity result, which was because there was basically no result to showcase.

So what we needed to do was something slightly more advanced in our DAX formula.
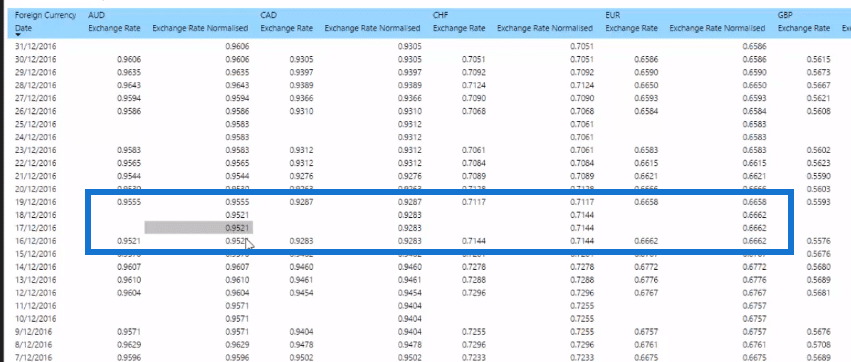
We have to actually normalize the exchange rate. Whatever the result was in the table for the Friday, we need to copy that to Saturday and Sunday.
We must re-enact that inside of Power BI with our formula and in this tutorial, I run through how you do that.
But, before we get into the updated formula, we will first review how we handle exchange rates and multiple currencies in Power BI using the LOOKUPVALUE function.
Handling Multiple Currencies Using LOOKUPVALUE
We put the LOOKUPVALUE function inside an iterating function, which is SUMX.
Here, we want to sum up the revenue, but we adjust every single row in the Sales Data table. This way, we have the associated exchange rates for each sale.

The LOOKUPVALUE function does is literally “look up” the value for the particular exchange rate on specific dates and other relevant information for your SUMX calculation.
In this formula, every single sale will be adjusted for the currency rate on that particular date.
Flaw In The LOOKUPVALUE Formula
The formula with LOOKUPVALUE is not actually bad. The only problem with it is that there was no currency exchange rate on the weekends.
On the first glance, we would not notice it when we look at the historic data. It would appear that every single day has a currency exchange rate.
However, when we look closer, the weekends are actually missing. This means that the result of the calculation is not accurate.

The solution is to set a number on the weekend. And to do this, we use the Friday number and drag it over Saturday and Sunday because currencies don’t trade on a weekend.
Handling Multiple Currencies Using LASTNONBLANK
To achieve the solution to the missing weekend number, we need to create a new formula that extends the Friday number over Saturday and Sunday.
Here’s the formula:

This formula, which I called Exchange Rate Normalized, uses a variable (VAR) with FILTER (RevisedDates) that is incorporated into CALCULATE with the LASTNONBLANK function.
The LASTNONBLANK looks into the last exchange rate in a RevisedDates table, which we used in combination with the FILTER function.
The RevisedDates table looks back at three days, and then grabs the last exchange rate that exists on those days.

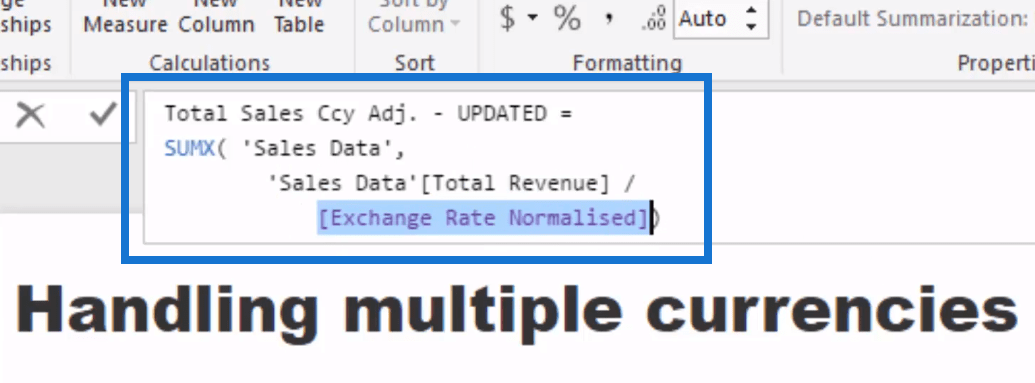
We can then integrate this Exchange Rate Normalized formula into our Total Sales Ccy Adj. formula, simplifying it.

This is how your data looks like with the updated Total Sales Ccy Adj. formula with the Exchange Rate Normalized that extends Friday over the weekend:

***** Related Links *****
Multiple Currency Logic In Power BI – LOOKUPVALUE Example
How To Download Latest Exchange Rates Into Your Power BI Model
How To Deal With Products That Have Changing Prices Overtime In Power BI
Conclusion
This blog discusses the updated formula for handling multiple currencies in Power BI.
Instead of using the LOOKUPVALUE, we use the LASTNONBLANK function in a separate formula, Exchange Rate Normalized, which is then incorporated to our calculation for Total Sales Ccy Adj.
Coming up with this formula was not easy, but it’s a very powerful tool for your calculations.
There’s a little bit to it from a DAX perspective. However, if you can get your head around how this works, especially the LASTNONBLANK function, then there are many implications of similar techniques across many analytical scenarios you might find yourself having to analyze on a day-to-day basis.
Cheers,
Sam


