At Enterprise DNA, we continue to develop innovative Power BI solutions. And we continue to make these available to those with membership.
I’m excited to share with you three more additional demonstrations that we have now listed on our Power BI Showcase page.
As a reminder these are available for download within Enterprise DNA Online in the Showcases Module.
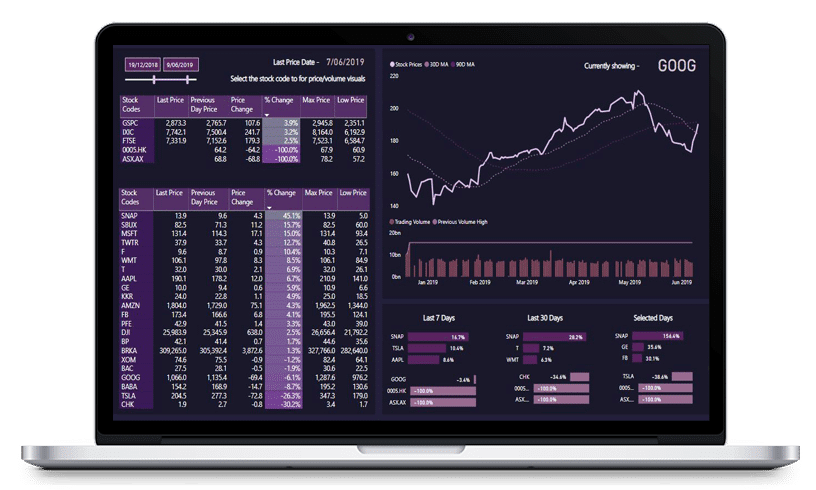
Stock Market Dashboard

In this demo we are representing stock market data in a dynamic way within Power BI. You can easily navigate between stocks and see what historical pricing has occurred. Also included is volume data to bring additional colour to the pricing insights.
But we haven’t stopped there with our analysis. We’ve also taken some simple pricing and volume data and then completed a range of additional calculations utilising DAX inside Power BI, especially focusing on percentage change insights over different timeframes.
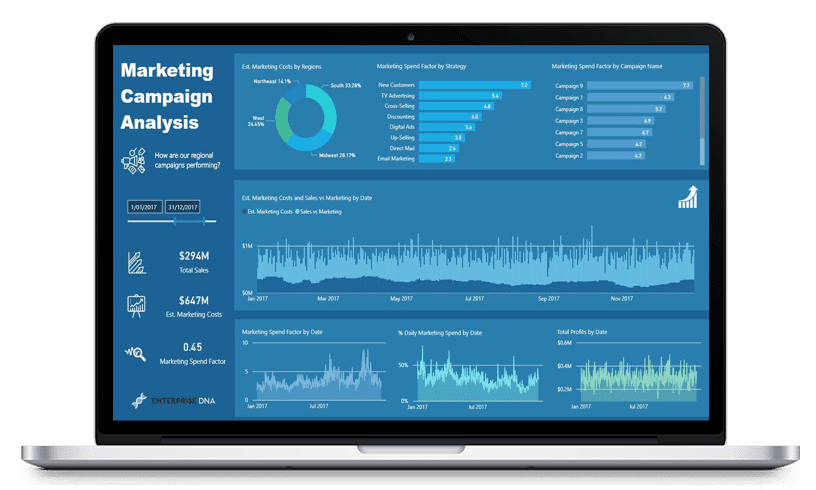
Advertising Campaigns

In this particular reporting demonstration, we focus on advertising campaign data. Attempting to analyze how our campaigns have performed over time versus one another.
Within an organisation with a strong marketing strategy, you could potentially run numerous campaigns all at the same time and it could be difficult to determine which one is performing the best.
With Power BI you can effectively do this if you set up your model and calculations using the best practices. This tutorial represents that and looks to visualise it in a compelling way.
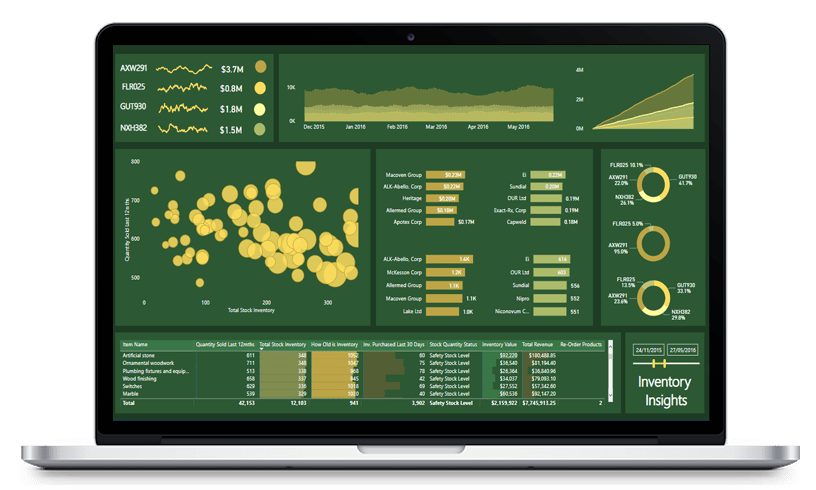
Inventory analysis

In this particular showcase we have looked to dive into our inventory data by comparing how our sales have gone historically to attempt to forecast what are inventory requirements would be going forward.
These are high-quality insights. It can add a lot of value to any organisation looking to manage and optimize their inventory. Power BI is perfect for this type of analysis because you can create a diverse range of calculations and insights, which enable bit of forecasting and planning of your cash management and inventory requirements, in the one model.
Anyone can view and play around with these demos at the Power BI Showcase on the Enterprise DNA website. See below to see where to view these.

If you want to be able to download these completed models and see other backend data models, etc., all that’s required is a membership upgrade. You can then access not only the particular demos, but around 35 others as well. There is no other offering that comes close to this across the Power BI training landscape, so hopefully you can see the value that Enterprise DNA Team makes available through our tutorials and demonstrations.
Enjoy
Sam


