
The second pillar of Power BI development is data modelling. In this tutorial, you’ll learn about all the important things to consider when it comes to setting up your Power BI data model. What follows is a comprehensive overview on data model development best practices.
Organizing Your Power BI Data Model
1. Star Schema
One of the best ways to set up a Power BI data model is using the Star Schema. It gets its name because it resembles a star.

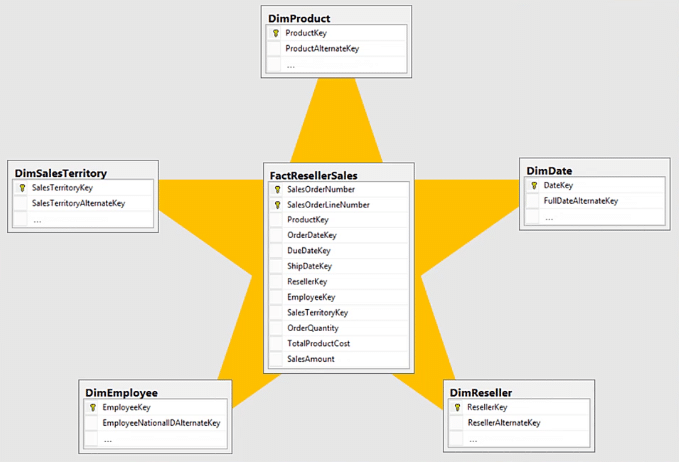
The Fact table is at the center of the star and the Dimension or Lookup tables are at each point of the star.
Here is what it looks like with relationships:
The data model doesn’t have to look exactly like a star. The idea is to place the Fact table at the middle while the other tables neatly surround it.
2. Waterfall Approach
Another great way to organize a data model is using the Waterfall Approach.
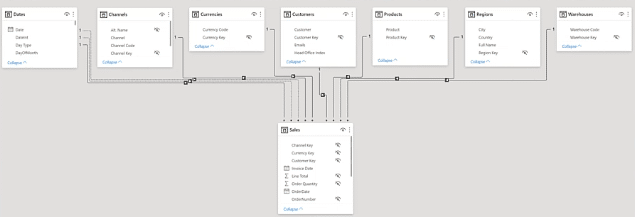
The Dimension or Lookup tables are arranged at the top while the Value or Fact tables are arranged below. This makes it easy to visualize the relationships as if they’re “falling” to the Fact table.
These are the different parts of the Waterfall layout:
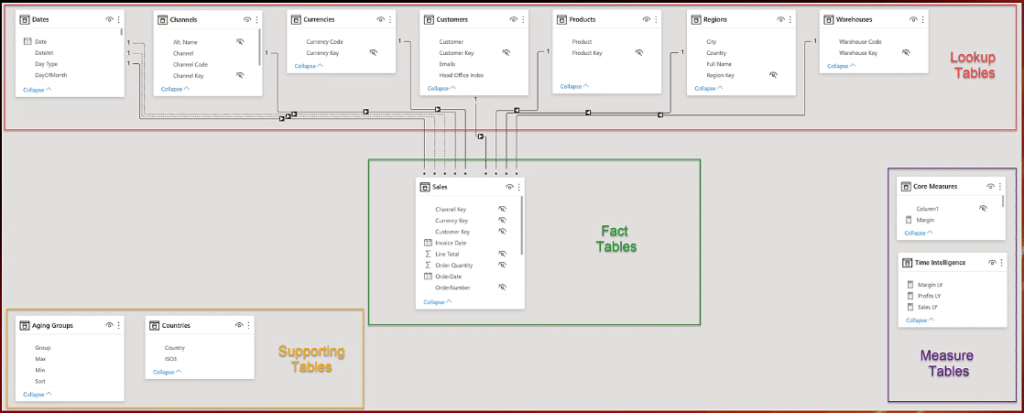
The Lookup tables are placed at the top while the Fact tables are placed in the middle. The Measure tables are grouped in a column over to the right. The Supporting tables are placed in rows at the bottom left.

Managing Relationships In A Power BI Data Model
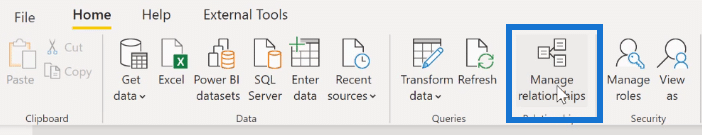
1. Manage Relationships
Make sure to delete any relationships that might have been automatically generated by Power BI. It’s better to manually recreate each relationship. You can use the Manage Relationships dialogue to maintain the relationships in your data model.
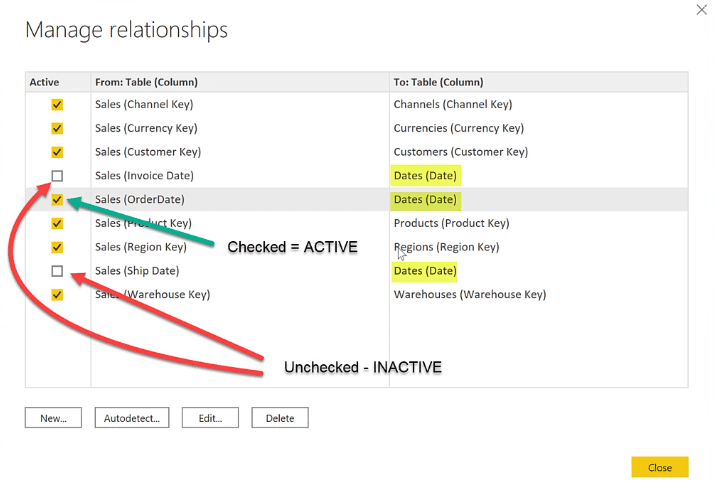
When using Manage Relationships, you’re presented with the full list of relationships in your model.
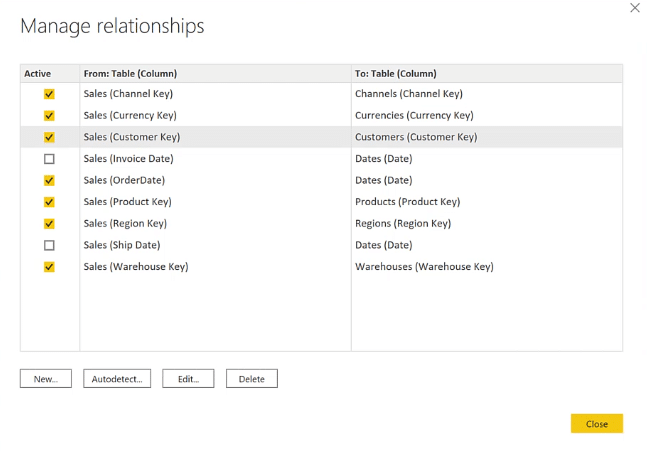
You can see all the From and To tables and columns. This makes it easier to spot incorrect Keys that are being used to join tables. The state of each relationship is also presented. This allows you to activate or inactivate relationships as necessary.
2. Cardinality In A Power BI Data Model
The Manage Relationships dialogue also makes it easy to view the cardinality and its direction.
Ideally, relationships can either be one-to-many or many-to-one. Power BI is excellent at defaulting the cardinality according to your data.
To view the cardinality, click the Edit button found at the bottom of the dialogue.

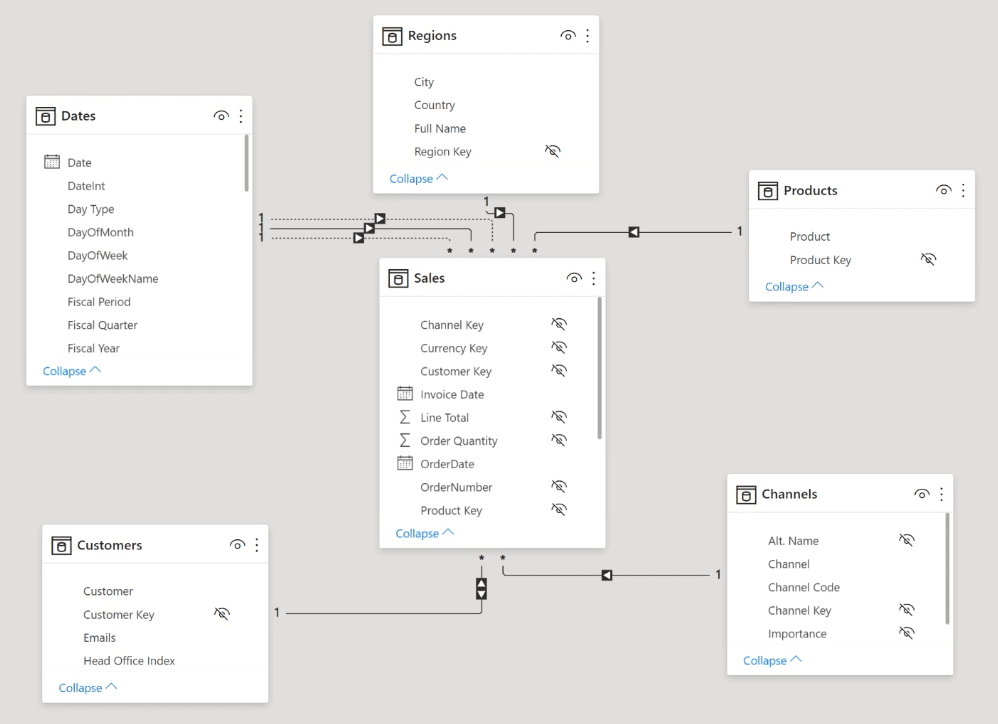
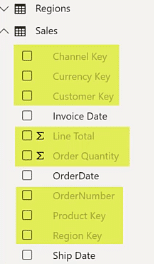
For this example, you can see the relationship between Sales and Channels. Scrolling to the right-most column of each table, you’ll see that Power BI has picked up the Channel Key for each row.
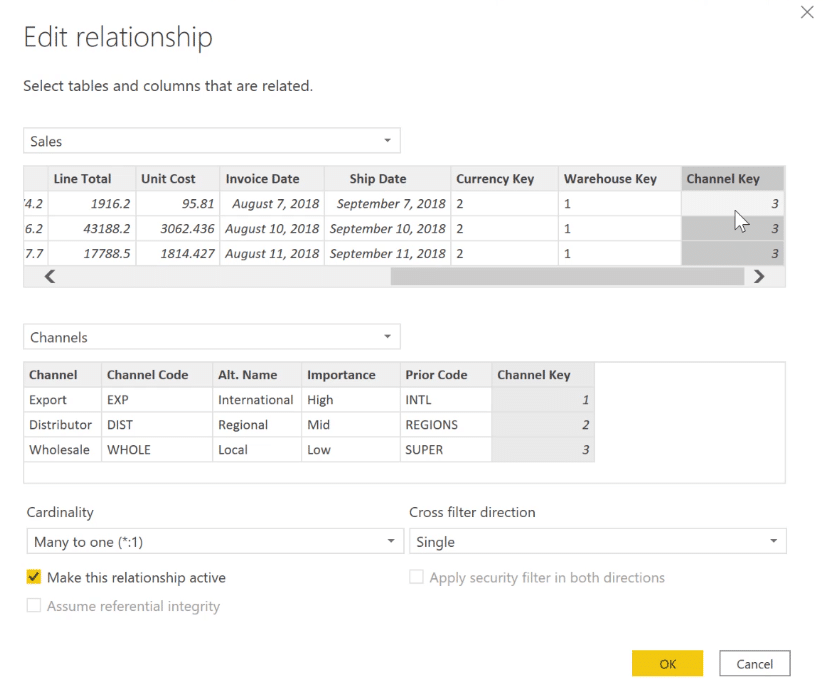
You can also choose the correct cardinality. Make sure that your cross filter direction is either Single or Both, depending on your data model.
Power BI uses Single as the default. So when you see that the default for the cross filter direction is Both, take a moment to confirm that the data in your data set is loaded and transformed as intended.
3. One-to-many Vs Many-to-one
For relationships in Power BI, it’s recommended to use one-to-many relationships as much as possible. This is denoted by a single directional arrowhead.
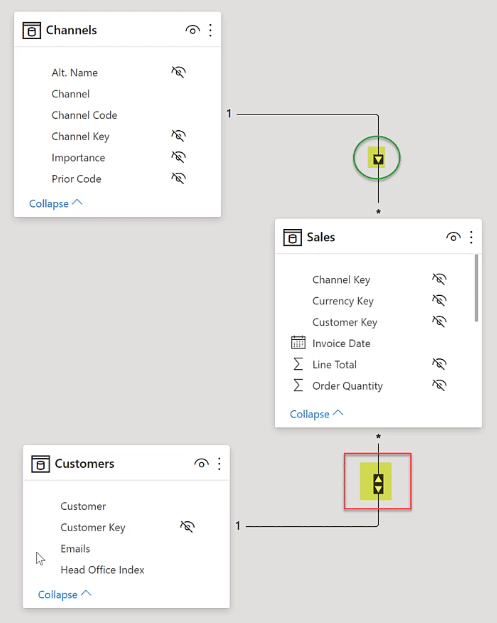
Avoid bi-directional relationships unless absolutely necessary. Bi-directional relationships are denoted by double directional arrowheads. These types of relationships can lead to inconsistent results and often require more complex DAX.
4. Active Vs Inactive Relationships
You can only have one active relationship between two related tables. But you can have as many inactive relationships as you want between those tables.
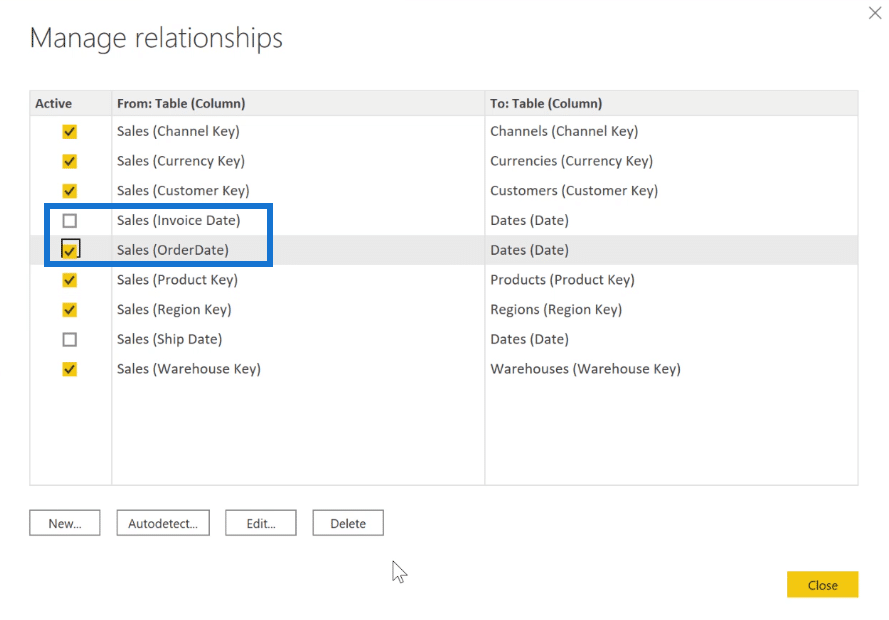
As an example, if you try to activate the OrderDate column from Sales, a pop-up will appear saying that you can’t do two relationships between the same two tables.
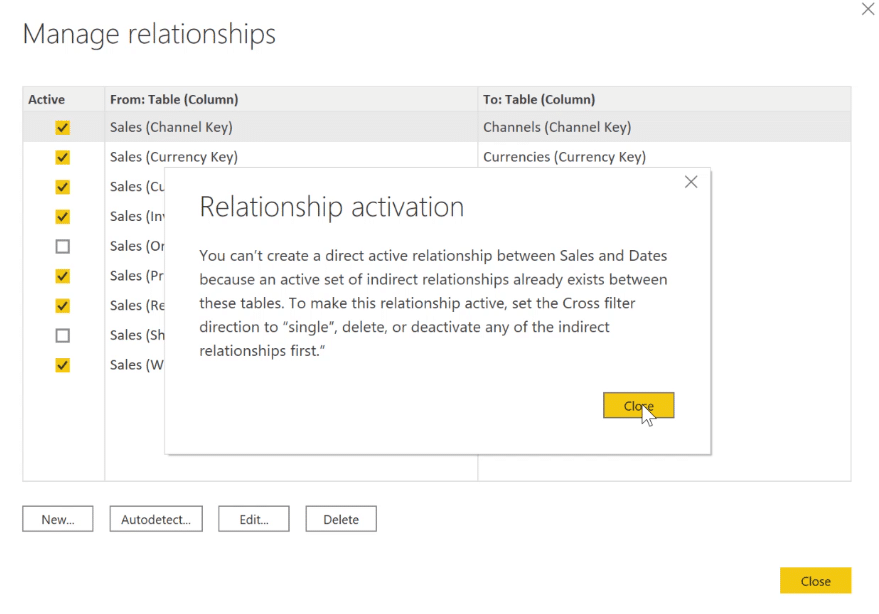
So, you’ll need to inactivate the Invoice Date relationship. That’s the time you can activate OrderDate.
Also, by using the USERELATIONSHIP command, you can use an inactive relationship on-demand in a DAX measure.

Adding Tables And Columns In A Power BI Data Model
1. Measure Tables
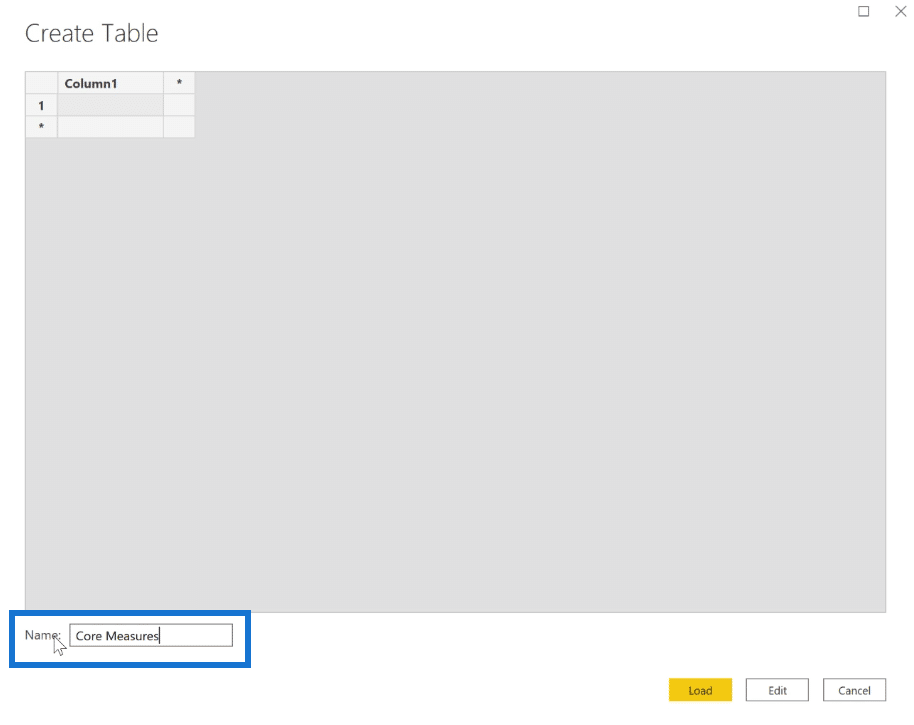
You can add Measure tables by choosing Enter Data from the Home menu.
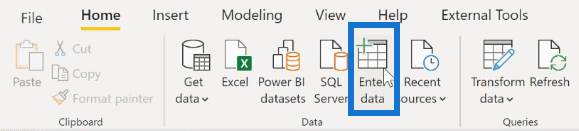
Once you click that, a window will appear that allows you to create a new table.
When creating a Measure table, make sure to give it a meaningful name. In this case, it’s called Core Measures. Once done, click Load.
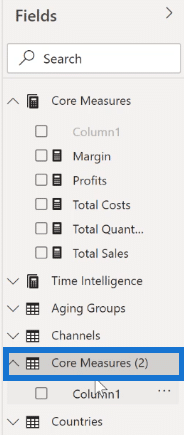
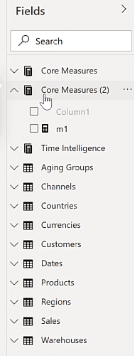
In this example, there is already an existing Core Measures table. So, Power BI automatically labels the newly created table as Core Measures (2). This also has a default Column 1.
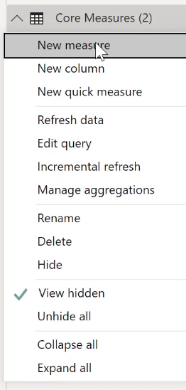
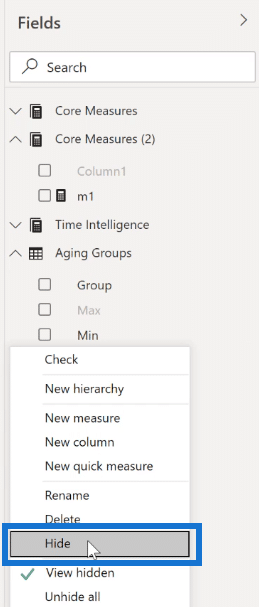
Right-click Core Measures (2) and then select New measure.
For the sake of demonstration, let’s just input m1 = 1 in the measure.
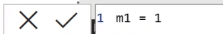
This is now added under Core Measures (2). Make sure to delete or hide the default column.
If you hide and then expand the Field pane, you’ll see that Core Measures (2) now appears at the top of the field.
2. Linking Columns
When it comes to linking columns in Power BI, it’s recommended to use the suffix Key on any column that will be used for linking. If a column ends with ID or Code, you need to be wary of them as they may mean different things in different tables
You should only link columns that have similar names. For example, when linking the Customer Key, it’s important to ensure that all fields used for linking all end with the word Key. You also need to make sure that they’re of the correct data type.
3. Column Visibility
If you’ll be the only one using the Power BI report you created, then column visibility is not that big of a deal. However, if you’ll be publishing a report or data set to be used by others, it’s a good idea to tidy things up.
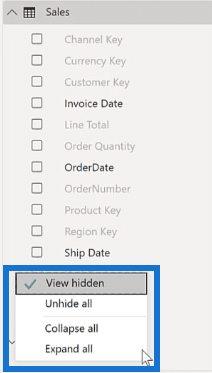
You can do so by selecting the correct measures for the visuals and then hiding columns that don’t appear in them. Hidden columns are grayed-out.
To hide columns, you only need to right-click on a specific column and then select Hide.
You can choose to hide hidden columns by right-clicking on the Field pane and then unchecking View hidden.
***** Related Links *****
Data Modelling In Power BI: Tips & Best Practices
Building Your Data Model Relationships In Power BI
Data Model For Power BI Retail Sites Dashboards
Conclusion
This tutorial provides you with a comprehensive outline of the things you need to consider and execute when creating data models in Power BI.
It’s important to make sure that data models and the relationships are set up correctly to avoid complications in the later stages of developing your report. Following these tips will guarantee a seamless flow from start to finish.
Greg


