
In this tutorial, we’ll look at the DAX Studio Keyword, MEASURE.
Before diving into this topic, be sure to read first on the EVALUATE and DEFINE keywords. The example query used in this tutorial is a continuation of these two keywords.

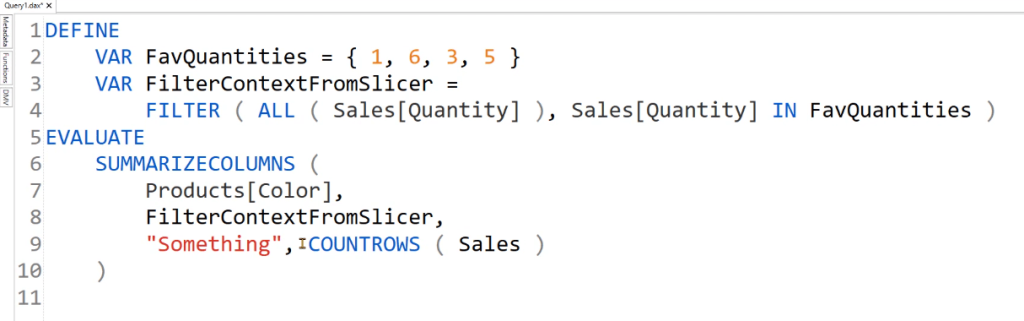
Ideally, the base measure shouldn’t be written as COUNTROWS for the Sales Table. Instead, you need to create a local query MEASURE in your DAX Studio session.
Creating The DAX Studio Base Measure
Write the MEASURE keyword and then define the table where that keyword will be used on. In this case, it’s the Sales table.
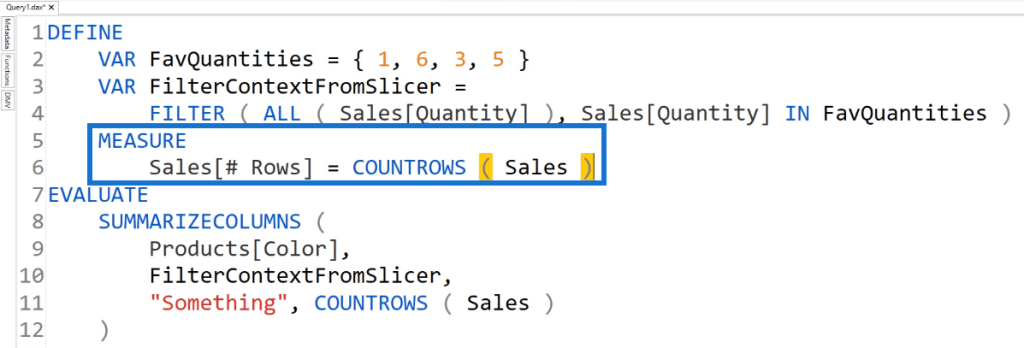
So instead of writing COUNTROWS [ Sales ] under the EVALUATE keyword, you can write [ # Rows ].
Note that when you type # Rows, it doesn’t appear in the IntelliSense feature in DAX Studio. This is because this measure is not part of the Tabular Object Model in Power BI.
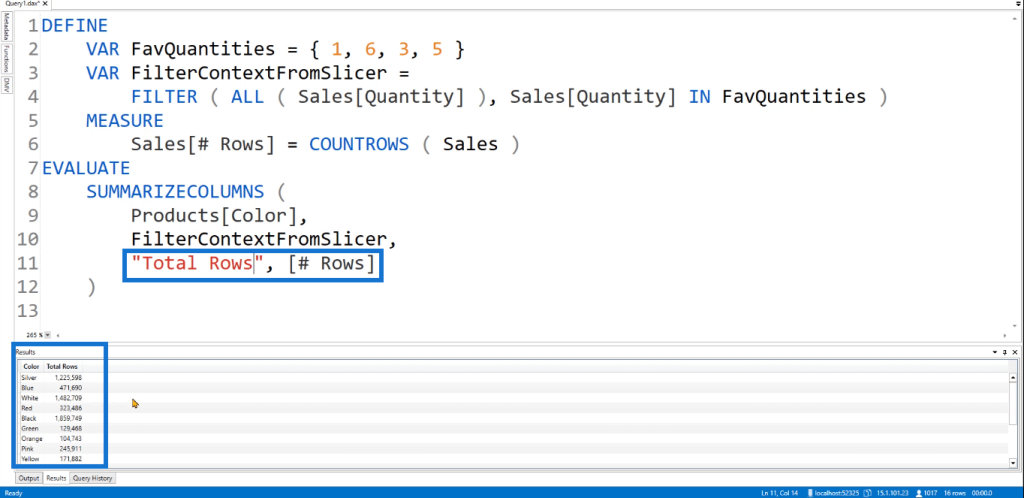
When you run this query, you’ll get a table containing a column for the Product Color and the Total Rows.
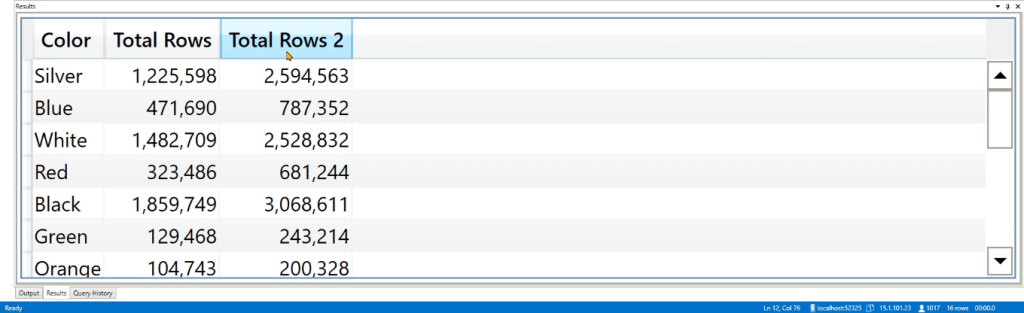
You can also reuse the base measure for a different column. Let’s add another column called Total Rows 2. This uses the CALCULATE function on # Rows.

Next, remove the Sales Quantity from the filter context so that the measure won’t be affected by the filter coming from the slicer. Instead, use the REMOVEFILTERS function over the Sales Quantity.
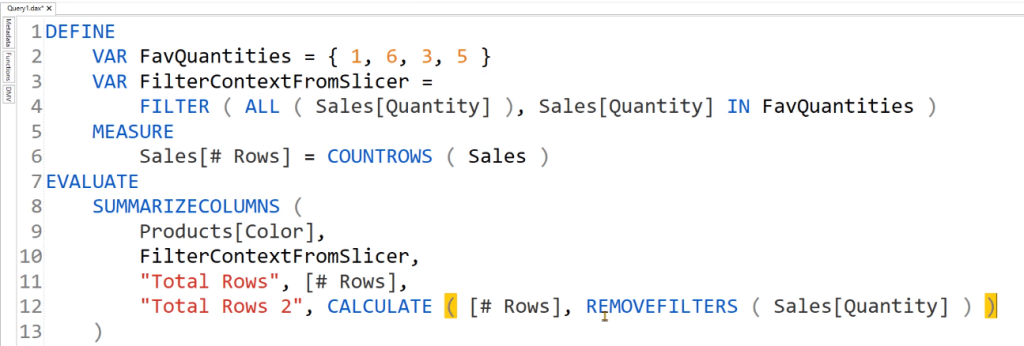
Once you execute this code, you’ll get a new column in the table.
Simplifying DAX Studio Queries With MEASURE
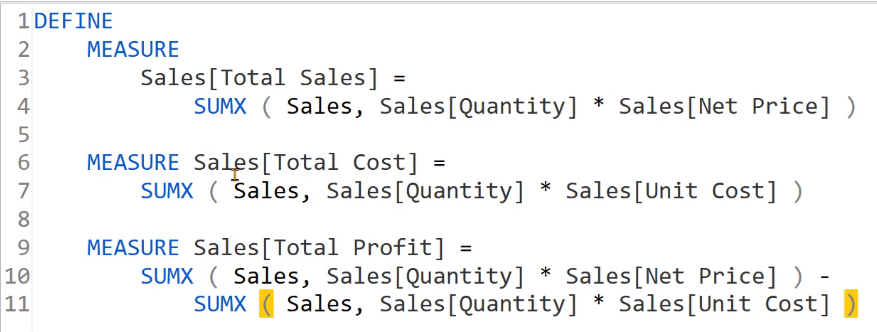
You can also create multiple measures within a single DAX query. Using multiple MEASURE keywords within a single DAX query allows you to simplify your code. For example, the DAX query below is used to compute for the Total Profit.
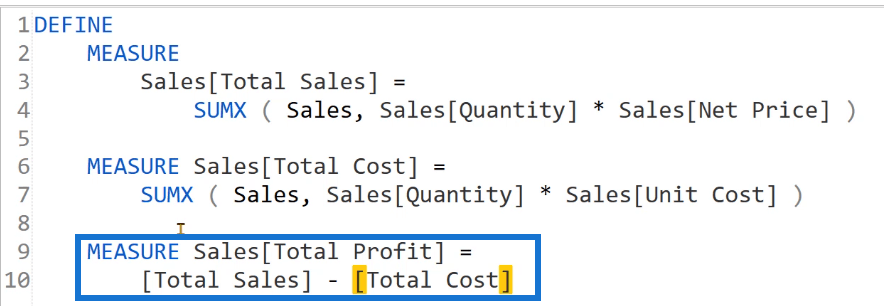
Notice that in the last MEASURE construct, the formulas for the first two measures are being repeated. So instead of using the formula, you can use the measure names to get the Total Profit.
Before executing the code, you need to use EVALUATE to create the table showing the results.
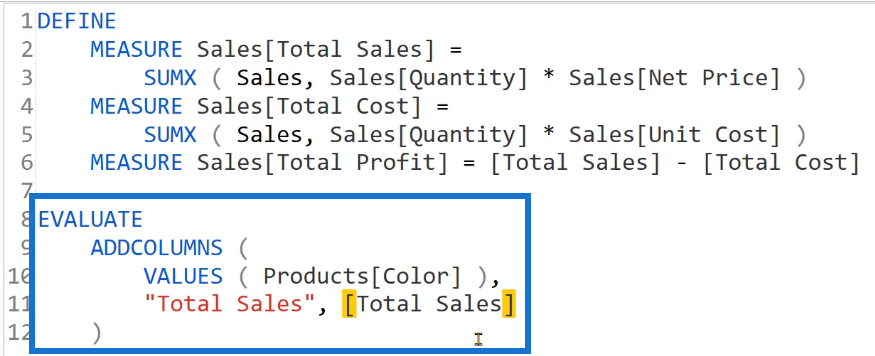
You’ll notice that Total Sales appears in the IntelliSense feature. This is because the same name exists in Power BI. DAX Studio will try to find out the nearest occurrence of Total Sales and will use the one available in the query.
Now, run the query.
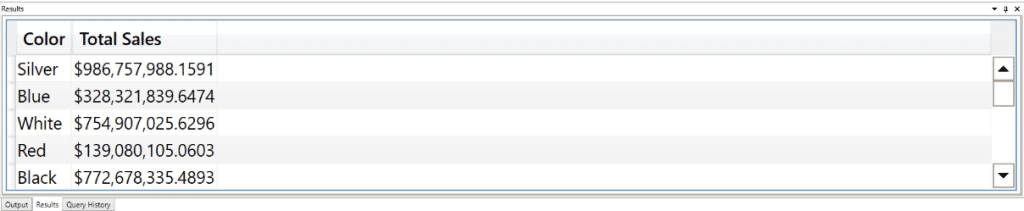
You’ll see that two columns were created. The first column shows the Product Color, while the second column shows the Total Sales.
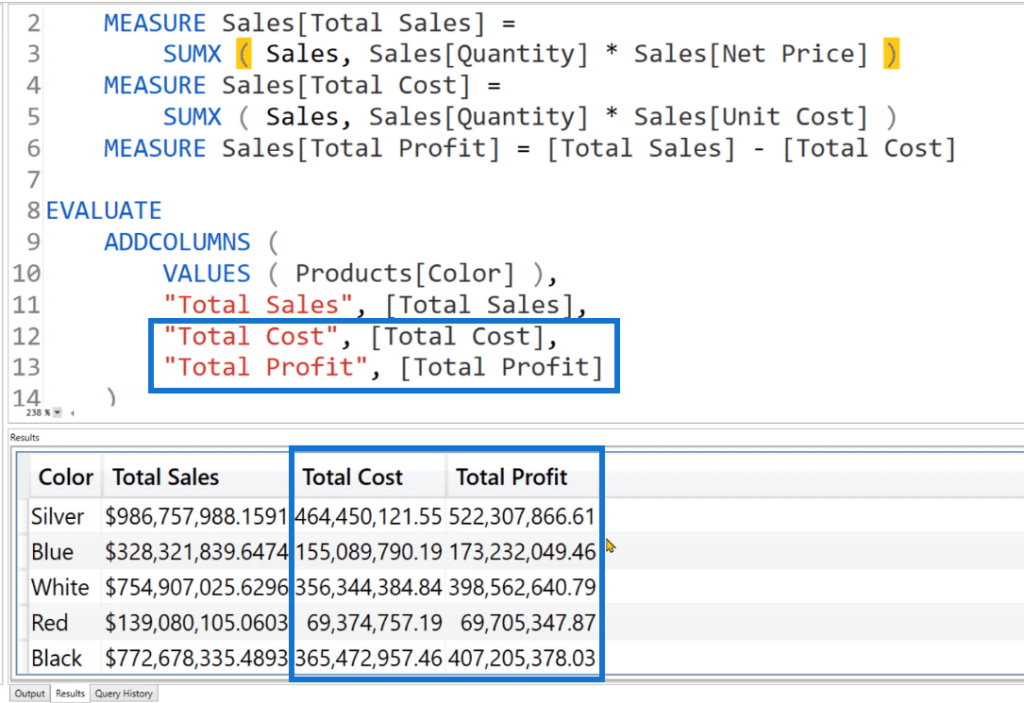
If you want to add columns for the Total Cost and Total Profit, simply add them under EVALUATE.
Notice that the values under the Total Sales column have the dollar sign. This is because of the default formatting in DAX Studio. You can toggle this formatting option by going to Options under the File tab and then Results.
Modifying Measures In A Filter Context
You can also use filters and slicers when using measures. For example, if you want to return the Sales percentage, create another measure. In this measure, create a variable for the CurrentSales and the AllSales.
For the AllSales variable, use the REMOVEFILTERS function to ensure that all the items in the Products table are included. To create the percentage, write RETURN DIVIDE ( CurrentSales, AllSales ).
To show the results, use the SUMMARIZECOLUMNS function.
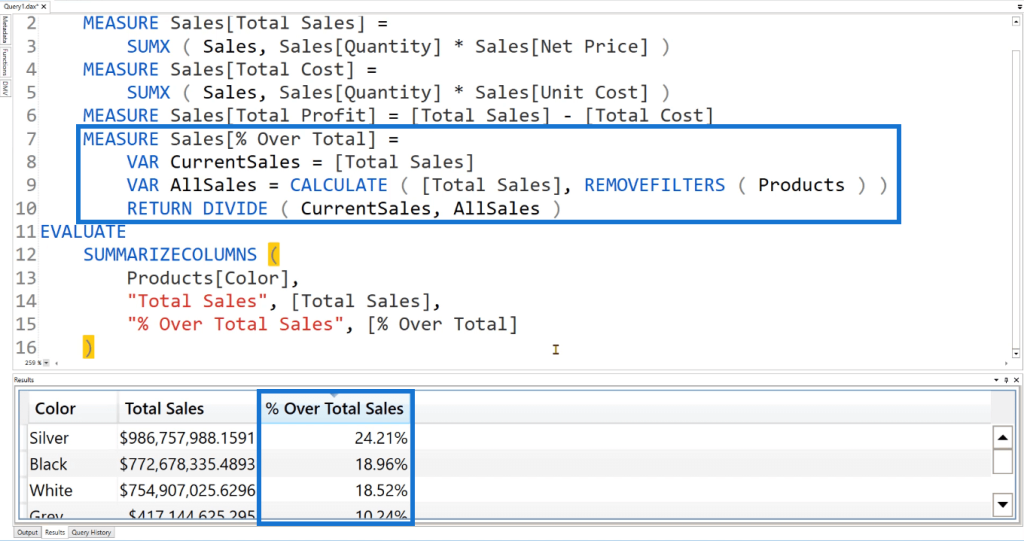
After you run the code, you’ll see a table containing the Total Sales and the Sales percentage. You can see that Silver has the largest share among all the product colors.
Similarly, you can mimic the behavior of a slicer. Instead of showing the Sales percentage of all the products, you can choose which products to include.

Instead of using the REMOVEFILTERS function, use ALLSELECTED. Then after the Products[Color] in EVALUATE, write TREATAS and then the product colors you’d like to include.
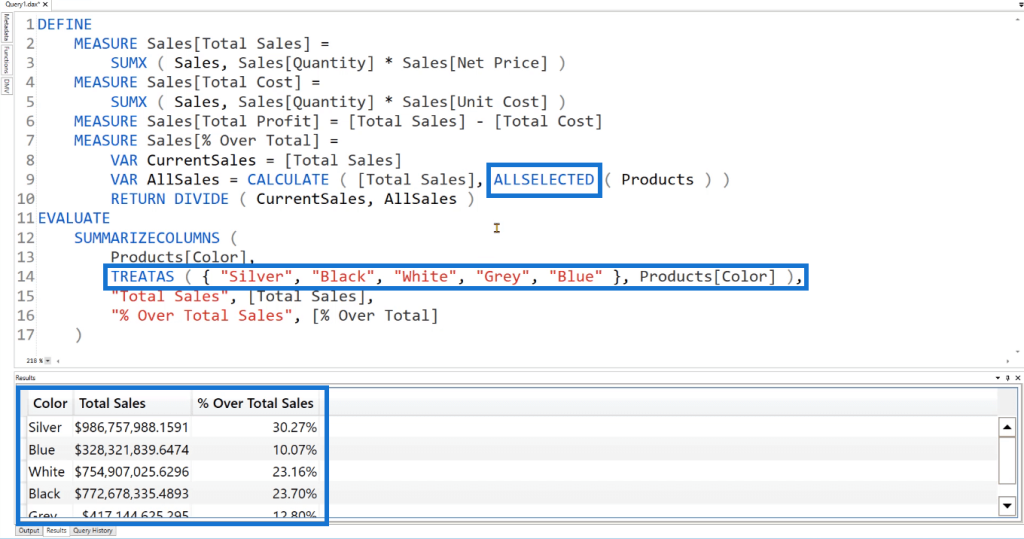
When you run this code, you’ll see that the colors in the table are only those you’ve specified. This is also how Power BI injects filter contexts from slicers.
Debugging Codes In DAX Studio
Query measures are very helpful when you want to debug the code of your measures. You won’t need to change or modify your Tabular Model.
If you try to make changes in Power BI concerning a data model with billions of rows, you’ll notice a visible delay in performing that operation. Instead, you can create query measures in DAX Studio, copy it, and then use it to do necessary modifications in your Power BI model.
***** Related Links *****
Data Modeling Techniques To Organize DAX Measures
Create Measures Using Tabular Editor 3
DAX Measure Analysis: Breaking Down Long DAX Measures
Conclusion
Whatever you create in DAX Studio won’t impact the data model in Analysis Services or Tabular Data Model.
But there’s an exception. If you copy the formula you used for a measure in DAX Studio and then use this in a measure in Power BI, you will create an impact to the Power BI data model. So it’s important to be particular when creating your code.
Enterprise DNA Experts


