
Today, you will learn how to calculate the ranking in a tabular form when fields from different dimension tables are brought together inside the table visual. You can watch the full video of this tutorial at the bottom of this blog.
Let’s jump onto the Power BI to kick it off.
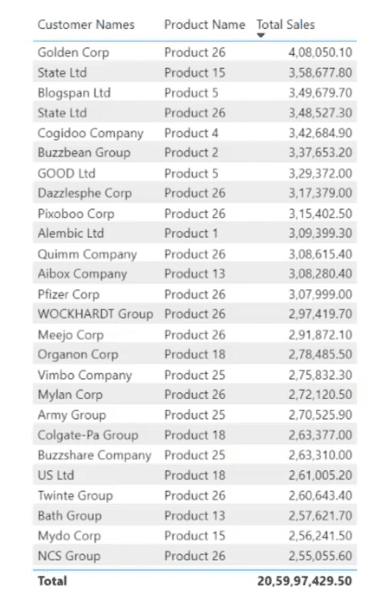
In this scenario, we created a table visual with the Customer Name field from the customer’s table and the Product Name field from the product’s table. We will analyze at a combined level which is our best-performing customers in combination with the product names based on Total Sales.

One of the things we should do when we start writing the measure for ranking is to reference the field names along with the table names inside the RANKX function.
In addition, since we know that the Product Name is being sorted by the product index field, we also need to include that field while evaluating the ranking.
As we can observe, the two fields from uplifting tables are coming together inside one table visual hence we will implement the CROSSJOIN function inside our RANKX function while referencing the table names.
We can now create our measure to evaluate the ranking at a combined level of customers and products.
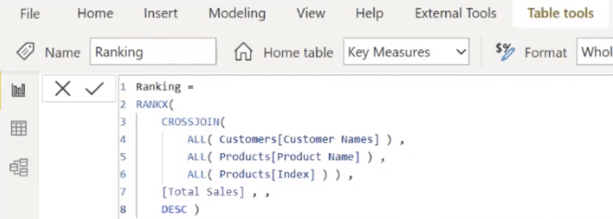
Let’s name our measure as Ranking. Then, use RANKX and CROSSJOIN functions.
By using ALL function, we also need to reference our field names one by one to Customer Names, Product Names, and Product Index field.
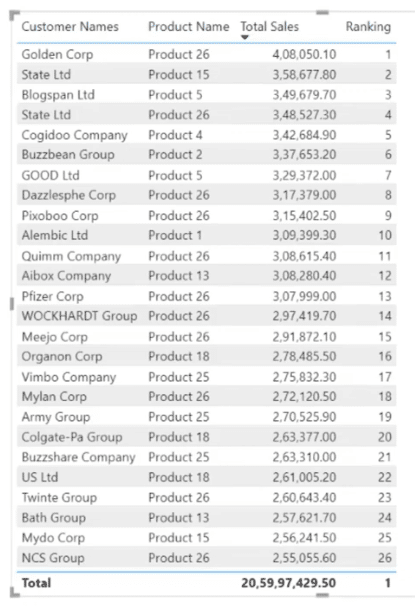
The next thing to do is call out our Total Sales measure and bring this ranking measure inside our table visual to analyze the results.

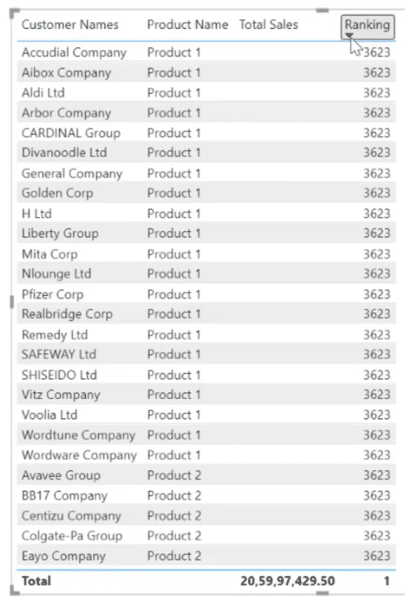
As we can see, we are getting the correct results. However, since we used the CROSSJOIN function, it creates a combination of all the rules between the customers and the products which resulted in evaluating the ranking against those rules where we don’t have the figures for the Total Sales.
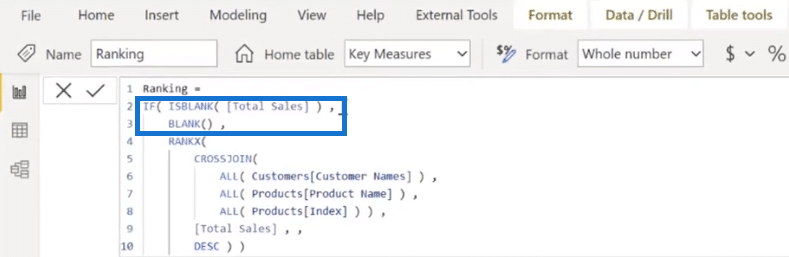
To rectify this kind of scenario, we need to insert and IF condition where we will calculate the ranking only where we have Total Sales else it should be blank.
To do that, let’s add IF (ISBLANK([‘Total Sales’]), BLANK ( ).
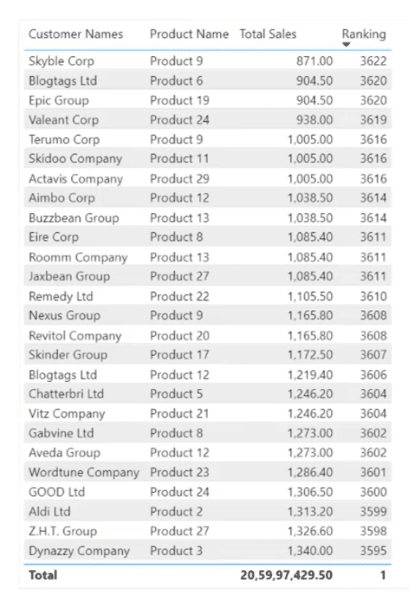
We can now see that it’s calculating the Total Sales only where we have sales figures and the rest of the combination of where we don’t have sales are ignored.
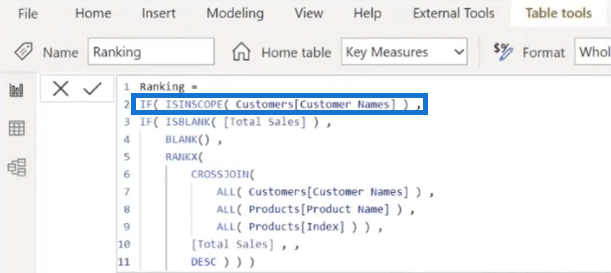
We also want to exclude the ranking at a total level by typing in IF(ISINSCOPE( Customers [Customer Names]). This will ignore the results at a total level.
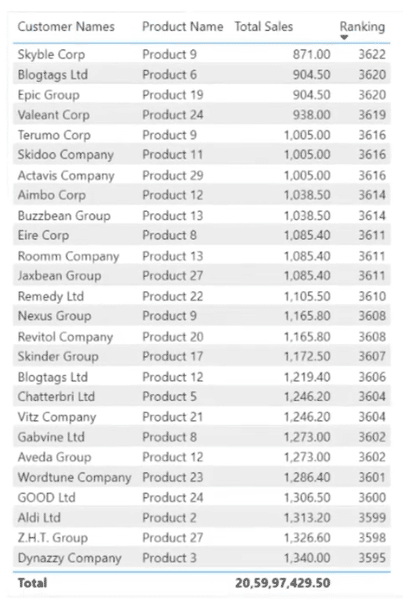
So there, the ranking at a total level is ignored as well.
***** Related Links *****
Calculate Percentage In Power BI In Hierarchical Form
Temporal Scale Using Calculated Columns In Power BI
CALCULATE Function – How It Can Affect Your Calculations In Power BI
Conclusion
The ranking is a great way to see the best or worst-performing variables in a given data set. Noticeably, it’s easy to calculate a ranking when fields from different dimension tables are brought together in a tabular form in Power BI.
Also, there are several rules where ranking is tied so if you want to learn how to break ties in Power BI, you can check out RANKX In Power BI | Developing Custom Tiebreakers tutorial as well.
I hope you’ve learned a lot from this simple technique. Please don’t forget to subscribe to the Enterprise DNA TV channel because we have a huge amount of content coming out all the time from our experts.
All the best,
Harsh


